
3 Unconventional Charts That Say Bitcoin Isn’t Done
Bitcoin might not have topped yet — and if it has, no one could have predicted it. Technical charts and on-chain analysis usually dominate my conversation, but sometimes alternative perspectives reveal insights that are easy to miss.
Today, we’ll explore 3 unconventional market indicators that tell a very different story from the typical Bitcoin narrative — and why a stealthy peak seems unlikely.
Let’s get into it.
Stable Macro Valuations: Bitcoin’s economic metrics remain balanced, hinting at growth potential before typical peak signals emerge.
Lagging High-Growth Assets: Compared to leaders like Nvidia, Bitcoin trails, suggesting space for a rally to align with past cycles.
Cautious Global Sentiment: Metrics like copper-to-gold reflect restraint, distant from the exuberance seen at previous market tops.
Favourable Growth Odds: Though not certain, these models lean toward further upside, encouraging a multi-faceted analytical approach.
Measuring Bitcoin Against Macro Forces
The first tool in our toolkit is the SPX-DXY Fair Value Model, a macro-based framework that situates Bitcoin within the broader financial ecosystem. Instead of focusing purely on price action, this model evaluates Bitcoin’s performance relative to two dominant global benchmarks: the S&P 500 (SPX) and the U.S. Dollar Index (DXY).
How It Works
6-Month Rolling Returns: Measures Bitcoin, SPX, and DXY returns over 6 months.
Weighted Influence: Applies adjustable weights to account for each benchmark’s impact on Bitcoin.
Deviation Metric: Highlights when Bitcoin’s performance significantly diverges from its expected fair value (red & green colours).
Historically, this deviation metric has been a reliable top signal. For example, in previous cycles, spikes into the +350 range often coincided with peak Bitcoin prices. These periods reflected excessive optimism across both crypto and traditional markets, signalling that the financial ecosystem as a whole had reached peak risk-on sentiment.
Right now, the SPX-DXY deviation is well below historical extremes. Bitcoin has been consolidating rather than exploding relative to equities and the dollar, suggesting that classic overvaluation isn’t present. From this macro lens, the market has yet to display the signature signs of a cycle top.
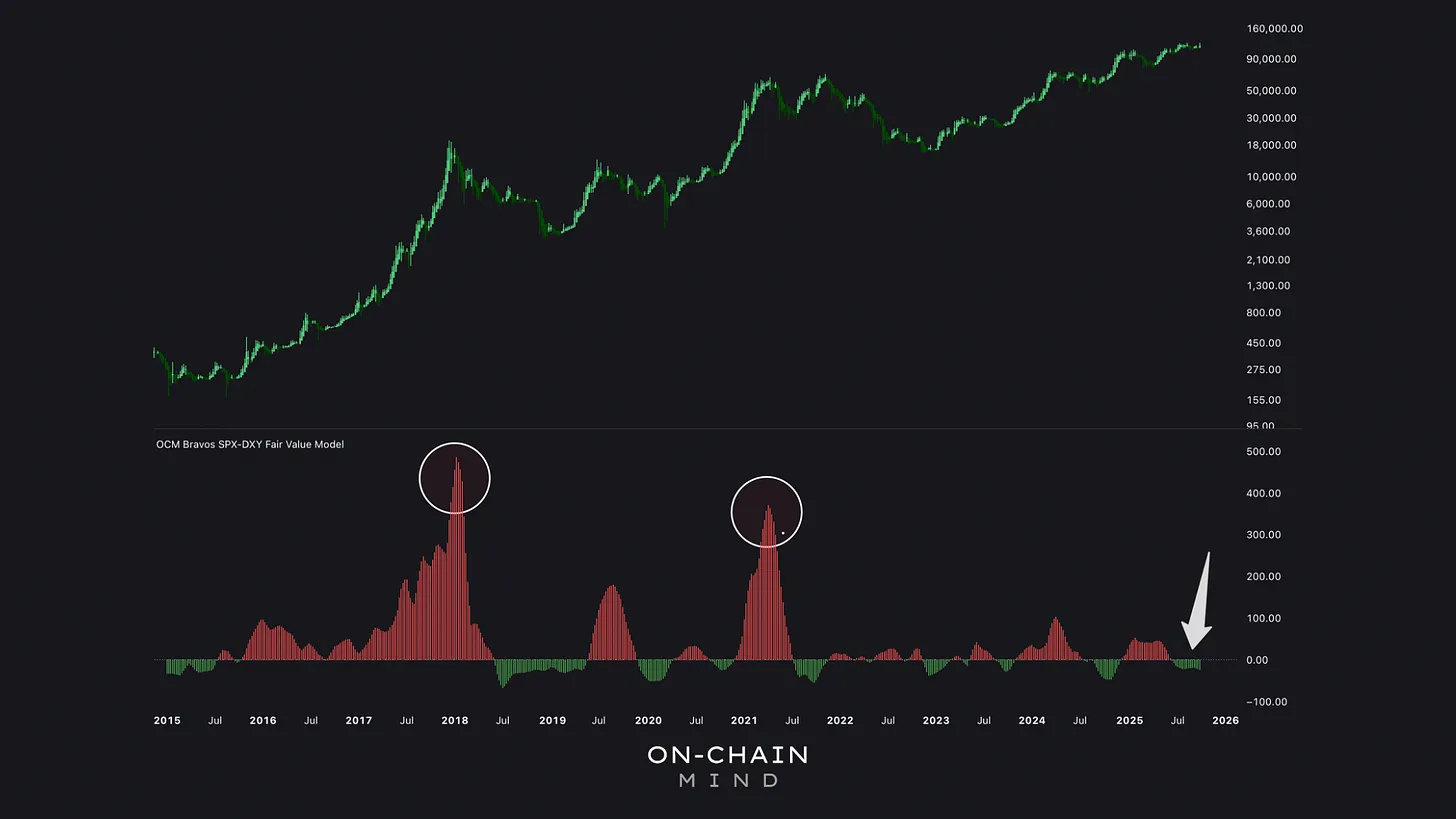
The deviation hovers in neutral territory, far from the red zones of past tops. Bitcoin has consolidated sideways, aligning more closely with SPX movements amid tech stock rallies and DXY fluctuations tied to Federal Reserve signals.
A High-Beta Benchmark
Next, we look at Bitcoin’s relative performance against Nvidia (NVDA). This model compares Bitcoin with a high-growth, high-beta asset rather than broad market indices, offering insight into leadership and momentum dynamics.
How It Works
Weekly Ratio: Bitcoin price divided by Nvidia price, smoothed with an EMA.
Fast and Slow Moving Averages: Highlight structural momentum in the ratio.
Bands: Identify when Bitcoin is stretched relative to Nvidia.
Currently, the ratio sits near 600. This tells us two things:
Nvidia’s dominance: Nvidia’s growth, driven by AI adoption and tech enthusiasm, has outpaced Bitcoin over recent years.
Bitcoin’s upside potential: To reach historical extremes, Bitcoin would need a parabolic rally relative to Nvidia — a scenario complicated by shared macro drivers that also lift Nvidia.
In essence, Bitcoin hasn’t yet entered a “frothy” phase where mass FOMO and rapid leadership outperformance typically signal cycle exhaustion.
For Bitcoin to match historical peaks — to say 5,000 — it would require a multi-fold rally, potentially 8x from current levels. Is this feasible? Parabolic moves aren’t unprecedented; Bitcoin multiplied 20x in late 2020. However, Nvidia’s entrenched growth make dramatic outperformance a challenging task.
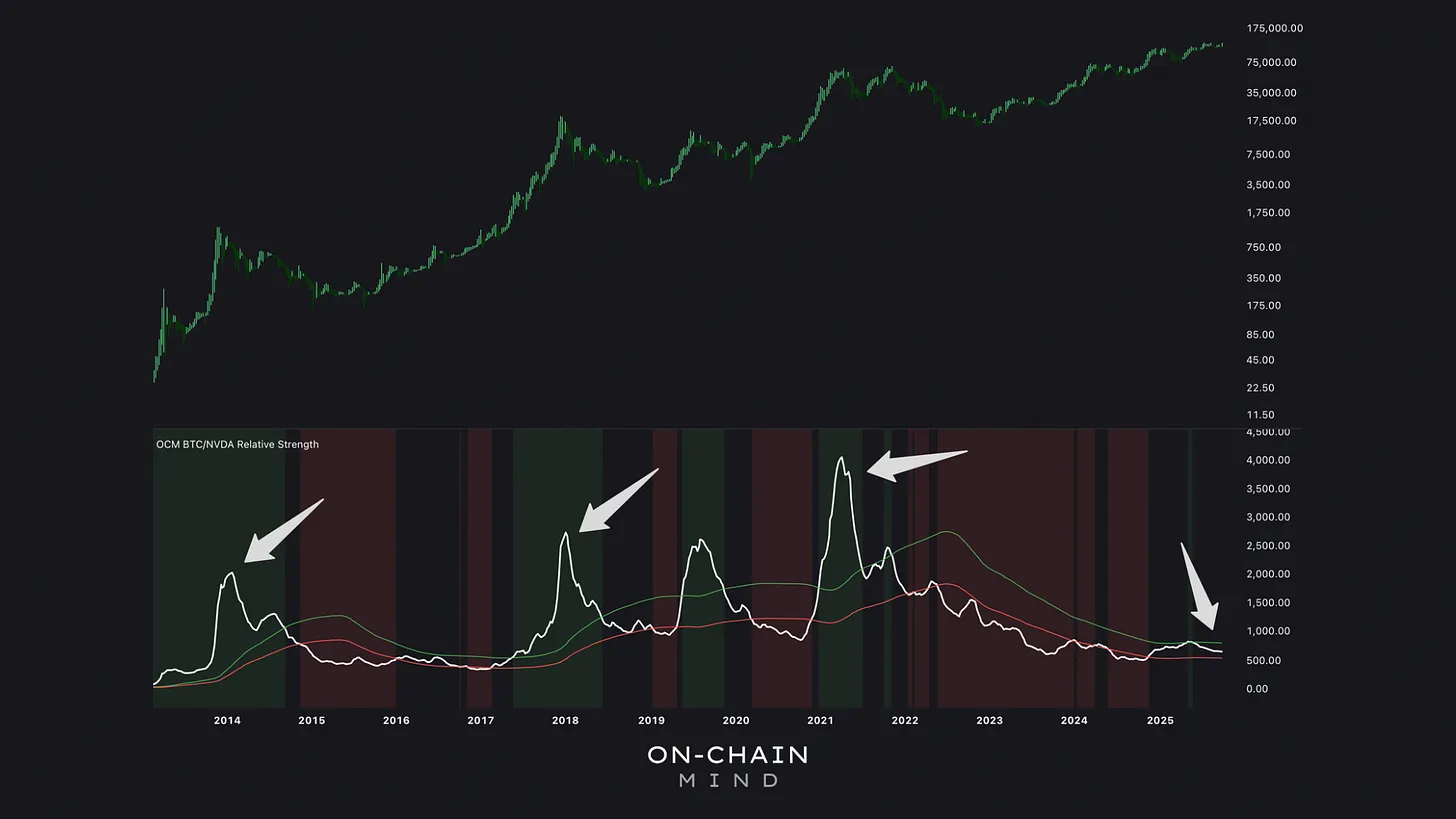
2013 Cycle: Ratio peaked around 2,000. 2017 Cycle: Ratio peaked around 3,000. 2021 Cycle: Ratio peaked around 4,000. Is 5,000 this cycle’s peak?
A Macro Risk Appetite Gauge
The final indicator comes from macroeconomics: the Copper-to-Gold Ratio, a long-standing measure of global risk appetite.
How It Works
Copper: Industrial metal sensitive to economic growth and investment cycles.
Gold: Safe-haven asset sought during uncertainty or financial stress.
The Ratio: Copper price ÷ Gold price. Rising ratios indicate risk-on sentiment; falling ratios indicate risk-off sentiment.
Historically, Bitcoin cycle peaks often coincided with elevated Copper-to-Gold ratios (around 0.3%). Currently, the ratio sits closer to 0.1%. The decline is largely due to:
Gold’s strong performance over the past year, driven by macro uncertainty and safe-haven demand.
Copper’s lagging growth, reflecting cautious industrial activity and muted risk appetite.
This subdued reading signals that global markets aren’t yet exhibiting the exuberance typically associated with Bitcoin’s blow-off tops.

The ratio sits down from highs, driven by gold’s surge amid 2022-2024 volatility. Copper, hampered by sluggish manufacturing, hasn’t matched pace.
The Broader Perspective
Looking across all 3 indicators provides a compelling multi-dimensional view:
SPX-DXY Fair Value: Bitcoin hasn’t reached historical overvaluation extremes relative to equities and the dollar.
BTC/Nvidia Ratio: Bitcoin remains far from the parabolic highs seen in previous cycles.
Copper-to-Gold Ratio: Macro risk-on sentiment hasn’t peaked.
Together, these signals suggest Bitcoin hasn’t displayed the type of exhaustion normally seen at cycle tops.
Caveats to Consider
Markets are never deterministic, and every cycle has unique quirks:
Macro conditions for the dollar and equities can shift due to policy, liquidity, or geopolitical factors.
Nvidia’s AI-driven surge may distort historical BTC/NVDA comparisons.
Commodity markets respond to global forces that aren’t driven by Bitcoin itself.
If Bitcoin has already peaked, it would have done so in an unprecedented, stealthy manner— breaking multiple historical patterns simultaneously.
My Take
For me, these unconventional models are valuable for context, but they aren’t the backbone of my analysis. I put far greater weight on on-chain metrics, which track the supply and movement of coins to give a fundamental read on market behaviour, and on technical structure, where price action and market mechanics help with market risk assessment.
Where conviction really builds is when these frameworks converge — when on-chain data, technicals, and even these unconventional models all begin pointing in the same direction. Markets rarely move on a single driver; they are always the product of fundamentals, sentiment, and broader macro forces working together. And when those different lenses start telling the same story, that narrative becomes much harder to ignore.
I’ll catch you in the next one.
Cheers,
