

•
Uncovering a Major Rotation Opportunity Unfolding
Bitcoin’s price in USD tells an important part of the story. But to understand its true value, we need to measure it against a time-tested benchmark: gold.
Right now, one of the most compelling setups isn’t about Bitcoin or gold individually, it’s about the relationship between the two.
In this article, we’ll unpack why the BTC/gold ratio matters, explore the technical signals pointing to a possible rotation play unfolding, and discuss how a measured approach can maximise opportunities without overexposing yourself to risk.
Let’s get into it.
The Bitcoin-Gold Nexus: Measuring Bitcoin against gold reveals its true value beyond the ever-expanding US dollar.
Overheated Gold and Undervalued Bitcoin: Gold’s recent bull run and Bitcoin’s relative positioning signals a potential rotation opportunity.
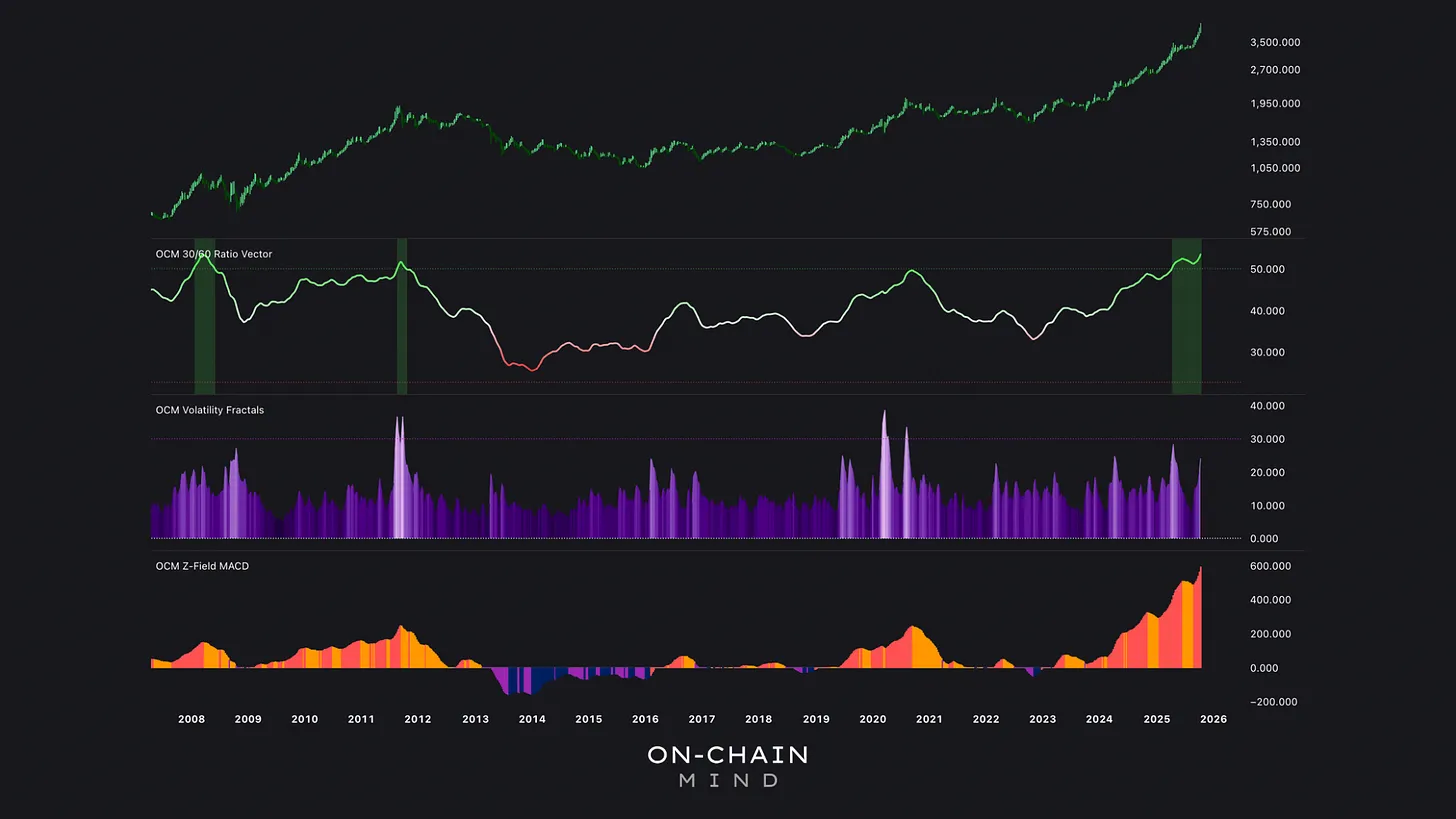
Technical Indicators Unveiled: Metrics like the Velocity, Volatility RoC, and 30/60 Ratio Vector highlight interesting momentum and relative strength trends.
Strategic Rotation Approaches: A slow, incremental rotation strategy, like reverse-DCA, can allow for rotated exposure while managing risk.
Digital Gold
Over the past few years, the Bitcoin narrative has certainly began to shift towards a story of “digital gold”. It’s a comparison that resonates because both assets are viewed as stores of value, albeit in very different ways.
Gold has a long history spanning thousands of years as a hedge against currency debasement and macroeconomic uncertainty. Bitcoin, with its fixed supply, decentralised nature, and this new “never-sell” narrative, is now starting to carve a similar reputation in our modern financial world.
And this comparison matters because it allows us to frame Bitcoin’s value relative to a more stable benchmark than the US dollar, which over the long term inevitably loses purchasing power due to continuous money printing.
Gold As The Benchmark
Gold has enjoyed an extraordinary surge in value over the past 3 years, nearly tripling in USD terms. Several factors have contributed to this rally:
Macroeconomic uncertainty and geopolitical tensions.
Aggressive monetary stimulus and continuous central bank money printing.
Increasing real nation-state demand for hard assets that preserve purchasing power.
But despite this strength, several of my favourite technical indicators suggest that gold might be overextended.
In other words, the current levels may be ripe for a correction as the market digests this historic bull run. That said, this article isn’t focused on gold’s USD price. Instead, let’s explore Bitcoin’s true value by looking beyond nominal prices and removing the US dollar from the equation entirely.
Technical indicators suggest gold is overheated. A correction — perhaps 10-20% in the near term — could materialise as markets digest these gains, especially if Fed policies stabilise or geopolitical tensions ease temporarily.
Measuring True Value
Rather than looking at Bitcoin and gold separately in USD terms, I’m going to examine the BTC/gold ratio. This ratio expresses Bitcoin’s value in terms of gold, eliminating the distortions of fiat inflation.
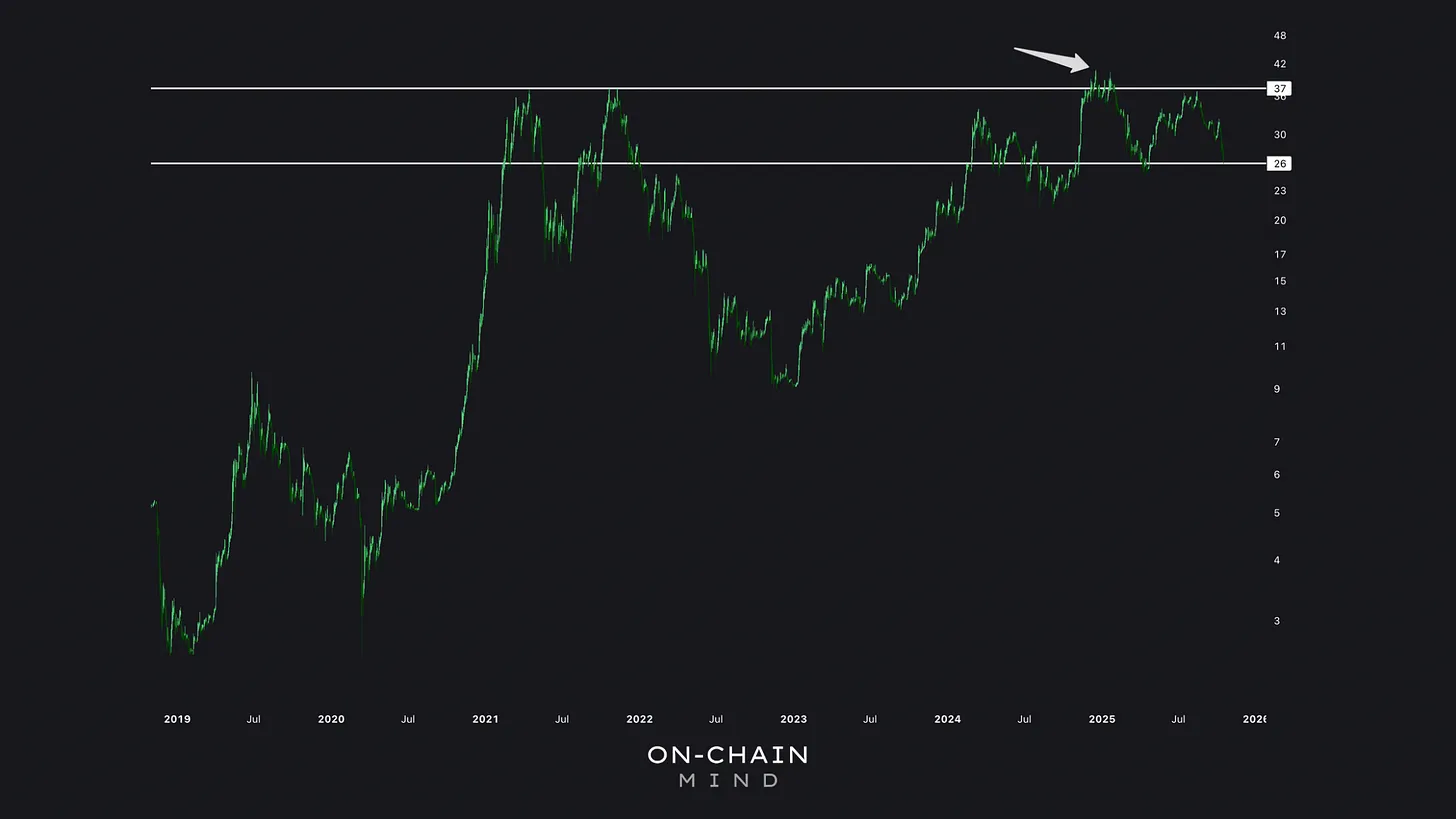
Currently, 1 Bitcoin ≈ 26 ounces of gold, significantly below the previous cycle’s all-time high of 37 ounces.
The BTC/gold ratio briefly peaked during the post-election rally in late 2024, but it quickly corrected, bringing it well below that previous high. This means that Bitcoin is still currently cheaper relative to gold than it was at the peak of the last cycle.
1 Bitcoin equates to approximately 26 ounces of gold at the moment. This is notably lower than the previous cycle’s peak of 37 ounces, achieved briefly once again in late 2024 amid post-election euphoria before a swift retreat.
Understanding Asset Volatility
Gold and Bitcoin are fundamentally different in their price behaviour:
Gold: stable value, slower drawdowns, suitable for long-term, risk-averse investors.
Bitcoin: volatile, fast-moving drawdowns, potential for outsized gains if managed correctly.
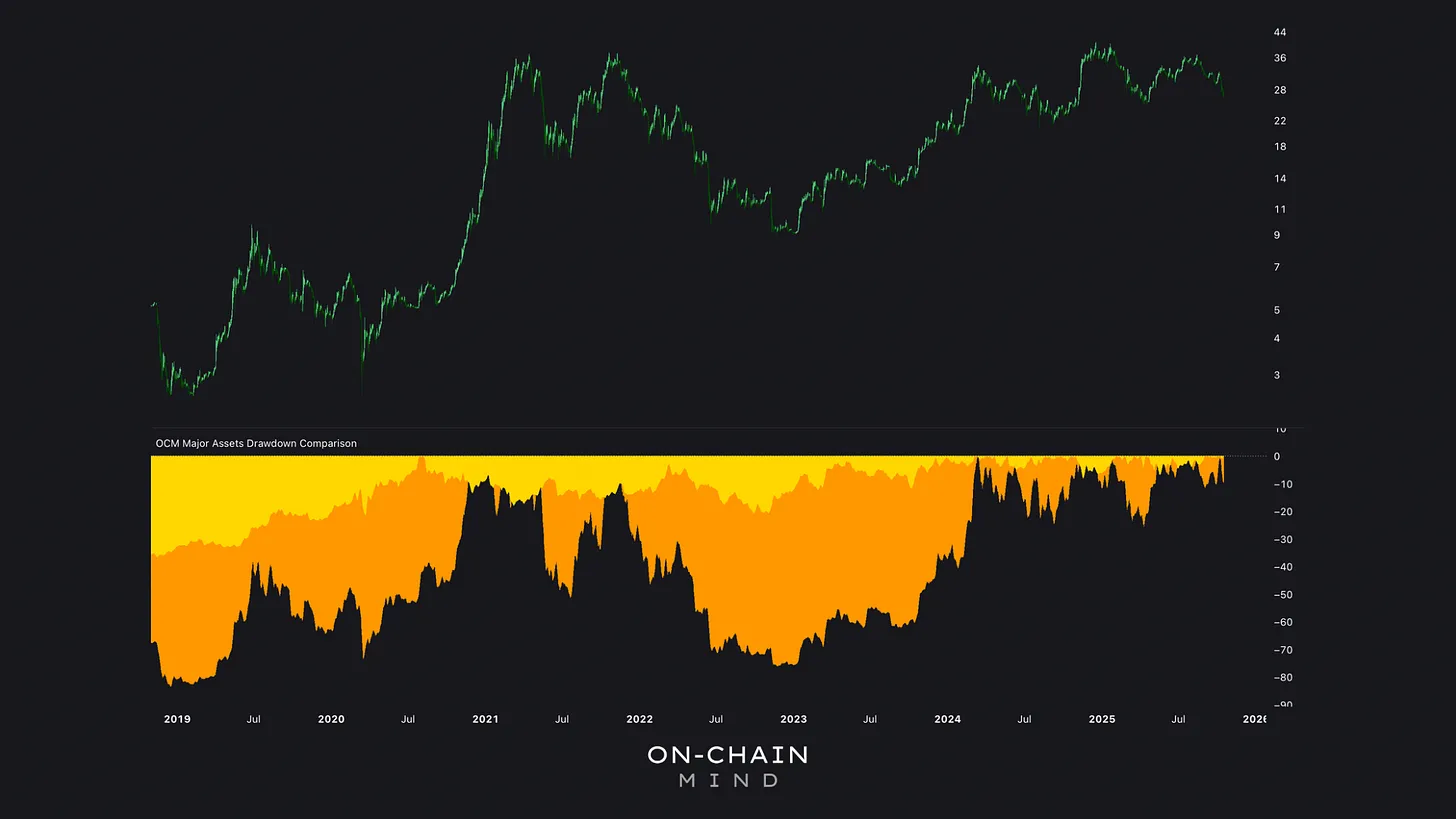
Visualising these drawdowns highlights the obvious difference: Bitcoin’s swings are far more intense. But for those with the stomach to endure them, the upside more than makes up for it. And for those with tax-efficient accounts, rotation between the two assets has also been historically profitable.
Gold’s drawdowns are typically shallower and slower, averaging 20-30% in major corrections. Bitcoin, by contrast, endures brutal swings: 50-80% drawdowns in cyclical bear markets.
Bitcoin vs. Gold Velocity
To assess the potential for rotation between Bitcoin and gold, we’ll have a look at 2 custom indicators. Each offers a unique perspective:
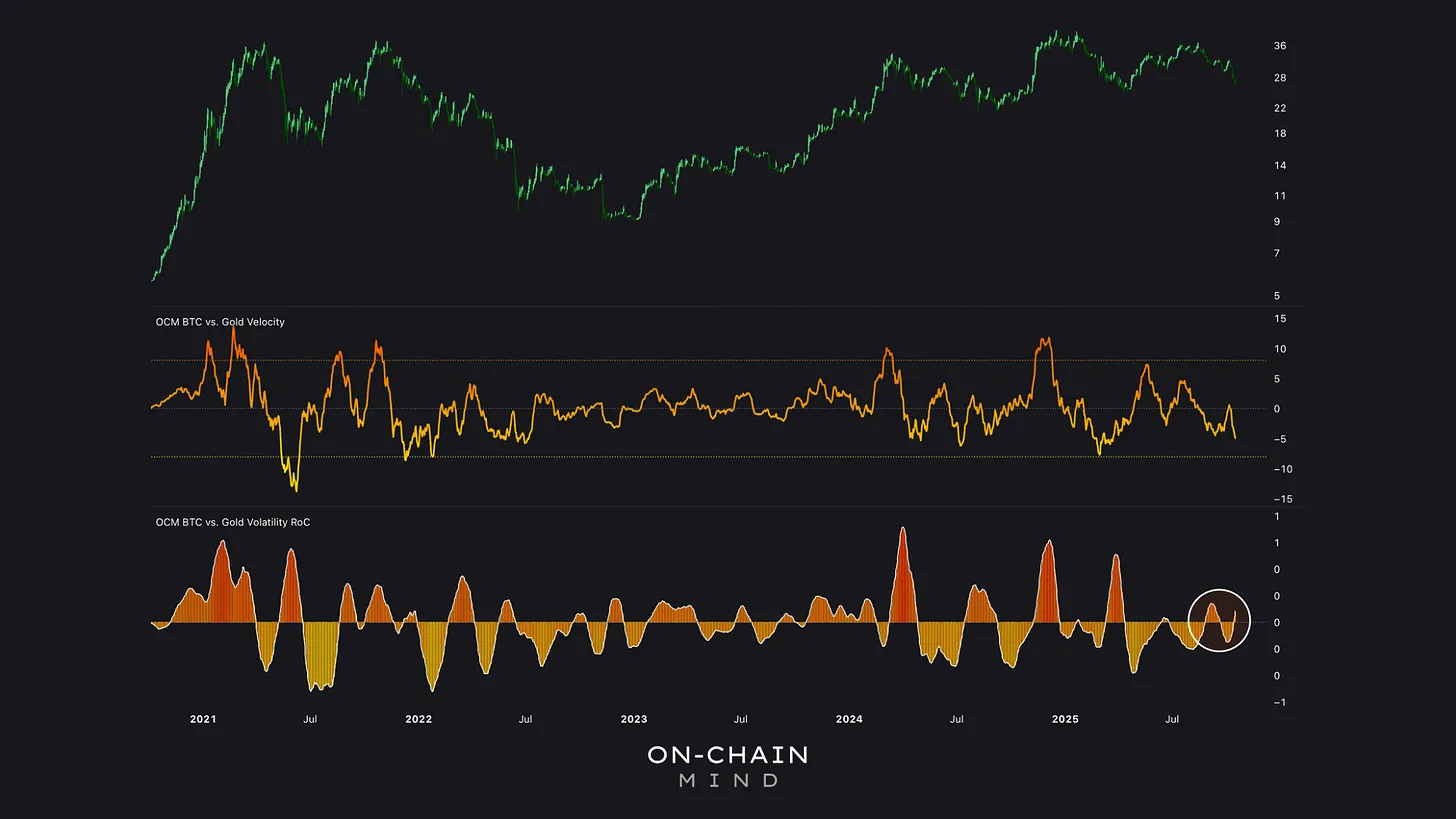
This indicator tracks momentum in the BTC/gold ratio over time, and current readings show a sharp drop into deep yellow levels. This suggests that relative Bitcoin strength is approaching major lows, providing a directional cue to begin incrementally rotating from gold into Bitcoin.
This isn’t a “go all-in” signal. Rather, it’s a guide that highlights periods when Bitcoin exposure may be favourable relative to gold.
Momentum is now dropping sharply into deep yellow levels — historically, the zones where rotation from gold into Bitcoin becomes favourable. This indicator has also reliably flagged major cycle tops and local peaks in both previous and current cycles.
BTC vs Gold Volatility RoC
The Volatility Rate-of-Change (RoC) indicator measures how quickly the BTC/gold ratio moves, using an ATR-based calculation. When volatility accelerates, it often signals that a trend is reaching an extreme.
At present, however, despite the downside move in the ratio, volatility has not spiked, suggesting the trend may still have further to play out before a confirmed reversal takes shape.
Volatility clusters: high periods follow low ones. Currently, despite the ratio’s downside, volatility hasn’t spiked dramatically. This subdued reading suggests the move lacks conviction; it could extend further or reverse sharply.
A Cohesive Narrative
Bringing these indicators together provides a structured view: Bitcoin is undervalued relative to gold, momentum is near lows, and volatility hasn’t spiked. To me, that’s the kind of setup that warrants attention. Not for reckless bets, but for a measured, calculated rotation.
These metrics don’t predict outcomes; they frame probabilities. Acting impulsively on every signal is how gains are lost. With the Volatility RoC still quiet, diving in all at once could easily leave you wishing you’d waited. That’s why I always advocate a slow, reverse-DCA approach, gradually rotating into Bitcoin while trimming gold exposure. It spreads risk across time, not price, and keeps emotion out of the equation.
But beyond the charts and metrics lies something far more important: human behaviour. Markets are simply reflections of psychology — fear, greed, and hope, playing out in real time. Indicators can help you decode that chaos, but the real edge comes from patience, discipline, and self-awareness.
After watching multiple cycles unfold and analysing long-term trends, I see this current BTC/gold setup as one of relative undervaluation and improving momentum. Bitcoin remains in gold’s shadow — but these shadows don’t last forever.
This feels like an environment not for speculation, but for thoughtful reallocation — a chance to honour both assets’ strengths while positioning for what may come next.
I’ll catch you in the next one.
Cheers,
