
The crypto market has just endured its most severe liquidation event in history, and yet, MSTR has stubbornly held above $300. On the surface, that seems surprising — especially considering MSTR has lagged Bitcoin for most of the year. But when we step back and analyse the broader picture, of course a more nuanced story emerges.
In this article, I’m going to break down both the short-term bullish and bearish cases, dive into the technical indicators I use to track momentum, volatility, and trend structure, and provide you with a framework to understand where MSTR stands today.
Let’s get into it.
Historical Outperformance: Despite recent lags, MSTR has delivered over 800% returns compared to top assets like Nvidia since adopting its Bitcoin strategy.
Momentum Rebound Potential: Technical indicators suggest extreme momentum contraction, often a precursor to significant expansions.
Volatility as a Catalyst: Suppressed volatility has hindered short-term gains, but historical patterns indicate an imminent return to dynamic market conditions.
Bearish Risks Tied to Bitcoin: Key support levels around $280 could signal a shift if breached, and we must closely monitor Bitcoin’s own trajectory.
MSTR’s Stubborn Resilience
The crypto market recently faced an unprecedented liquidation event, wiping out $19 billion in leveraged positions across exchanges and affecting over 1.5 million traders. Yet, Strategy’s stock has held firm above $300, a surprising feat given its underperformance relative to Bitcoin for much of 2025.
But when we take a step back and compare MSTR’s performance against other high-growth benchmarks such as Bitcoin, the NASDAQ 100, the S&P 500, Nvidia, and Tesla, the scale of its long-term outperformance becomes truly striking.
This tells me something important: while short-term volatility can mask performance, the strategy itself is robust. That is why I remain a shareholder — the approach is transparent, repeatable, and directly tied to Bitcoin’s upside.
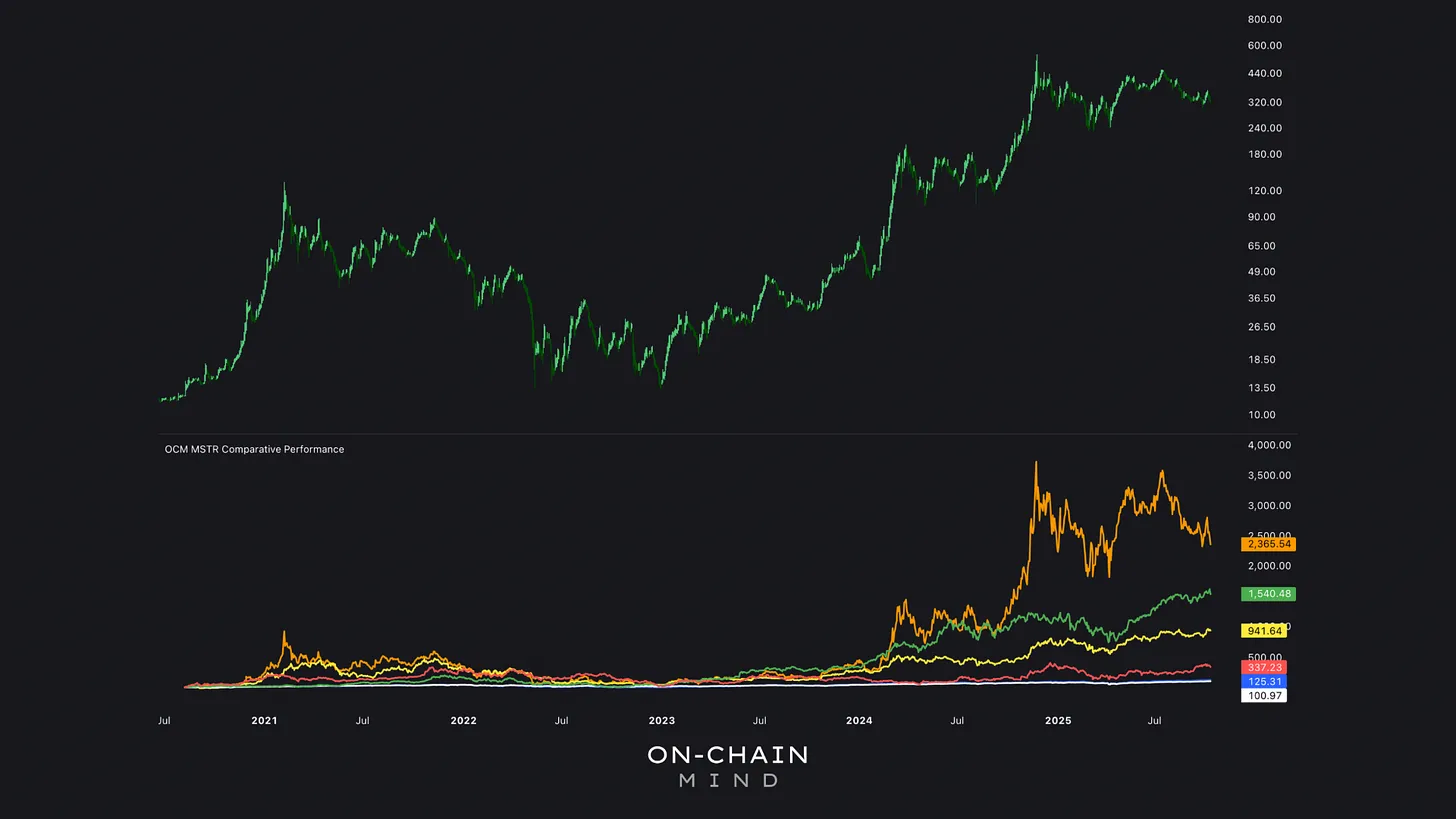
Since adopting its Bitcoin strategy in 2020, MSTR (orange) has outperformed all major assets, including NVDA (green) by a staggering 800%, underscoring the strategy’s robustness.
A Refresher on Their Strategy
MSTR’s mission is elegantly simple: deliver Bitcoin yield by increasing Satoshis per share.Since 2020, it has achieved this annually through strategic debt issuances, equity offerings, and opportunistic Bitcoin purchases.
What makes this strategy particularly compelling is its transparency and repeatability.Every decision — whether buying more Bitcoin, managing debt, or adjusting exposure — is clearly tied to the goal of accumulating more Bitcoin per share. Over time, this has allowed MSTR to outperform most major assets despite periods of short-term volatility.

Credit: strategy.com
The Bullish Case for MSTR
When I analyse MSTR, I focus on the alignment of trend, momentum, and volatility. Several technical indicators currently suggest the potential for upside, even after a period of underperformance.
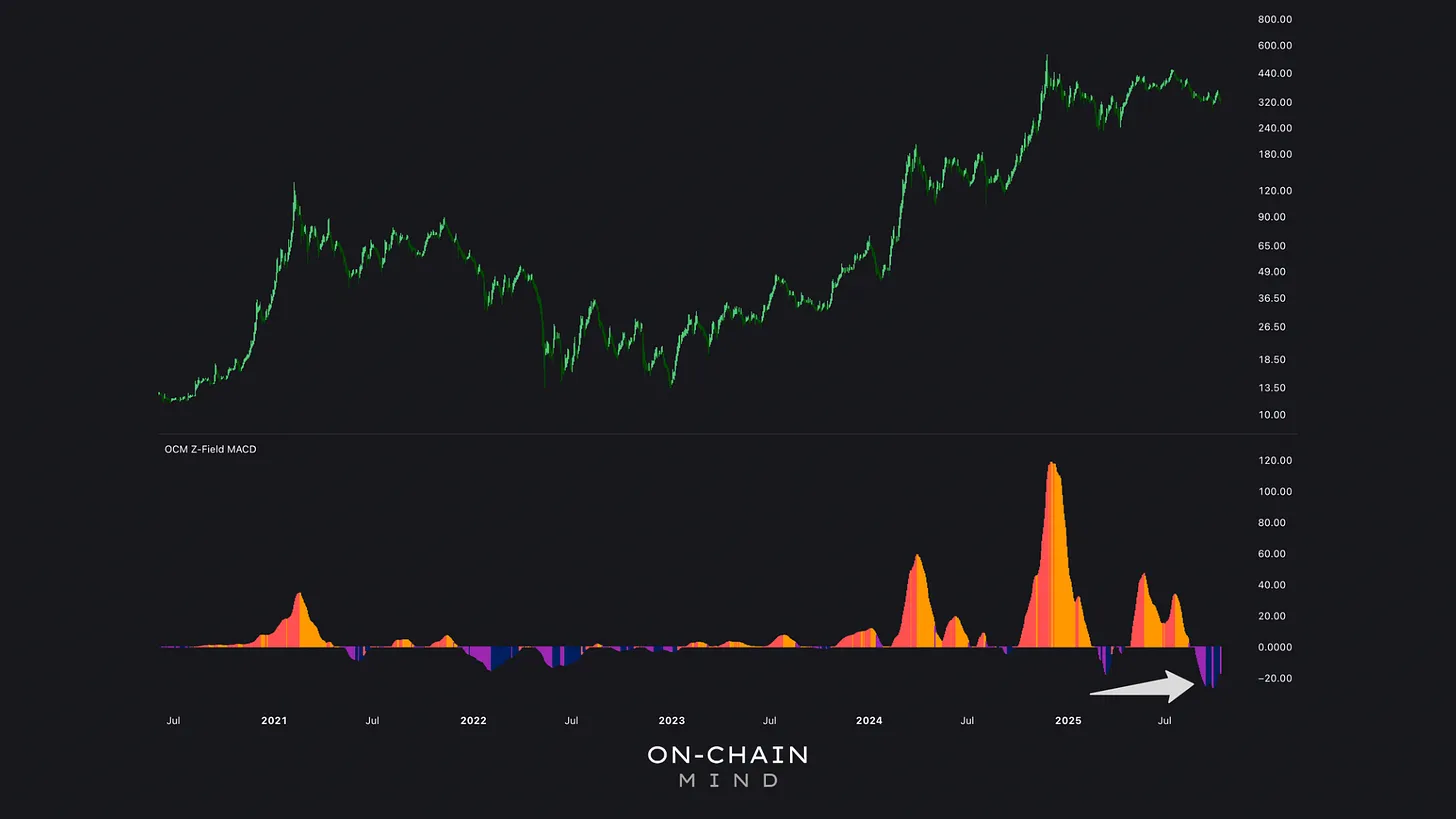
Z-Field MACD
This is a momentum-sensitive oscillator built around the Zero-Lag Exponential Moving Average (ZLEMA) framework. Unlike conventional MACD, it calculates a midpoint from a ZLEMA of the median price, flanked by smoothed envelopes derived from highs and lows. The histogram measures expansions and contractions in momentum.
Currently, it’s at its lowest reading since MSTR’s Bitcoin strategy began, signalling extreme oversold conditions. Historically, such contractions — like the 2022 bear market bottom — preceded rallies exceeding 200-300%, suggesting a coiled spring is maybe ready to unleash.
Z-Field MACD
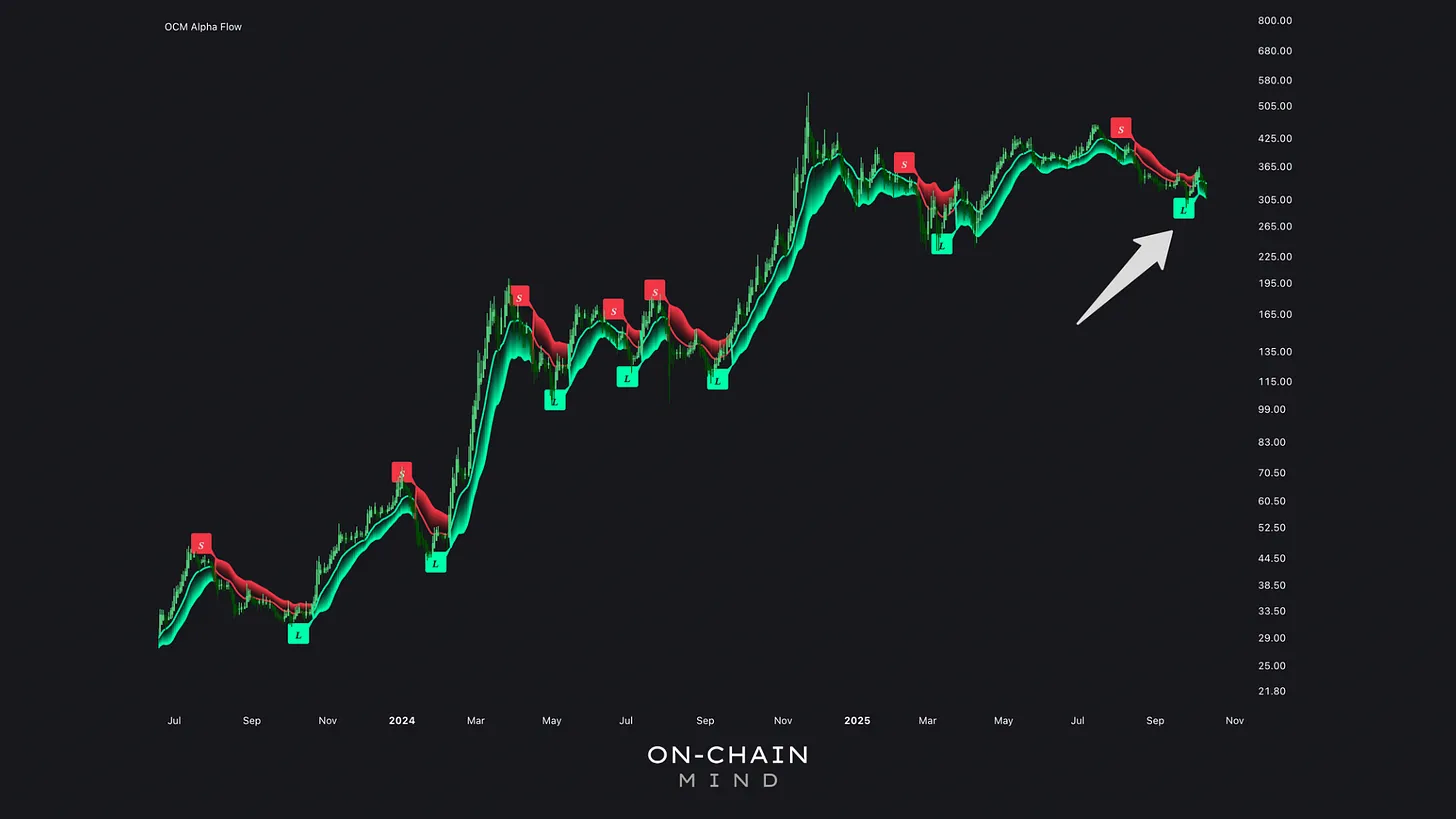
Alpha Flow
This indicator dynamically adjusts to market conditions using EMA-based calculations. It generates a basis line and volatility-adjusted envelopes, where price relative to the bands indicates trend strength or weakness. Crossovers signal potential reversals.
In practical terms, long signals during bull markets have historically returned at least 20%, and in some cases, up to 2-3x return on your investment during particularly bullish moves. Capturing these gains relies heavily on the alignment of trend, momentum, and volatility, and current readings suggest immediate upside potential, provided the structural bullish framework remains intact.
Alpha Flow
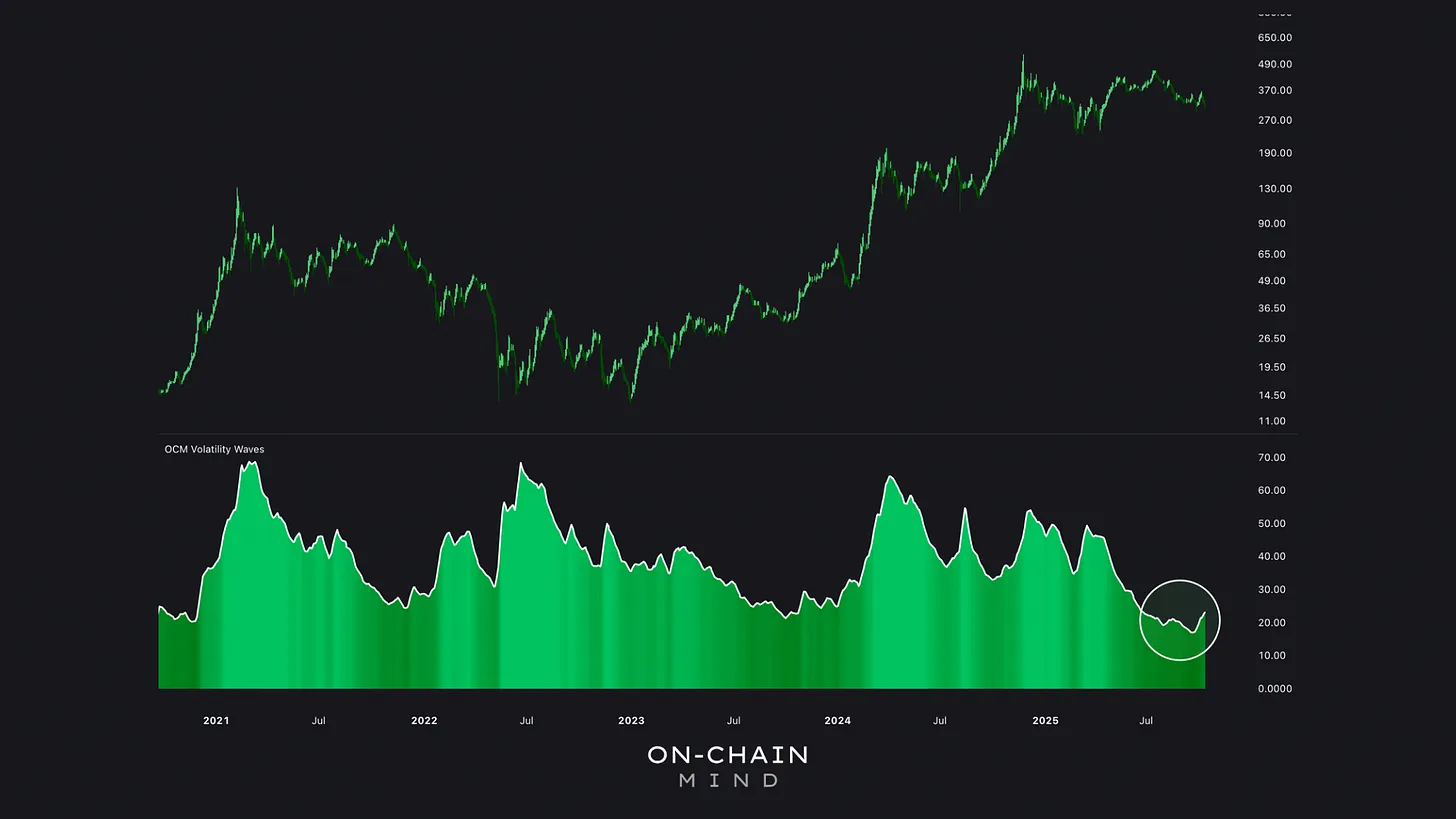
Volatility Waves
Michael Saylor often says, “volatility is vitality”, and this is especially relevant for MSTR. The Volatility Waves indicator measures the standard deviation of logarithmic returns over a defined period and smooths it to reveal persistent trends.
My observations show that current volatility is historically low, which helps explain MSTR’s recent underperformance, as Saylor’s strategy relies on generating vol to accumulate more Bitcoin. In my opinion, this suppressed volatility cannot last indefinitely, and when it returns, it has the potential to drive substantial upside.
Upside Potential in Numbers
If Bitcoin revisits its most recent all-time high of $125,000 and MSTR’s mNAV reverts to historical norms (around 2x), my calculations suggest a potential MSTR price of ~$500. While speculative, this provides context for how momentum and volatility could translate into real short-term gains.
Volatility Waves
The Bearish Case for MSTR
It’s always critical to weigh the downside, and there are risks you can’t ignore. MSTR is fundamentally tied to Bitcoin, so bearish movements in BTC almost always impact MSTR.
Moving Average Cloud
The 30D vs. 365D Moving Average Cloud gauges market regimes: green signals bull, red warns of bears. Bitcoin dropping below $99,000 turns the cloud red, with MSTR’s threshold at $281 — perilously close to current price levels.
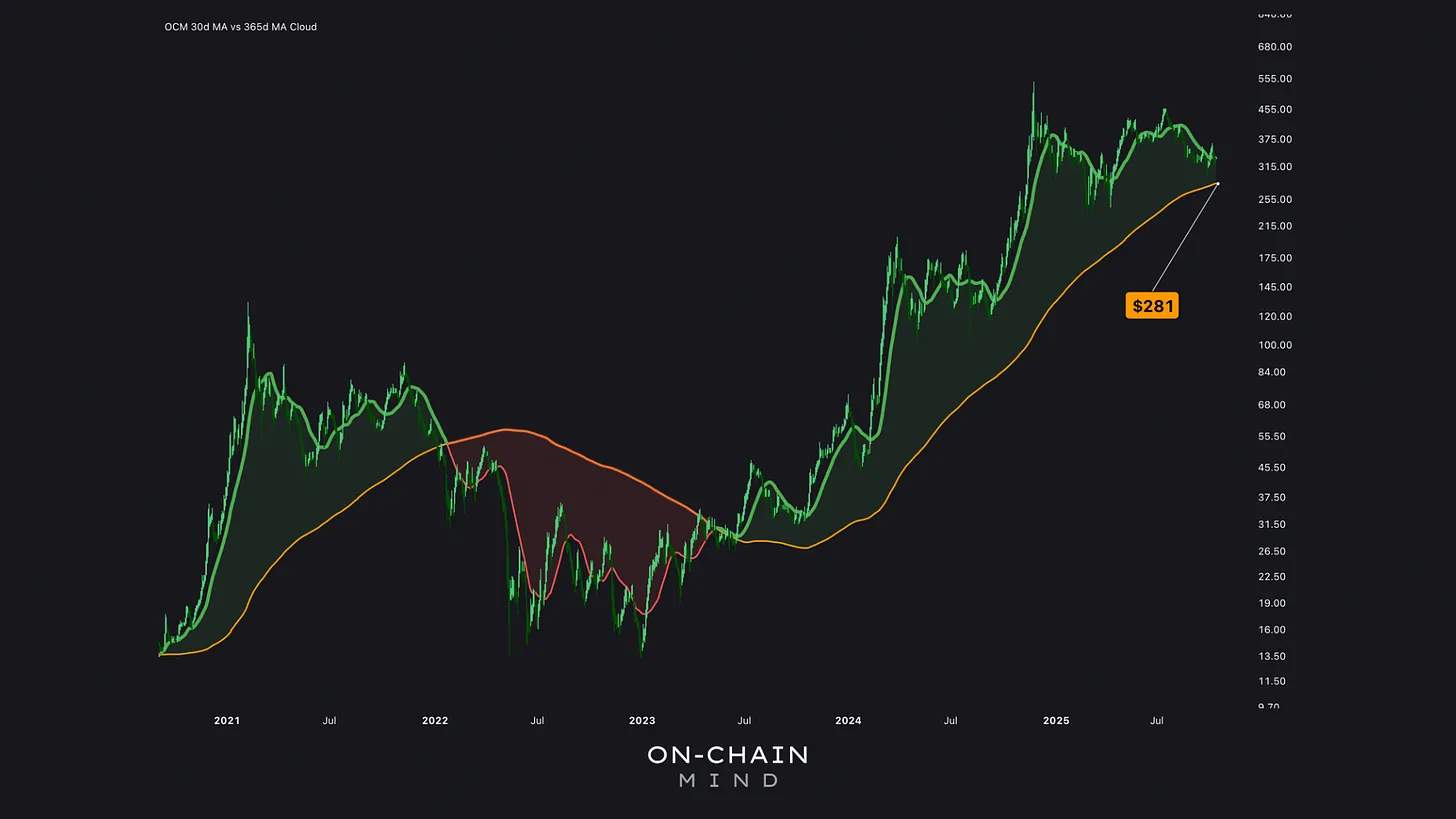
30D vs. 365D MA Cloud
Flow Ribbons
This popular indicator plots 7 EMAs from short to long, giving an interesting view of trend context.
Historically, breaks above the final ribbon have confirmed bullish trends, as we saw in April 2023, while breaks below the ribbon have signalled bearish shifts, such as in January 2022. Currently, the final bearish ribbon sits at $287, and a clean break below this level would indicate a structural shift, forcing a reconsideration of any bullish thesis, even if it pains me to do so.

Flow Ribbons
Reflecting on the Bigger Picture: Volatility, Vision, and Opportunity
Bringing it all together, I see MSTR at an intriguing crossroads.
On the bullish side, the historically low momentum readings on the Z-Field MACD, combined with long signals from the Alpha Flow and the first signs of rising volatility, suggest to me that the market is coiled and ready for a meaningful move. I would argue that these aren’t just technical coincidences — they could be setting the stage for outsized returns once conditions shift.
But on the bearish side, the risks are very real and shouldn’t be ignored. Bitcoin’s position relative to the MA Cloud, MSTR’s ability to hold its Flow Ribbons, and the looming threat of a breakdown below $280 all signal that a misstep in BTC could quickly translate into significant downside for MSTR. In my opinion, this is why I remain cautious around positions that assume a smooth path higher; the market has a way of testing structural support before rewarding risk.
Fundamentally, I think the story here is about volatility as opportunity. The current suppression explains the recent stagnation, but I see this as a temporary pause rather than a structural problem. When volatility returns — and history tells us it inevitably will — it could unlock the kind of upside that makes this setup compelling. Personally, I’m watching these key levels closely, not just for trade signals, but as a barometer for when the strategy is likely to resume functioning at full strength.
Ultimately, MSTR still remains an exceptional vehicle for Bitcoin exposure. But I’m not selling nor buying at these levels; I’m waiting to see some validation, whichever way the market decides to move.
I’ll catch you in the next one.
Cheers,
