
A Brutally Honest Look at the Data
Bitcoin has just crossed a threshold it has never breached this entire bull cycle, and every previous time this happened, it marked the start of the next bear market.
In this article, I’ll unpack the technical breakdowns, explain why this cycle defies traditional patterns, and explore what the on-chain and statistical data are signalling about how low we might go — and exactly how I’m positioning for it.
Let’s get into it.
The Triple Breakdown: Bitcoin closed below 3 key technical levels for the first time this cycle, signalling heightened bear market risk.
Long-Term Holder Behaviour: Unusually, long-term holders are selling into weakness — a rare and worrying behavioural shift.
No Blow-Off Top = Shallower Bear: Without euphoric mania, statistical models point to a ~50% drawdown at most, not 80%+.
Confluence of Frameworks: Cost Bands, Z-Score Probability Waves, Volume Profile, and structural levels all agree on the same downside zone.
The Technical Fracture Nobody Can Ignore
We’ve reached a pivotal moment. Bitcoin has closed multiple times below 3 major technical thresholds:
Short-Term Holder (STH) Realised Price — $110,000
200-day Moving Average — $110,000
365-day Moving Average — $102,000
Historically, every time all 3 were breached, a bear market followed. In every prior cycle – 2014, 2018, 2022 – this exact breakdown was the starting gun for the multi-year bear. That doesn’t mean we are definitively in a bear now, but the risk is real and should be taken seriously.
But context matters enormously. In previous cycles that breakdown happened after a parabolic blow-off top and months of v-shaped distributions. This obviously hasn’t happened this time around.
Key Pricing Levels
Long-Term Holders Behaving Badly
Perhaps the single most unsettling data point right now is the behaviour of long-term holders (LTHs). These are the diamond-handed cohorts that typically only sell into raging strength, when the majority are aping in at the top.
This time they are realising profits while price falls. That is almost unprecedented. It tells us two things:
Conviction among even the oldest hands is wavering at these levels.
Supply pressure is coming from the strongest possible source – the very participants who normally absorb every dip.
When the people who have held through 85% drawdowns start pressing the sell button on red candles, you have to sit up and pay attention.
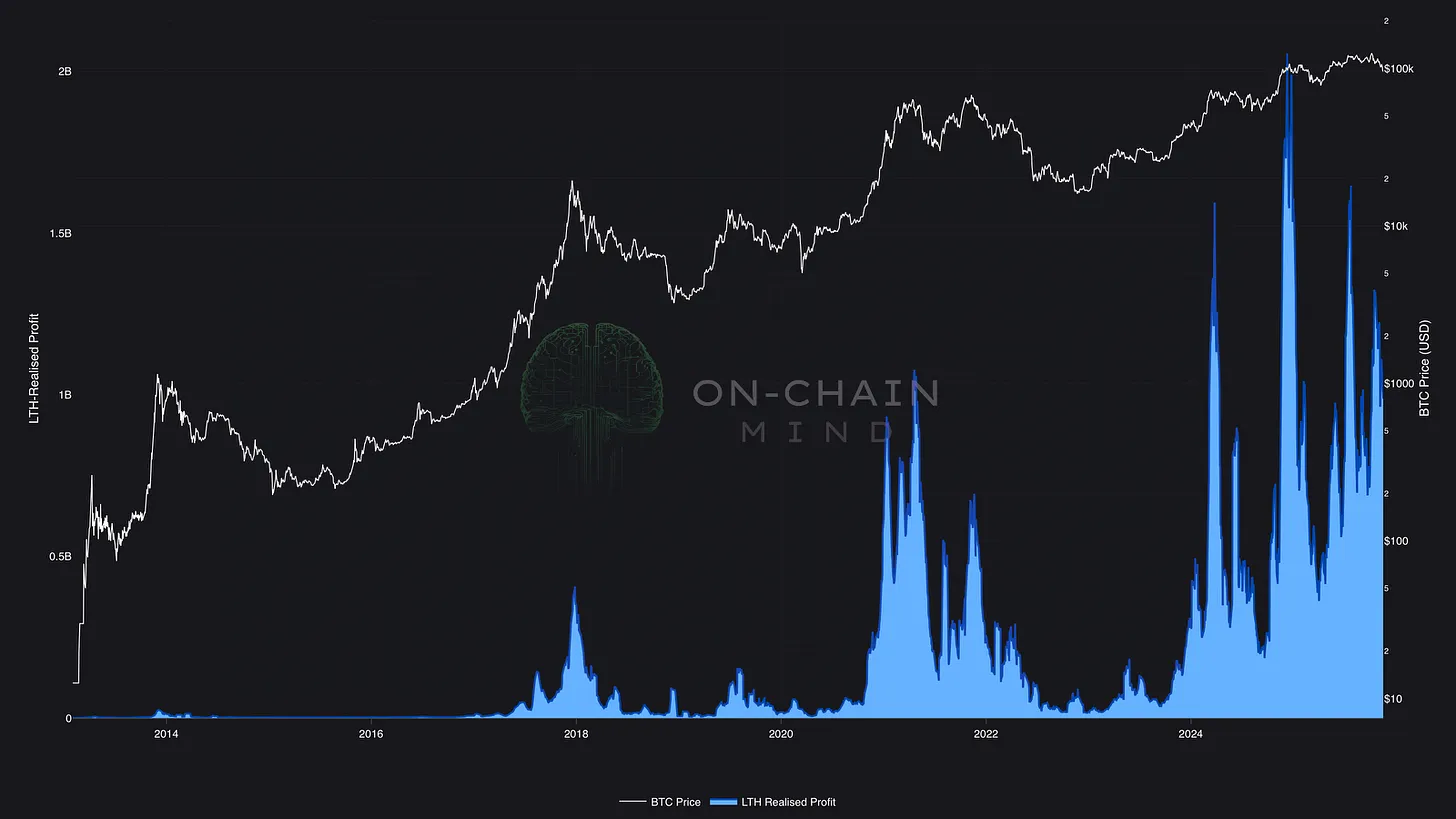
We saw the classic LTH distribution into strength earlier this year. But now, we’re also seeing increased selling into weakness. A unique and worrying dynamic.
Market Structure Gaps
The local price action is pretty weak and the key structural supports are crumbling.
The $93K region, once a strong shelf, is now flipping to resistance. And losing $90Kcould trigger a vacuum-like decline, as there is a structural void with minimal traded volume between $80K-$90K.
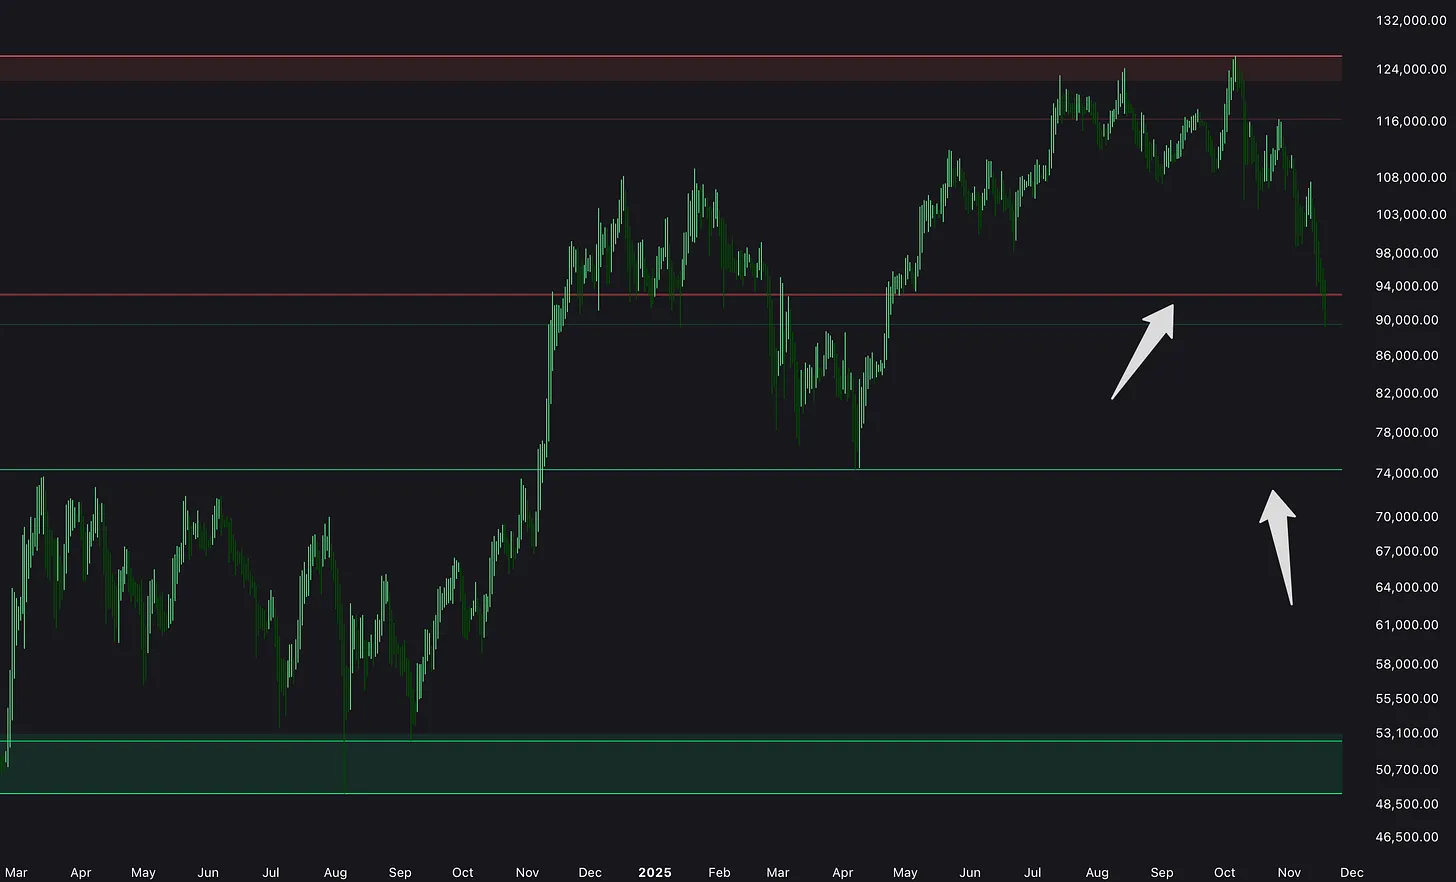
The next high-probability support band sits around $70K–$75K, which historically has attracted strong volume and buyer interest.
Volume Profile Insights
Looking at the recent volume profile, the mid-$90K region has been actively traded, indicating recent agreement on value. Normally, this could stabilise as a sideways accumulation range. However, should $90K be decisively broken, the market will likely accelerate into the next major support zone near the top of the 2024 consolidation range — approximately $72K.
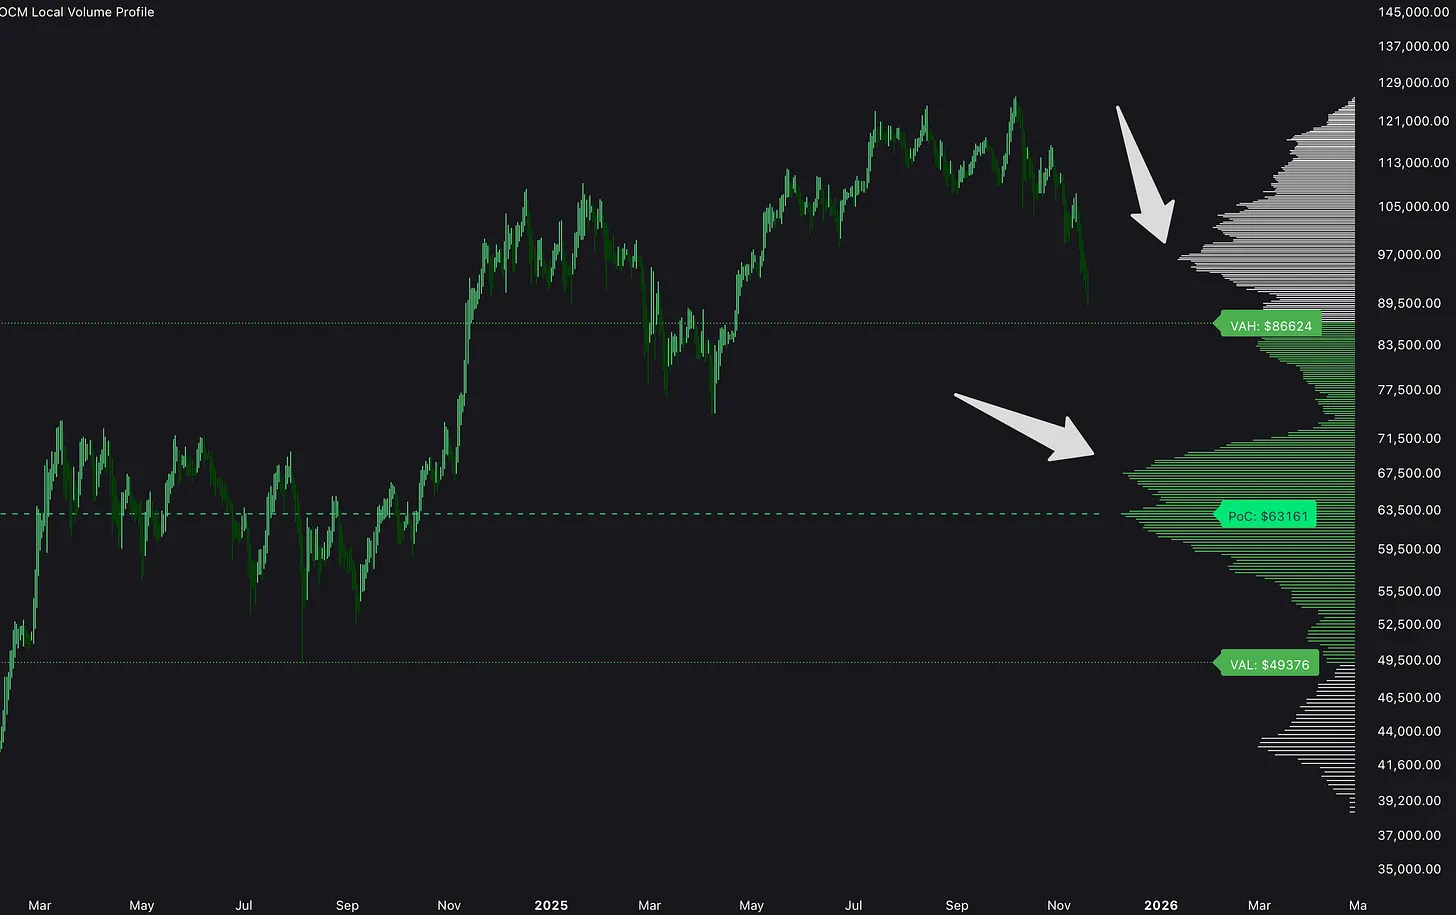
Markets tend to find equilibrium where historical trading volume is high. The low activity in the $80K–$90K band creates the risk of a rapid, almost “vacuum-like” decline.
Mapping Out A Bear
Every Bitcoin cycle has delivered at least a ~70–85% retracement from peak to trough. But (and this is crucial) those monstrous drawdowns always followed a vertical blow-off top fuelled by bouts of extreme greed.
We never got that this cycle. No $200k+ parabolic leg, no 24/7 TV coverage, no taxi drivers telling me it’s the right time to get in. The top at ~$126k (if indeed it was the top) formed after a slow, grinding, institution-heavy rally.
Absence of euphoria at the high usually means absence of despair at the low.
Z-Score Probability Waves
Statistical models reflect this reality beautifully. The Z-Score Probability Waves – which measures deviation from the long-term statistical mean – has only just dipped into negative territory for the first time this cycle.
Every prior bear market bottomed between –1 and –2 standard deviations (currently ~$60k–$78k). That would represent roughly a 50–55 % drawdown – painful, yes, but one of the mildest bear markets in Bitcoin’s history.
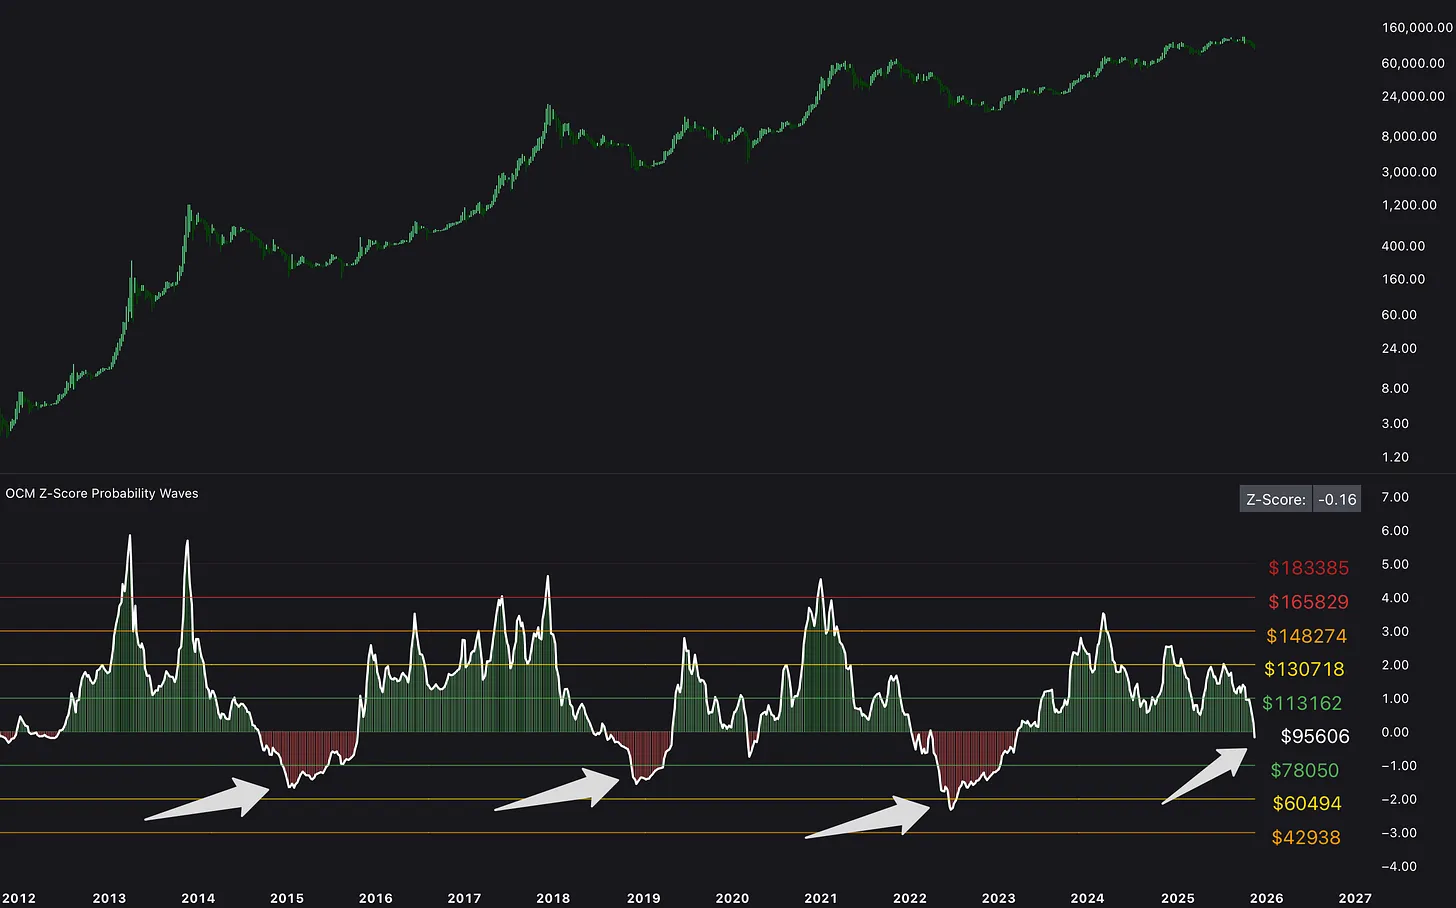
For the first time this cycle, Bitcoin has dipped into negative Z-Score territory on the macro overlay. Previous bear markets bottomed between −1 and −2 standard deviations, which currently sit around $60K–$78K.
STH Cost Bands
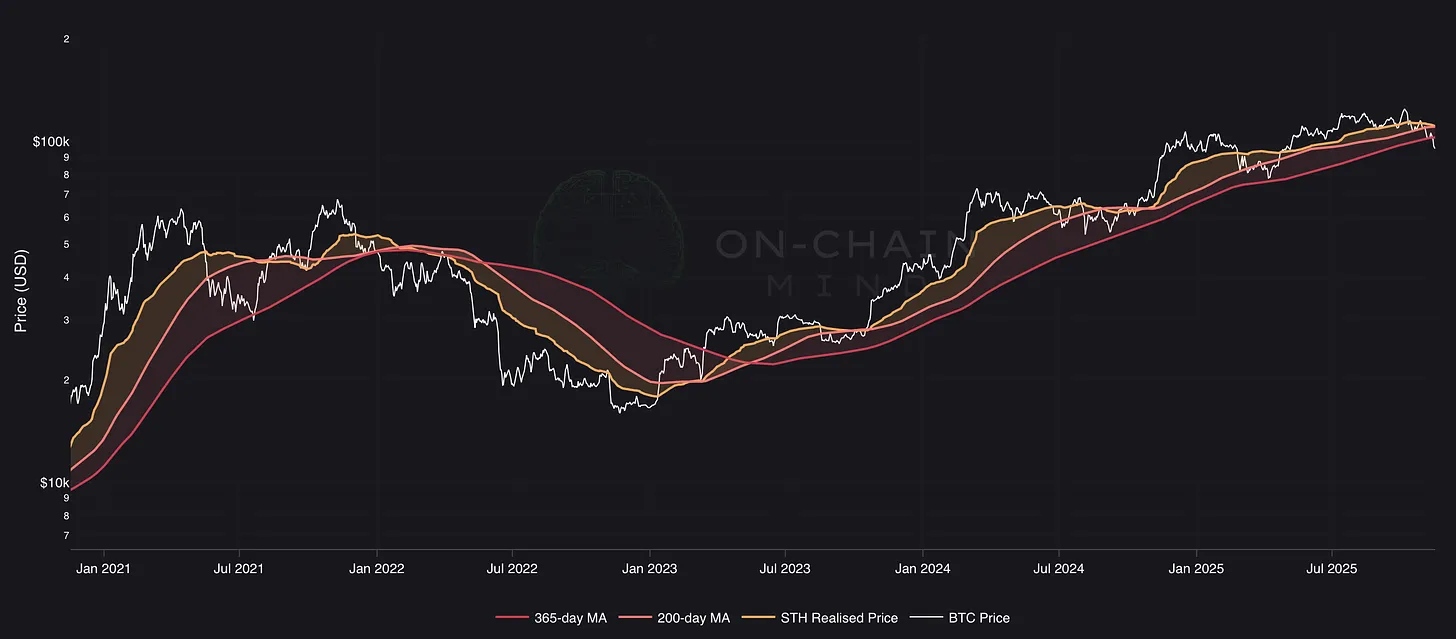
I rely heavily on the Short-Term Holder (STH) cost-basis framework because it’s one of the most reliable dynamic trading range models in Bitcoin. Derived from the STH Realised Price — which represents the average acquisition cost of coins moved over the past 5–6 months — this framework captures the behaviour of the most reactive and emotionally-driven cohort in the market. And price has a remarkable tendency to respect their collective cost basis.
When Bitcoin trades above the STH Realised Price (white line in the chart below), the bulls hold the upper hand. When it drops below and remains there, the default bias shifts bearish until proven otherwise, and our trading strategies should reflect this.
Currently, price is oscillating within the lower two cost bands, historically the danger zone reserved for bear markets. In these ranges, STHs attempting to exit at break-even often create semi-permanent resistance at the white line.
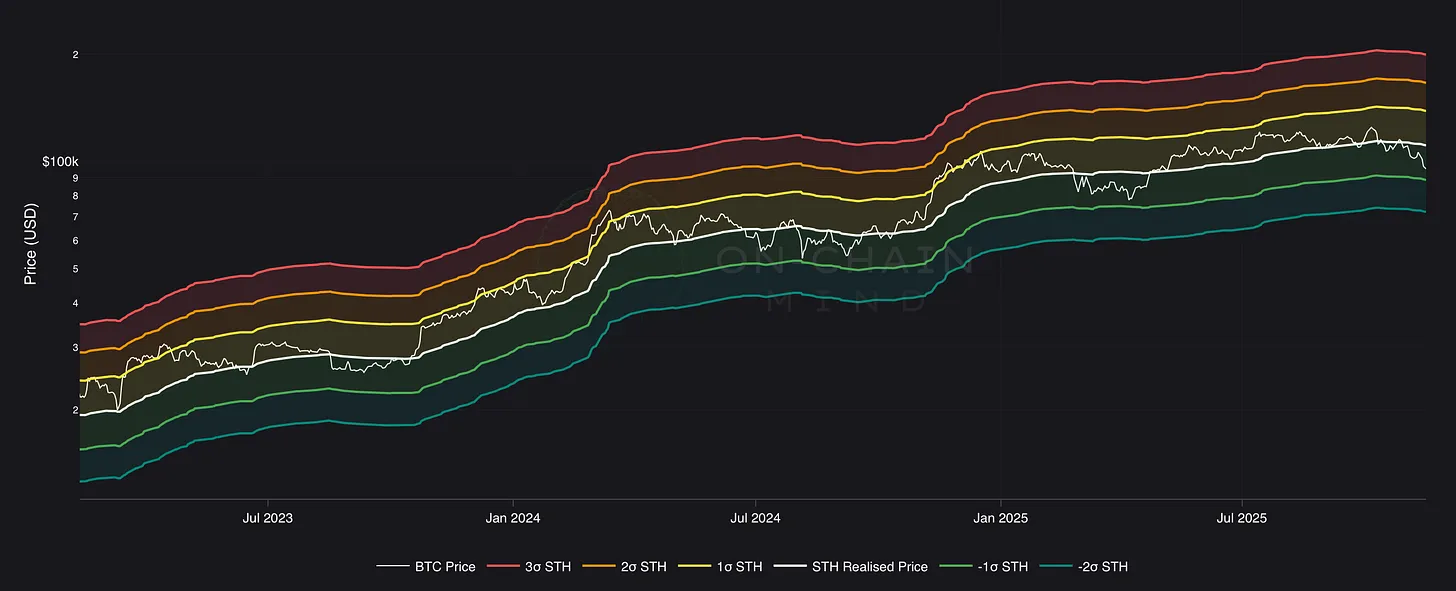
The current lower band spans roughly $72K–$88K, defining the market’s structural sandbox. Until price proves it can convincingly escape this zone, this is where the action (and the risk) remains concentrated.
STH Drawdown
If I could only show you one indicator for the rest of this cycle, it would be the STH Drawdown metric.
It simply plots how underwater recent buyers are relative to their average cost basis. When the line plunges deep into red territory (roughly –60 %), that has marked literally every major cycle bottom since 2013 with zero lag and zero false positives.
We are nowhere near those levels yet. That tells us either:
The drawdown still has a long way to run, or
This is merely a deep bull-market correction and capitulation never actually arrives.
Both remain possible. The chart doesn’t care about your narrative; it only reports maximum realised pain.

STH Drawdown
My Personal Playbook in This Mess
Look, I’m not here to sell you a story. The technical damage is real, the LTH distribution is real, and the triple moving-average breakdown is real. Pretending otherwise is delusional.
But the macro tailwinds are equally real: global M2 liquidity is turning higher again, U.S. fiscal policy and the government shutdown situation look to be improving, and nation-state and corporate balance-sheet adoption continues unabated.
If someone told me in 2023 that Bitcoin would top without a proper blow-off top and then deliver only a ~50% bear market before resuming the secular uptrend, I would have called it the best-case scenario disguised as a nightmare.
Here’s the part where I get off the fence and tell you what I am actually doing.
My personal strategy: never fully exit, even when bearish signals appear. I have been through enough cycles to know that certainty is a dangerous illusion. Even when all the metrics converged to signal a top in 2021, I still kept a rather large core stack that I refused to touch. Turned out I was right about the upcoming bear, but being 100% in cash for 2 years would have been emotional suicide.
Today, I am running the same playbook, just at higher prices:
Core long-term holdings remain untouched:
60-70% of my stash I will not sell. These are the coins I will hopefully hand to my kids.
I am not selling the rest at these levels. If this was the peak, no one saw it coming. I will not panic sell at depressed levels.
Trading capital is split:
Partly buying-the-dip if this entire bear thesis is wrong (see my previous article).
Partly saving in cash waiting to deploy aggressively at a potential deep bear market bottom on the STH Drawdown chart and Z-Score Probability Waves.
When the Dust Settles
The market doesn’t reward the guy who calls the exact top or bottom. It rewards the guy who stays solvent, adaptable, and ready to pivot the moment the data changes.
If Bitcoin does indeed bleed out to $60k–$70k without ever having given us the euphoric blow-off top, historians will look back at this cycle as the moment the asset class finally matured. Retail mania replaced by institutional grinding. 80% drawdowns replaced by 50% ones. Fear replacing greed as the dominant emotion at cycle peaks.
And paradoxically, that maturation could be the most bullish long-term signal of all.
So keep your eyes on two charts above all else: the STH Drawdown metric for capitulation, and the Z-Score Probability Waves for statistical extremity. When both flash deep red simultaneously, the generational buying opportunity will be staring us in the face — whether that happens in 2025, 2026, or beyond.
Until then, respect the breakdown, manage your risk like your net worth depends on it (because it does), and never, ever marry a single narrative.
I’ll catch you in the next one.
Cheers,
