
Why Long-Term Holders Hold the Keys to Every Big Move
Beneath the daily volatility, there’s a group of investors that have been pulling the strings since Bitcoin’s inception — the long-term holders. These are the wallets that barely move, the coins that sit dormant for years, and the hands that dictate when supply tightens or floods the market.
Understanding what they’re doing isn’t just interesting — it’s arguably the single most reliable way to anticipate Bitcoin’s next major move.
In this article, we’ll break down the role of long-term holders, explore the key on-chain metrics that reveal their influence, and highlight why tracking their movements could be your most reliable signal in today’s market.
Let’s get into it.
Dominance of Supply: Long-term holders control roughly 75% of all Bitcoin, making them the market’s true liquidity anchors.
On-Chain Signals: LTH metrics like the 30-Day Net Position Change, HODL Momentum, and Coin Flow reveal clear accumulation and distribution cycles.
Market Phases: Current readings suggest controlled profit-taking, not speculative euphoria — meaning the market is coiling rather than peaking.
Strategy Alignment: Aligning your strategies with LTH behaviour can improve risk-adjusted entry points, particularly for DCA-based investments.
The Most Dominant Player
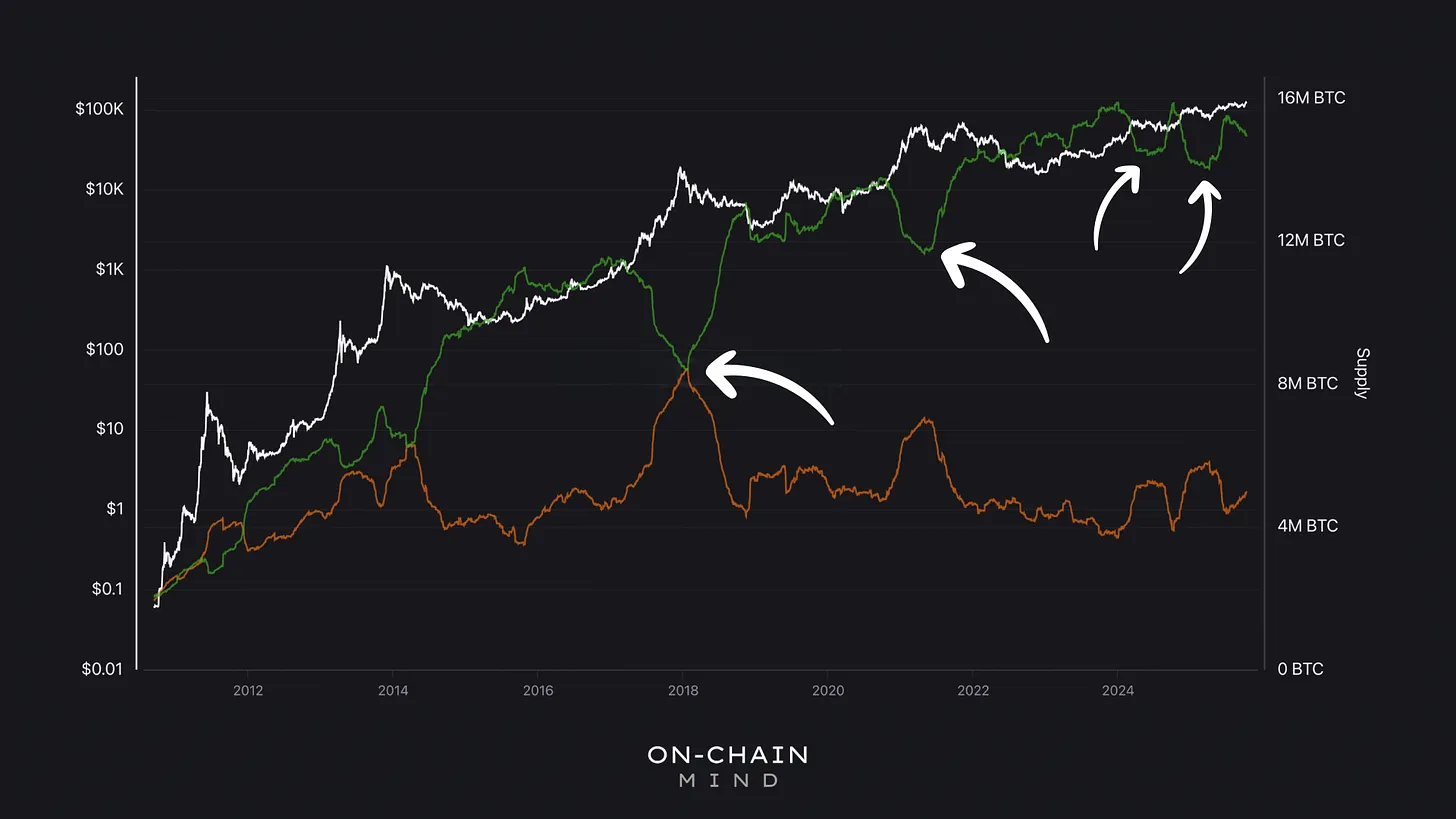
In the Bitcoin ecosystem, long-term holders (LTHs) are the custodians of stability. Out of almost 20 million Bitcoin in existence, about 15 million sit in wallets that haven’t moved in over 155 days. This threshold isn’t arbitrary — it’s grounded in statistical analysis showing that coins dormant for this period are far less likely to be spent or traded in the near future.
The remaining 5 million coins reside in short-term holders’ hands. These participants are reactive, sensitive to price swings, and more likely to sell during periods of volatility. In contrast, long-term holders act as the market’s anchor: their decisions influence supply availability, create price floors, and indirectly guide market sentiment.
LTHs are often dubbed the “smart money”, and the moniker has merit. Historically, they:
Accumulate aggressively during bear markets, absorbing excess supply.
Distribute holdings during euphoric bull runs, effectively defining cycle tops.
Operate counter to the crowd, making their behaviour a reliable contrarian indicator.
Looking at past cycles illustrates this clearly. During the 2017 peak, LTH distribution pushed the market to a 50-50 split with short-term holders. By 2021, a similar, albeit slightly smaller, pattern emerged: LTH supply dipped to 61% as new participants absorbed redistributed coins.
In the current cycle, two significant distribution events have already occurred: first during the post-ETF rally approaching $70,000, and second around the initial surge to $100,000. Each event released over a million coins from long-term holders to short-term participants — substantial rotations that temporarily increase market liquidity.
Yet, with LTHs still commanding 75% of supply, we’re far from the parity seen in prior tops. This suggests the cycle may have legs — prices need to climb further to lure more distribution from this cohort.
Two notable distribution waves have occurred this cycle: one post-ETF approval, pushing Bitcoin near $70,000, and another during the surge to $100,000. Each event saw over a million coins migrate from LTHs to STHs, representing a significant supply rotation.
Measuring LTH Behaviour
Understanding long-term holder activity requires a mix of metrics, each providing a different lens into accumulation and distribution dynamics.
LTH 30-Day Net Position Change
This metric aggregates the daily change in LTH balances over a rolling 30-day window:
Positive values indicate net accumulation, suggesting LTHs are absorbing supply.
Negative values signal net distribution, meaning coins are being released into circulation.
Historically, this indicator aligns closely with market cycles. During euphoric rallies, LTHs distribute at an increasing rate — previously reaching up to 25,000 BTC per day at major peaks. Currently, distribution sits at roughly 6,000 BTC per day. This controlled release reflects modest profit-taking rather than full-scale euphoria, explaining why price action appears “suppressed” despite massive institutional inflows from ETFs and treasury buyers.
It’s also worth noting that not all distribution represents a complete exit from Bitcoin. Some LTHs may be migrating holdings from self-custody into institutional vehicles like ETFs for security, convenience, or tax efficiency. Even small lifestyle-related withdrawals — the “lifestyle chip” effect — can introduce coins back into circulation.
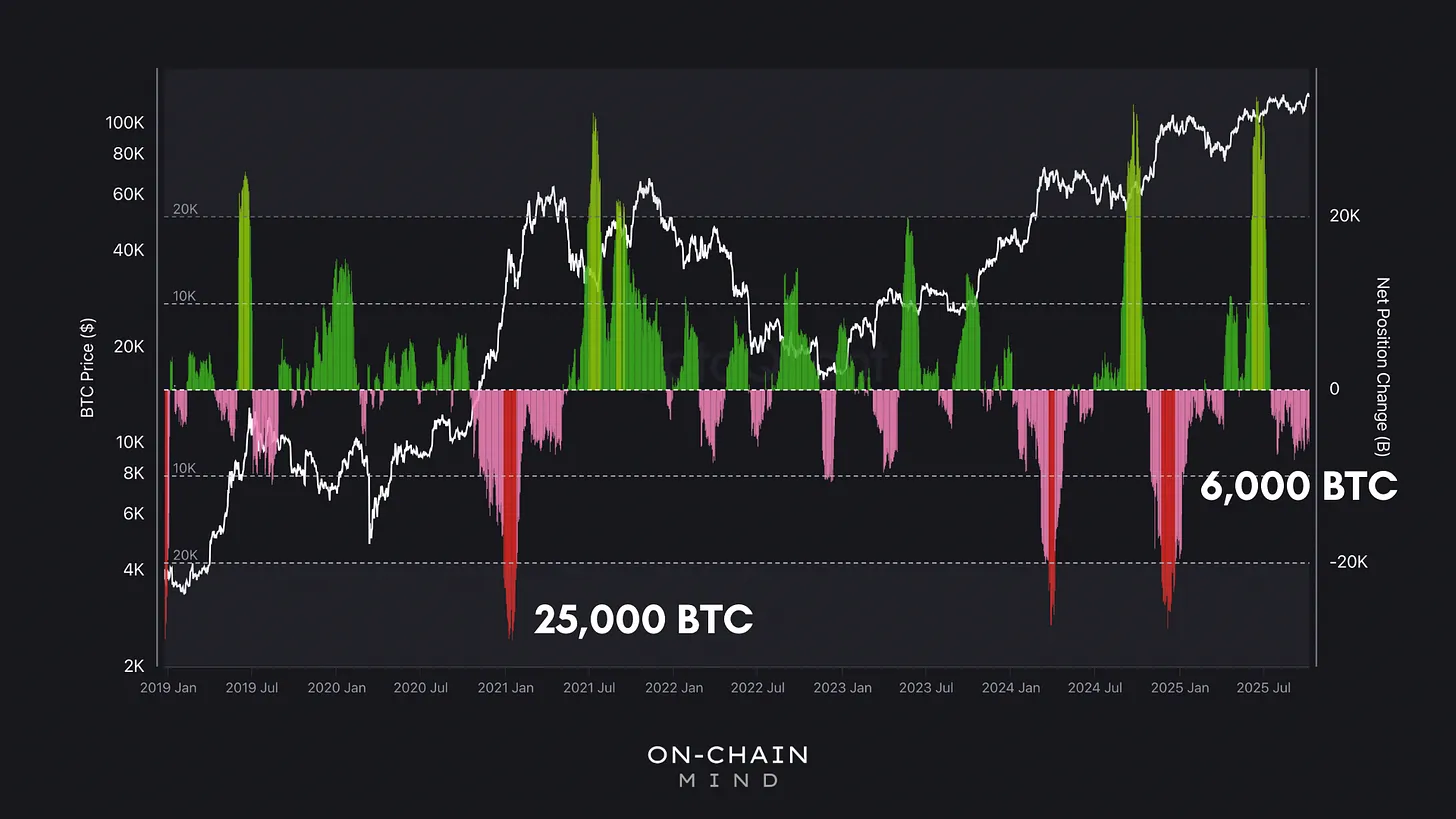
In bull markets, LTHs ramp up distribution, peaking at extremes like 25,000 BTC/day in 2021, capping rallies and sparking bear phases by flooding supply. Currently, at 6,000 BTC/day, modest profit-taking signals restraint, far from historical tops.
HODL Momentum
HODL Momentum measures the ratio of short-term holder activity relative to long-term stability, effectively tracking the velocity of coins moving back into circulation.
Readings above 80 historically mark both local and macro peaks.
Currently, HODL Momentum sits around 68 — elevated, but not extreme.
The current choppy structure suggests a market in transition: either gradually cooling after a distribution phase or coiling before another leg higher. Crucially, this metric provides early signals of speculative intensity before price extremes manifest, offering us a strategic edge in timing accumulation or for trimming exposure.
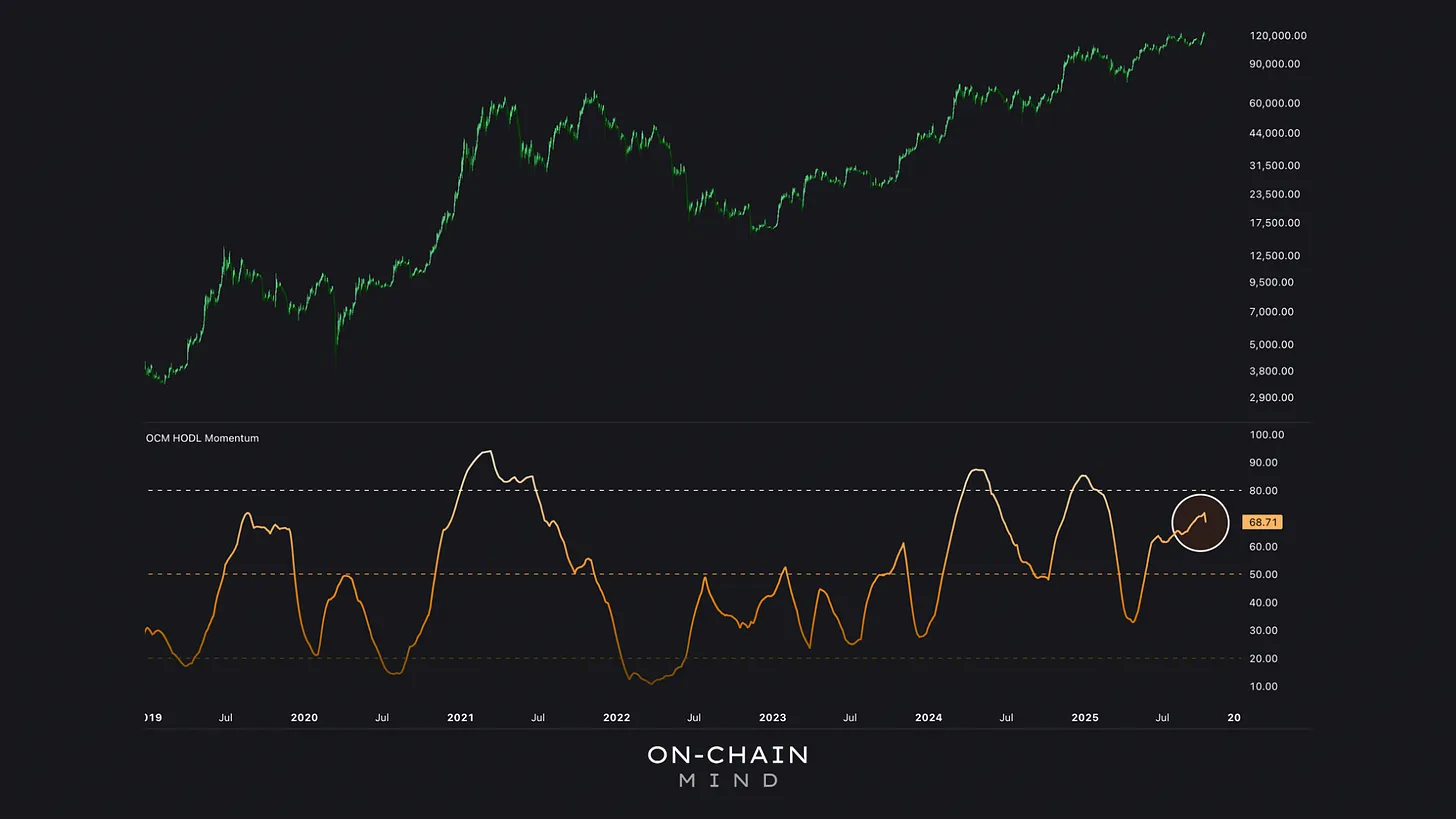
Readings above 80 signals euphoric peaks, marking local and cycle tops. At 68 now, we’re elevated but not overheated, with choppy patterns since June hinting at a transitional phase.
LTH Coin Flow Indicator
This is one of the most actionable tools for continuous momentum analysis. The LTH Coin Flow indicator tracks changes in the portion of coins dormant for over a year, effectively measuring absorption or distribution by the longest-term participants.
Positive (green) readings indicate net distribution — coins re-entering liquid markets.
Negative (red) readings signal net accumulation — LTHs soaking up supply.
Smoothed with a 50-day EMA and scaled into an oscillator, this indicator serves as a momentum-based accumulation/distribution tool, aligning well with traditional volume analysis. For dollar-cost averaging (DCA) strategies, it’s particularly useful:
Red zones suggest heavier DCA allocations, buying alongside LTH accumulation.
Green zones indicate caution or reduced allocation, as distribution may signal short-term tops.
I like to use this to dynamically adjust contributions. Heavier allocations during accumulation periods (deep red zones) and lighter or paused contributions during distribution phases (green zones) to improve risk-adjusted entries.
At present, the indicator shows slight net distribution — modest profit-taking rather than a market peak, supporting a patient, measured approach rather than aggressive accumulation.

Green flips advise caution: slow DCA or pause amid distribution. Currently, a mildly positive reading implies modest profit-taking, not euphoria. This flat profile calls for measured patience, perhaps lightening buys until signals shift.
Reflecting on the Data
When combined, these metrics reveal a nuanced picture of Bitcoin’s current cycle:
30D Net Position Change shows steady but controlled distribution.
HODL Momentum is elevated but not at euphoric extremes.
LTH Coin Flow indicates light distribution rather than aggressive selling.
This suggests the market is neither locally cheap nor overheated — a transitional phase where long-term holders are quietly adjusting, allowing tension to build without triggering panic.
From my perspective, the 75% long-term holder supply level we see today doesn’t indicate a cycle top. There’s still room for LTH dominance to fall, suggesting that more upside could emerge before we see the kind of mass distribution that defines euphoric tops.
Controlled profit-taking is healthy — it absorbs inflows without overheating the market. Modest LTH distribution, combined with stable momentum metrics, indicates the market is coiling for a potential next leg rather than rolling over.
For me, I’m slowing down my structured accumulation and making this a time for observation, not reaction.
I’ll catch you in the next one.
Cheers,
