
An On-Chain Rooted Assessment of the Next Cycle Peak
Let’s face it: most Bitcoin price forecasts resemble horoscopes more than rigorous analysis. Bold predictions and “moonboy” targets might be entertaining, but in reality, they’re little more than guesswork.
They often overlook the fundamental mechanics of Bitcoin’s network: the transfers, long-term holder behaviour, and valuation dynamics that actually drive cycles.
Today, we’re taking a different approach: a deep dive into 6 on-chain metrics that have consistently signalled all previous cycle tops.
Let’s get into it.
The On-Chain Crystal Ball: 6 battle-tested indicators, from Factored Terminal Price to Delta Top, offer historical accuracy in pinpointing Bitcoin’s euphoric peaks.
Convergence is Key: These metrics diverge in choppy markets but align during parabolic rallies, providing a dynamic zone for potential tops rather than a fixed number.
The Power of Averages: A composite line blending all 6, adjusted for cycle decay, currently hovers around $180,000, serving as a pragmatic guide for exit planning.
Context Over Numbers: True tops emerge not just from price levels but from market behaviour, long-term holder movements, and late-cycle mania.
Why Most Price Predictions Fail
Before diving into the metrics, it’s important to acknowledge why conventional predictions rarely hold up. Charts with vague trend lines are inherently subjective and mostly lack context. They don’t account for underlying network activity, long-term holder behaviour, or cumulative value flows. Essentially, they rely on speculation rather than observable data.
To truly anticipate a Bitcoin top, we need metrics rooted in network fundamentals — data that reflects real-world usage, accumulation, and distribution. That’s where on-chain analysis becomes invaluable.
The 6 Chosen Metrics
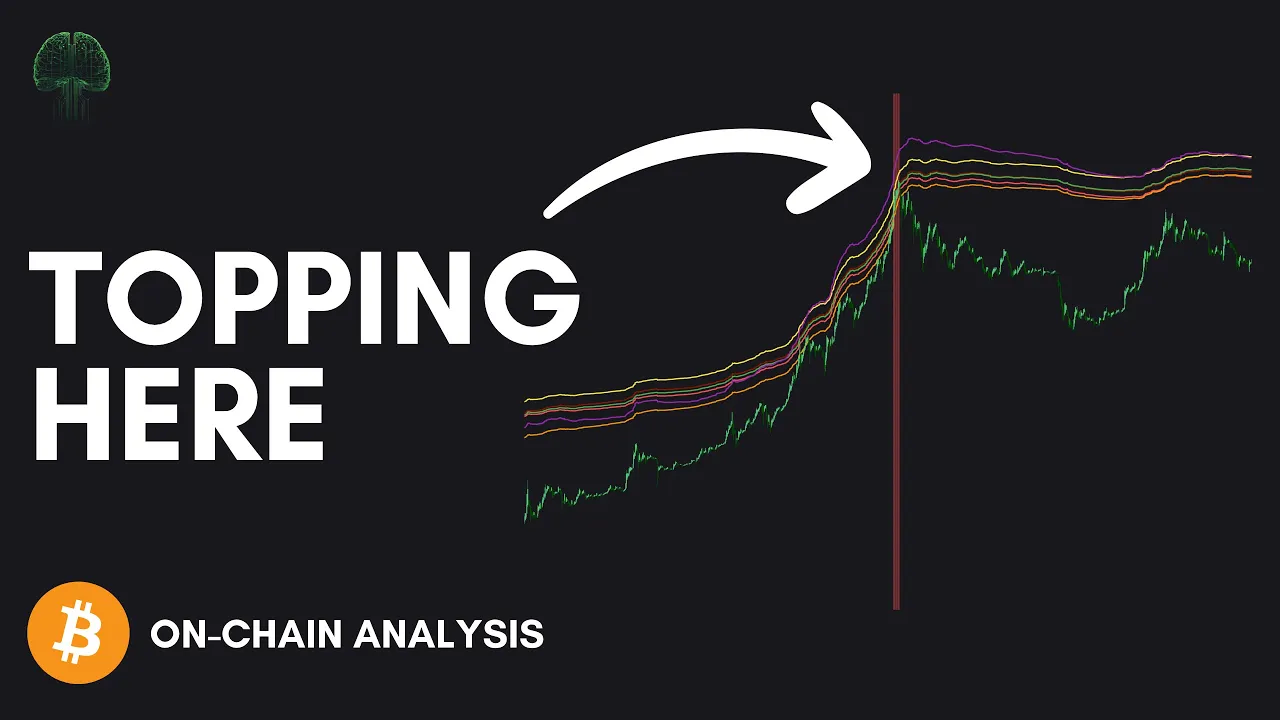
On the chart below, 6 coloured lines each represent a distinct on-chain or market-derived estimate of potential cycle tops.
Here’s a breakdown of each metric and why it is significant:
1. Factored Terminal Price (Light Red)
The Factored Terminal Price is a classic in on-chain analysis. It represents a theoretical ceiling for Bitcoin based on cumulative network value transfer and the age of coins. Historically, reaching this level signals a market that is massively overheated. It provides a mature upper boundary, giving a benchmark against which to measure late-cycle price action.
2. Coin Value Elevation (Dark Red)
The CVE is a custom metric tracking long-term price ceilings by incorporating Bitcoin’s age and the movement of long-term holdings. Essentially, it measures the full extent of speculative euphoria, adapting dynamically to longer cycles. It often provides an early warning of late-stage FOMO-driven mania.
3. 5x Balanced Price (Yellow)
This metric combines the realised price (the average investor cost basis) with the terminal price, blending historical network valuation with current sentiment. Multiplying by 5 generates a speculative top projection, capturing both network fundamentals and short-term market optimism.
4. 4x Adjusted Realised Price (Green)
A refined take on the standard realised price multiple, this metric factors in the Spent Output Profit Ratio (SOPR) and transaction volume. By multiplying the corrected realised price by 4, it acts as a network-wide heat gauge, highlighting when a significant portion of coins are being sold at high profits.
5. 4.5x Coin Value Days Destroyed (Orange)
This metric focuses on the liquidation of long-held coins. When dormant coins are finally moved, the metric spikes. Scaling it by 4.5 aligns well with historical tops, particularly when long-term holders distribute into euphoric rallies.
6. Delta Top (Purple)
Calculated as 7 times the difference between the realised price and a time-adjusted average market cap, the Delta Top often coincides with psychological blowoff points. These are irrational surges where Bitcoin is pushed far beyond perceived fair value, signalling the final, frenzied stage of a bull market.

Projections span $168,000 to $267,000, a broad range due to our current consolidation phase. This divergence is normal in mid-cycle lulls; with the metrics converging during late-stage euphoria.
Today’s Signals
Currently, these 6 metrics suggest potential price tops ranging from $168,000 (CVE) to $267,000 (Delta Top). The wide spread is normal during the rangebound or choppy market phase like we’re experiencing now.
But divergence doesn’t imply inaccuracy. It reflects that Bitcoin hasn’t yet entered its euphoric parabolic phase. Historical analysis shows that these metrics converge tightly just before a cycle top, as seen in 2017:

The 6 metrics have converged together to meet the price at each of the previous cycle peaks.
The Value of a Composite Metric
Relying on a single indicator can be misleading. To manage conflicting signals, I created a merged average line, which is a composite of all 6 metrics, incorporating a decay rate factor to account for diminishing returns across cycles.
This line, currently around $180,000, has historically captured cycle peaks with impressive reliability. Check it out:

In 2021, Bitcoin hugged the average near $64,000. 2017 saw confluence at $20,000 amid euphoria. Even 2013-2014’s volatile run tagged lines before its corrections. These aren’t coincidences; they reflect recurring investor behaviour.
Why Metrics Alone Aren’t Enough
It’s crucial to remember that hitting a metric target isn’t synonymous with a top. The context, such as market behaviour, the pace of price moves, and other classic signs of late-cycle euphoria, is equally important. Divergence is normal early-to-mid cycle. Convergence occurs rapidly once Bitcoin enters the final vertical, euphoric phase.
When price begins hugging the average line during a rapid upward move, my confidence in a macro top increases.
Ultimately, these models don’t deliver a precise sell number, they provide a zone of confluence, allowing us to act based on evidence rather than emotion.
Navigating The Rest of This Cycle
The critical takeaway from this analysis is that top predictions are less about guessing a number and more about recognising patterns and behaviours that have consistently played out in prior cycles. By combining multiple on-chain and market metrics, we gain a clearer picture of the likely peak zone rather than chasing a single target.
It’s important to note: this entire analysis hinges on the presence of a late-cycle euphoria stage. And while every previous Bitcoin cycle has experienced it, there’s no guarantee it will repeat this time around. That said, given the consistent, repeating patterns of market behaviour, and the unchanging psychology of the human investor, my base case is that we are likely to witness this phase once again.
In these late-cycle phases, even OG Bitcoiners can get swept up in euphoric rallies, which is why planning ahead using data-driven metrics is essential. While Bitcoin may be maturing and tops could soften compared with earlier cycles, even with the decays factors I’ve applied, the evidence suggests we’re not at a classical cycle top just yet.
Depending on how the price action unfolds, the composite average could climb well above $200,000 if this consolidation persists for longer, or dip lower if a macro-driven rally pushes momentum faster than expected.
My plan this cycle is to remain patient, try my best to avoid getting swept up in the euphoria, and attempt to approach the top intelligently rather than reactively. Observing the data, and the behaviour behind it, will be far more valuable than guessing raw numbers.
Best of luck to you.
I’ll catch you in the next one.
Cheers,
