
200-Day MA Heatmap
onchainmind.io
© 2025 On-Chain Mind. All rights reserved.
Description:
Premium Indicator
Premium Indicator
Indicator Overview
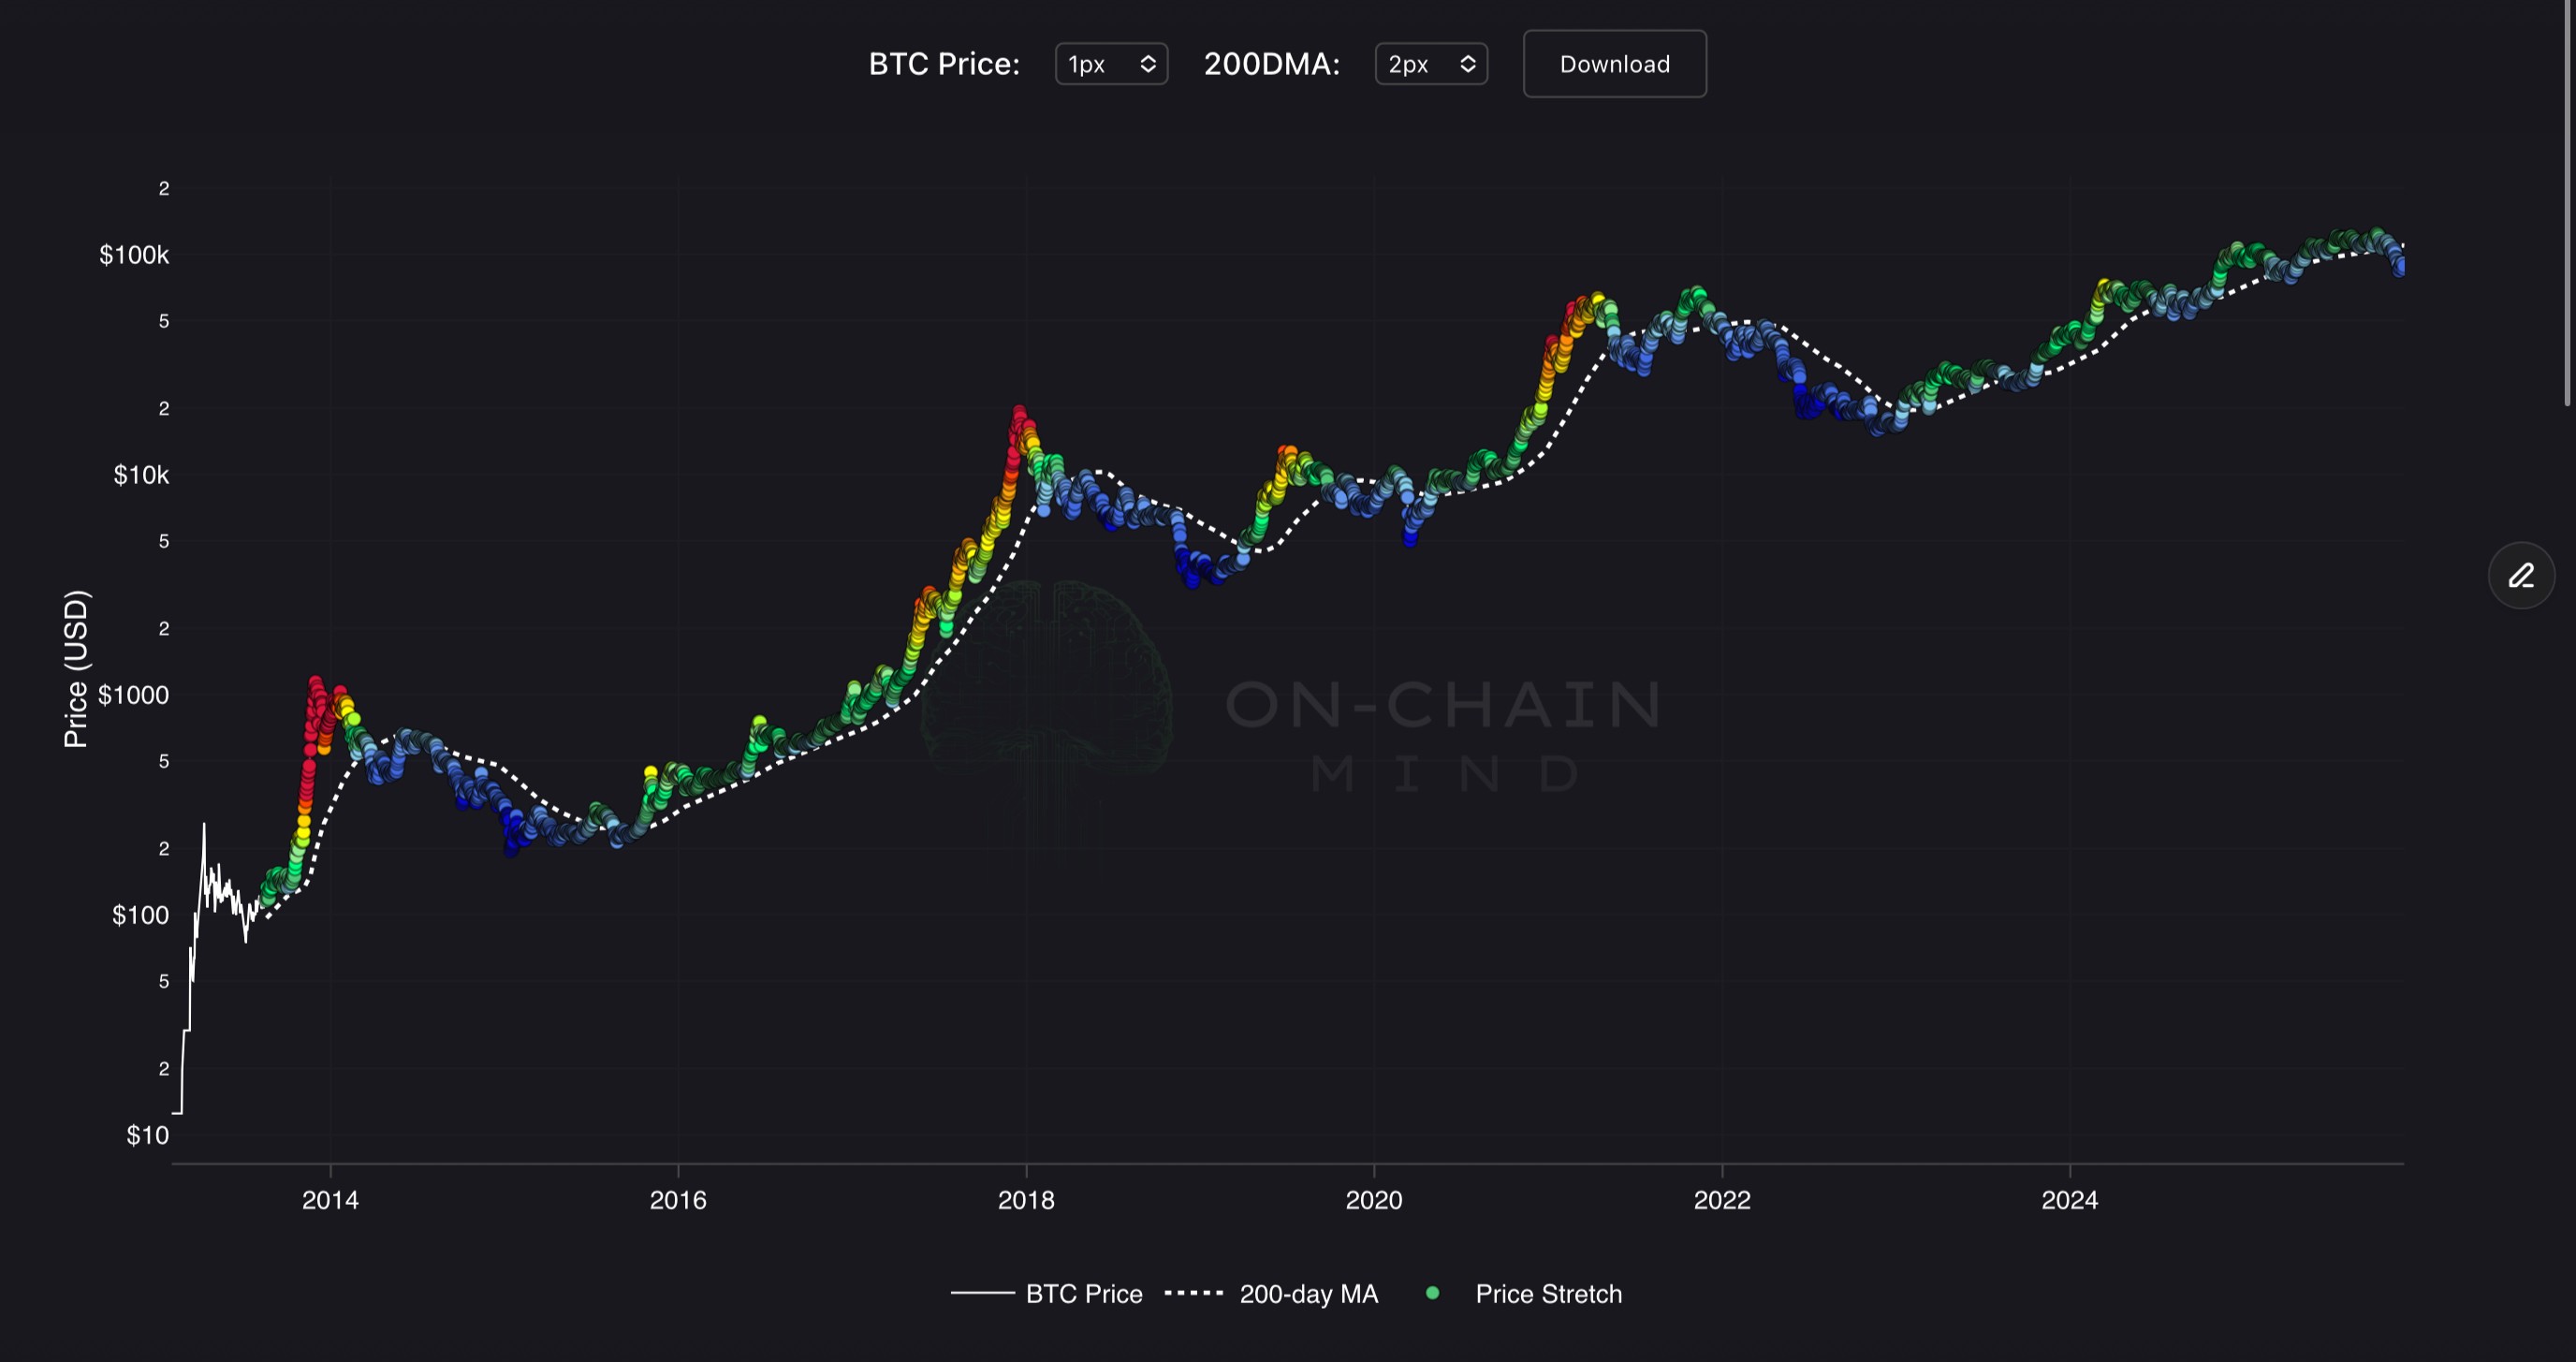
The 200D MA Heatmap indicator measures Bitcoin’s price deviation from its 200-day moving average (MA), expressed as a percentage. The 200-day MA is a widely used benchmark for assessing long-term trends in all of financial markets, with deviations indicating whether Bitcoin is overbought or oversold relative to its historical trend. Weekly heatmap dots (coloured from blue to red) visualise these deviations, offering a clear snapshot of market positioning. This indicator is essential for investors seeking to gauge Bitcoin’s trend strength and identify potential reversal points within its cyclical market behaviour.
How To Use
Historically, large positive deviations often signal overbought conditions, coinciding with bull market peaks. Negative deviations typically indicate undervaluation, often seen during bear market bottoms. Traders can use red/orange dots to consider profit-taking or caution, while green/blue dots may suggest buying opportunities. The 200D MA line acts as a trend anchor; prices above it confirm bullish trends, while prices below suggest bearish conditions.