
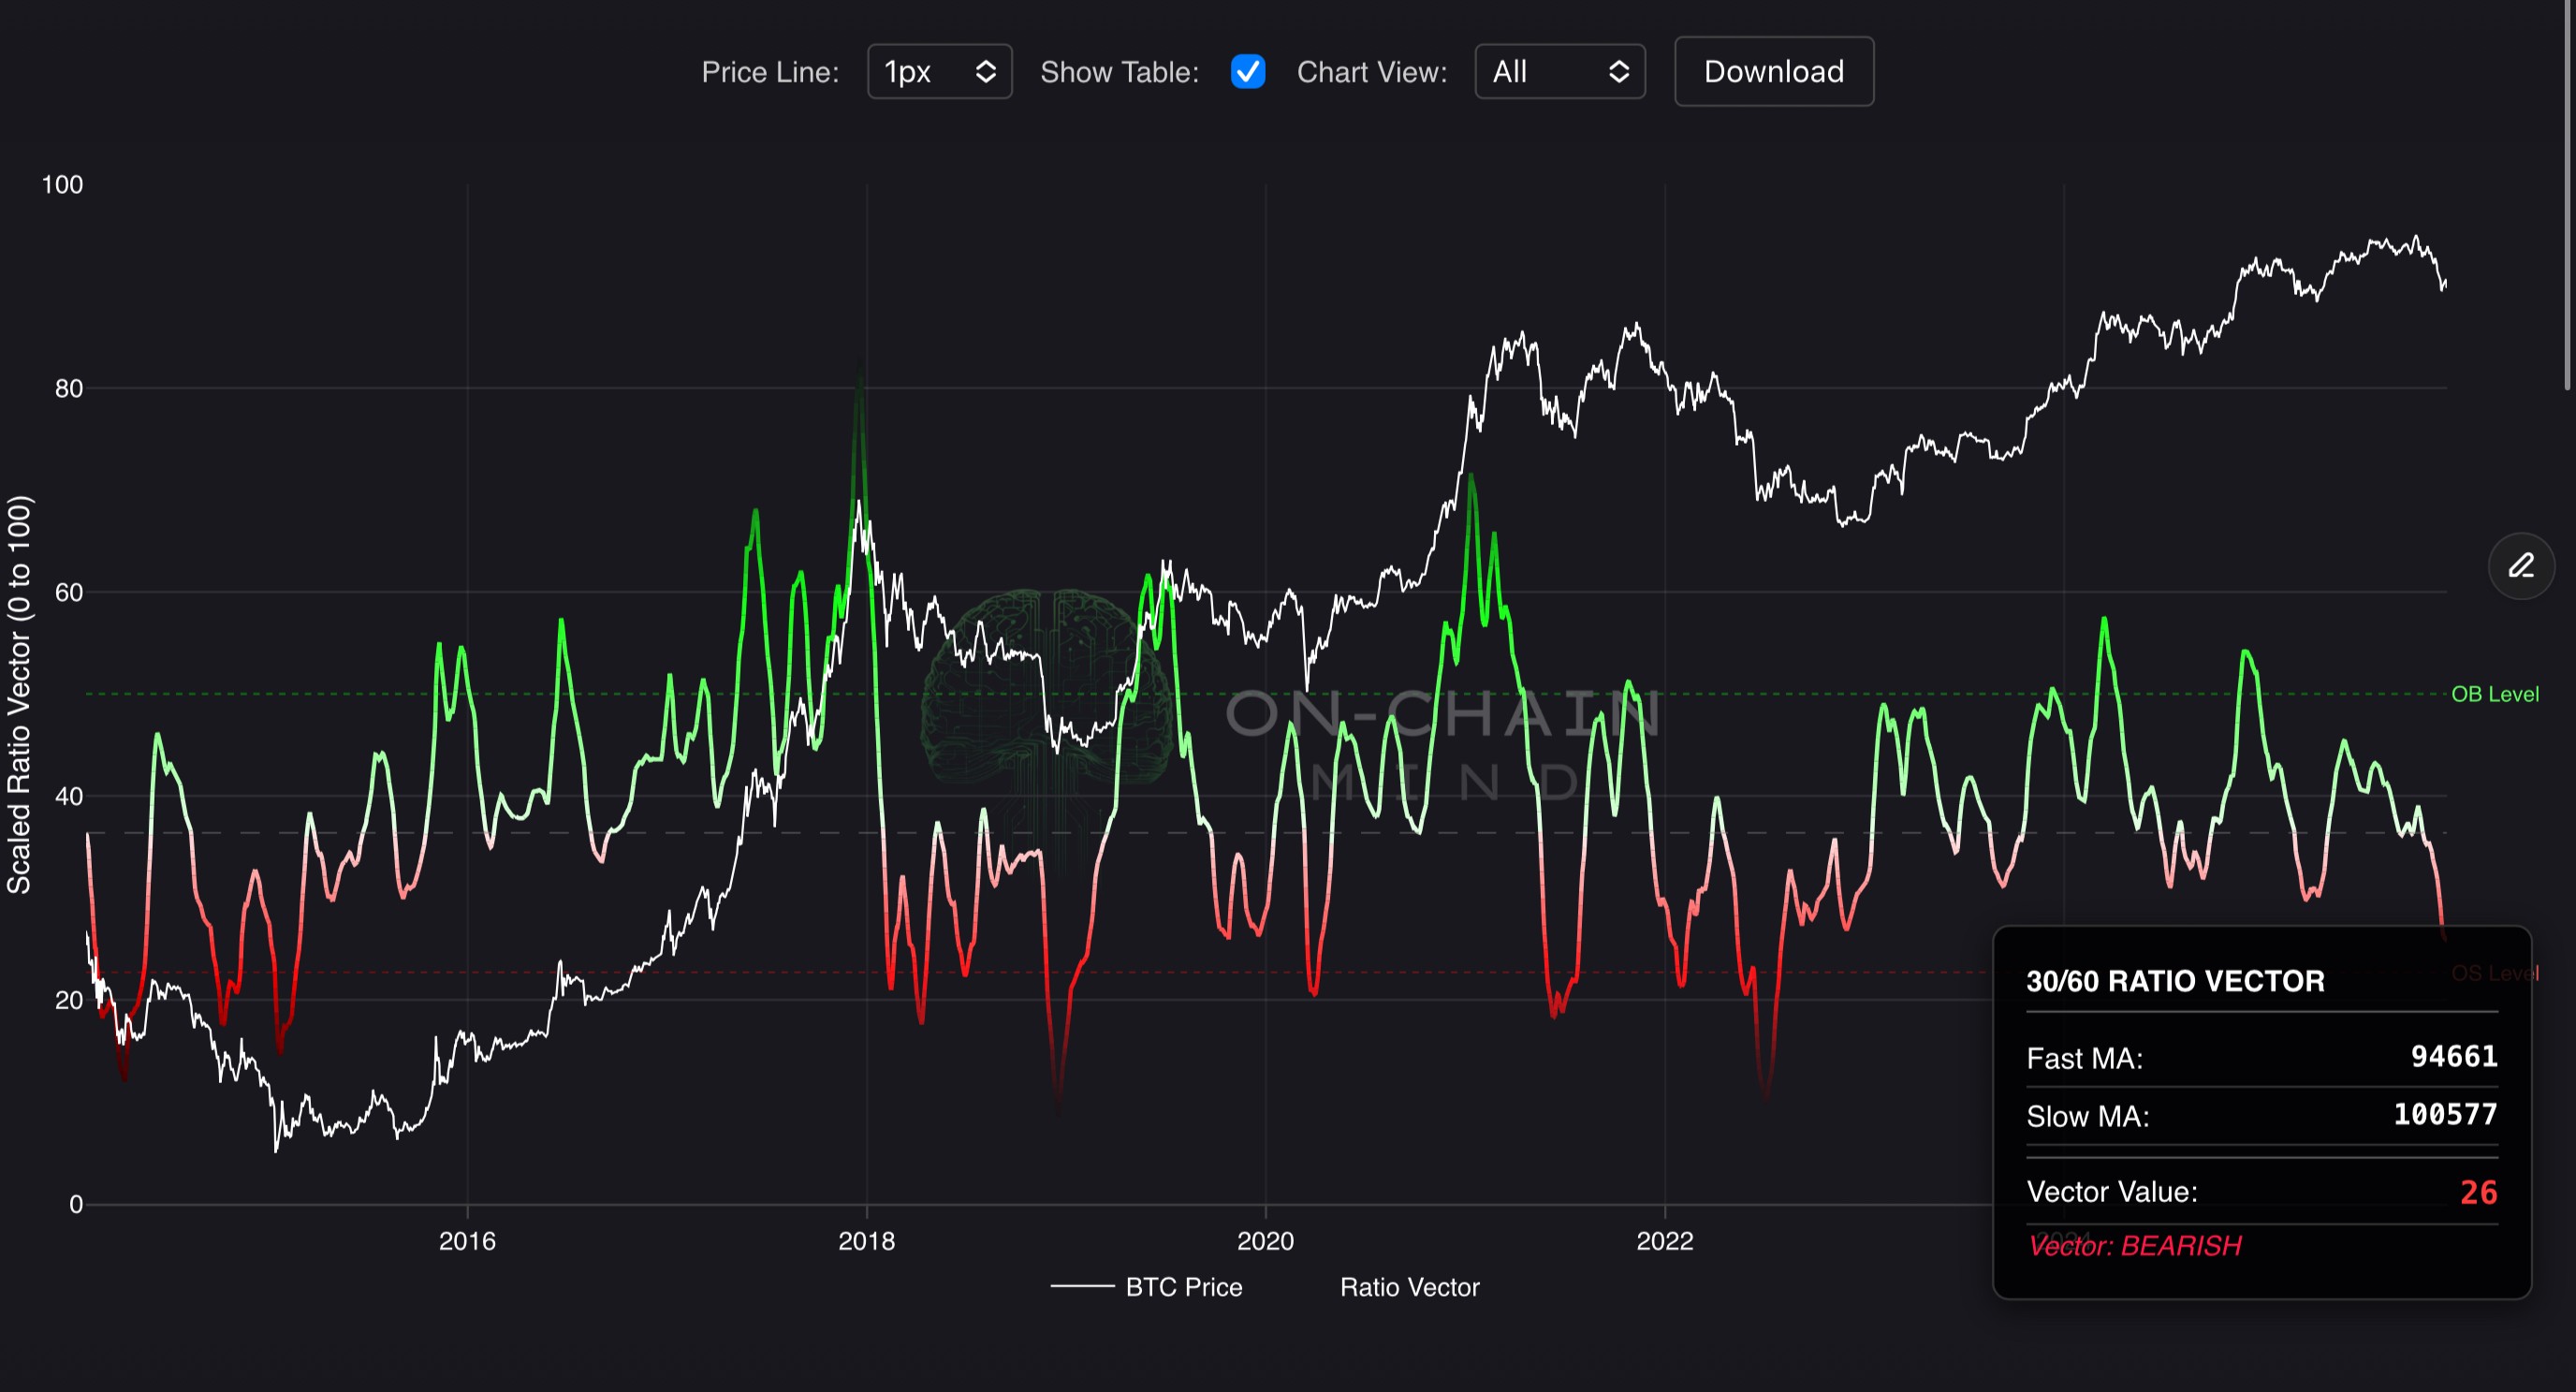
30/60 Ratio Vector
onchainmind.io
© 2025 On-Chain Mind. All rights reserved.
Description:
Premium Indicator
Premium Indicator
Indicator Overview
The 30/60 Ratio Vector is a powerful technical momentum indicator that evaluates Bitcoin’s trend dynamics by comparing a monthly vs. bi-monthly EMA, expressed as a divergence from 1. By compressing these changes into a visually intuitive gradient line and histogram, it highlights subtle and pronounced shifts in market momentum. Designed with cycle awareness, it accounts for Bitcoin’s mean-reverting nature and diminishing returns.
How To Use
Values above the overbought threshold (green dotted line) indicate strong bullish momentum, often signaling potential reversals, ideal for profit-taking or caution. Values below the oversold threshold (red dotted line) suggest bearish exhaustion, suitable for dollar-cost averaging or swing trading entries. The gradient line, shifting from red to green, and histogram visualise momentum strength, with background highlights confirming extreme zones. Traders can act on threshold crossovers or await background confirmations for precision. Investors may accumulate in oversold periods and reduce exposure in overbought phases to align with Bitcoin’s cyclical momentum dynamics.