
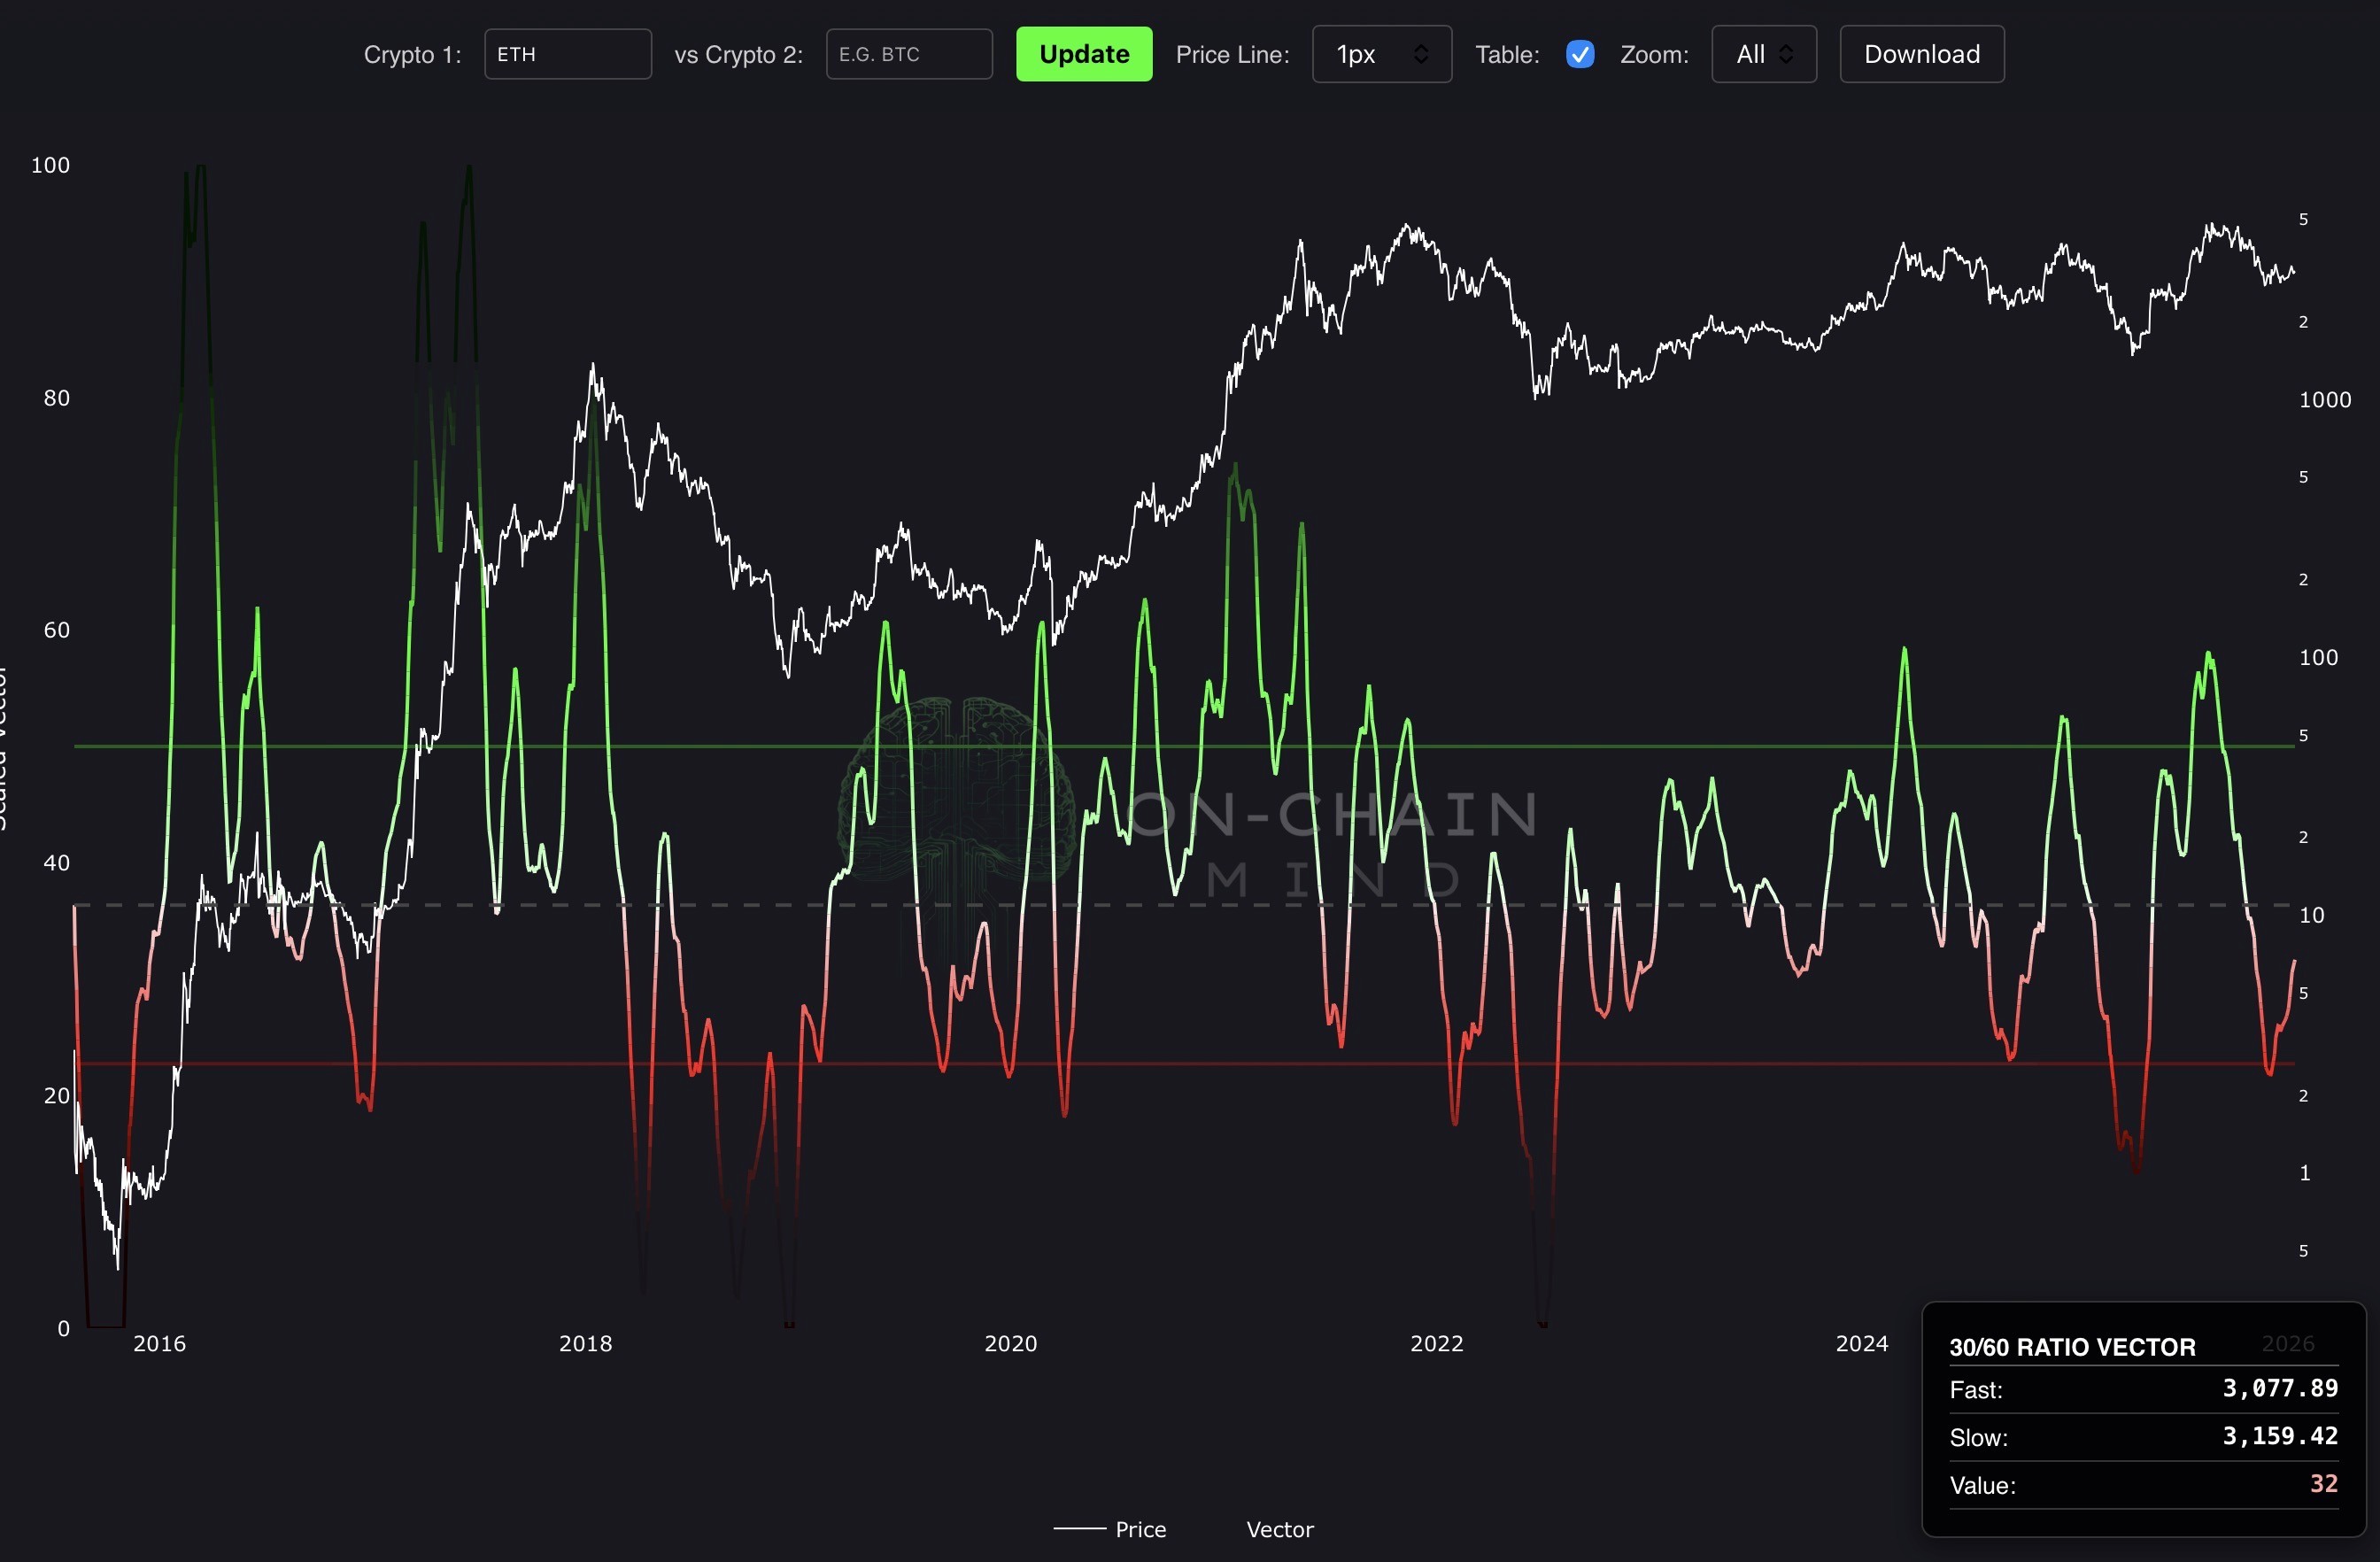
Altcoins 30/60 Ratio Vector
onchainmind.io
© 2025 On-Chain Mind. All rights reserved.
Description:
Premium Indicator
Premium Indicator
Indicator Overview
The 30/60 Ratio Vector is a powerful technical momentum indicator that evaluates trend dynamics by comparing a monthly vs. bi-monthly EMA, expressed as a divergence from 1. By compressing these changes into a visually intuitive gradient line and histogram, it highlights subtle and pronounced shifts in market momentum. Designed with cycle awareness, it accounts for crypto’s mean-reverting nature and diminishing returns.
Dual-Ticker Comparison Logic
The ‘Crypto’ fields allow the indicator to operate in both absolute price and relative performance modes, making it suitable for outright positioning or pair-based allocation decisions.
Single Crypto Analysis: If Crypto 2 is left blank, the indicator measures Crypto 1 against US Dollars. This mode is designed to identify statistically stretched rallies, deep mean-reversion zones, and long-term accumulation conditions where price trades multiple standard deviations below its historical average.
Relative Strength and Ratios: When both fields are populated, the indicator automatically constructs a ratio of Crypto 1 divided by Crypto 2, such as ETH/BTC or SUI/SOL. The metric is then calculated on the ratio itself, isolating relative performance and stripping out broad market beta. This enables precise identification of overperformance, underperformance, and regime shifts between assets.
How To Use
Values above the overbought threshold (green dotted line) indicate strong bullish momentum, often signalling potential reversals, ideal for profit-taking or caution. Values below the oversold threshold (red dotted line) suggest bearish exhaustion, suitable for dollar-cost averaging or swing trading entries. The gradient line, shifting from red to green, and histogram visualise momentum strength, with background highlights confirming extreme zones. Traders can act on threshold crossovers or await background confirmations for precision. Investors may accumulate in oversold periods and reduce exposure in overbought phases to align with cyclical momentum dynamics.