
Altcoins Mean Reversion Oscillator
onchainmind.io
© 2025 On-Chain Mind. All rights reserved.
Description:
Premium Indicator
Premium Indicator
Indicator Overview
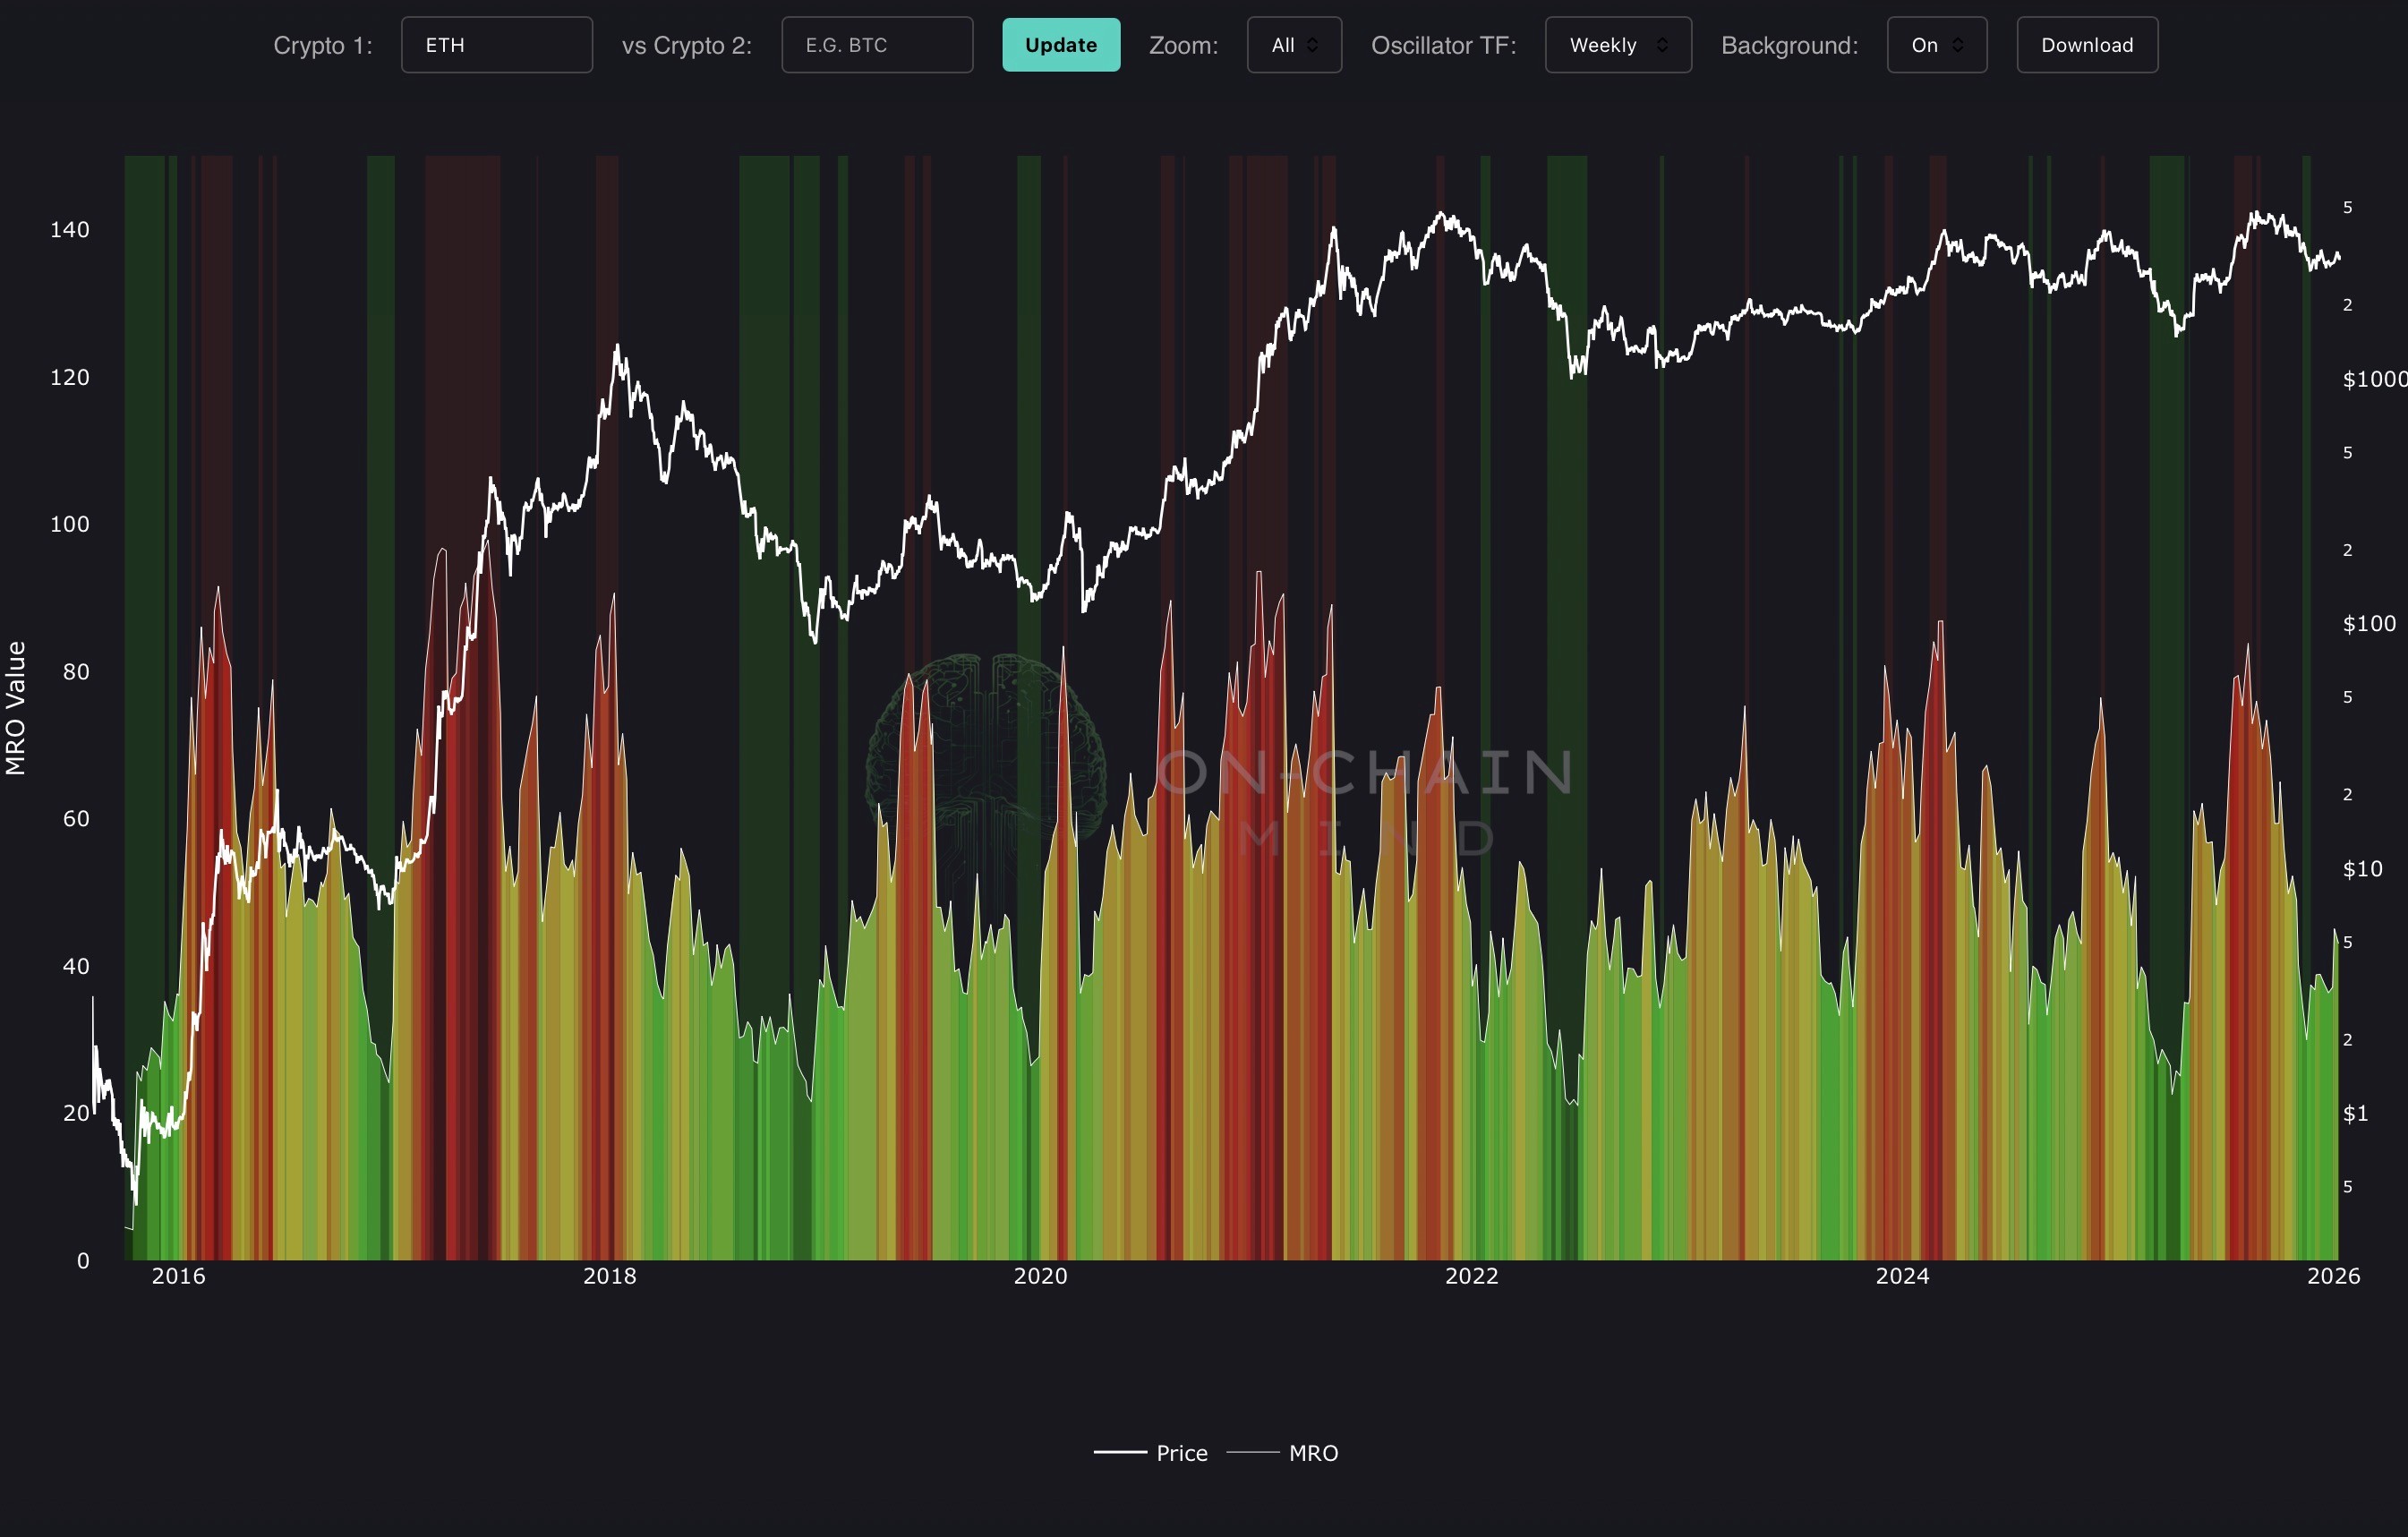
The Mean Reversion Oscillator (MRO) measures the deviation from recent price trends using an RSI-based methodology applied to both weekly and monthly aggregated data. Normalised and colour-coded, it produces a dynamic oscillator curve that highlights overbought and oversold conditions, enabling traders to visualise mean-reversion opportunities. The indicator also features a background glow to emphasise extreme conditions, providing an intuitive view of market pressure. By combining MRO readings with Bitcoin’s price on a log scale, the indicator delivers a clear framework for anticipating potential trend reversals or consolidation phases.
Dual-Ticker Comparison Logic
The ‘Crypto’ fields allow the indicator to operate in both absolute price and relative performance modes, making it suitable for outright positioning or pair-based allocation decisions.
Single Crypto Analysis: If Crypto 2 is left blank, the indicator measures Crypto 1 against US Dollars. This mode is designed to identify statistically stretched rallies, deep mean-reversion zones, and long-term accumulation conditions where price trades multiple standard deviations below its historical average.
Relative Strength and Ratios: When both fields are populated, the indicator automatically constructs a ratio of Crypto 1 divided by Crypto 2, such as ETH/BTC or SUI/SOL. The metric is then calculated on the ratio itself, isolating relative performance and stripping out broad market beta. This enables precise identification of overperformance, underperformance, and regime shifts between assets.
How To Use
The MRO curve uses a colour gradient to communicate the strength of market deviation. Values approaching the upper extreme indicate overbought conditions (potential pullbacks), while lower values signal oversold conditions (potential rebounds). Weekly and monthly timeframes can be toggled to distinguish between short-term and macro-level cycles. The background glow further highlights these extremes: red zones mark overbought regions, green zones highlight oversold periods. Traders can use rising oscillator values to manage caution during peaks and focus on accumulation during low-value troughs, capturing opportunities in cyclical mean-reversion dynamics.