
Bitcoin ETF Volatility
onchainmind.io
© 2025 On-Chain Mind. All rights reserved.
Add to Favourites
Description:
Premium Indicator
Premium Indicator
Indicator Overview
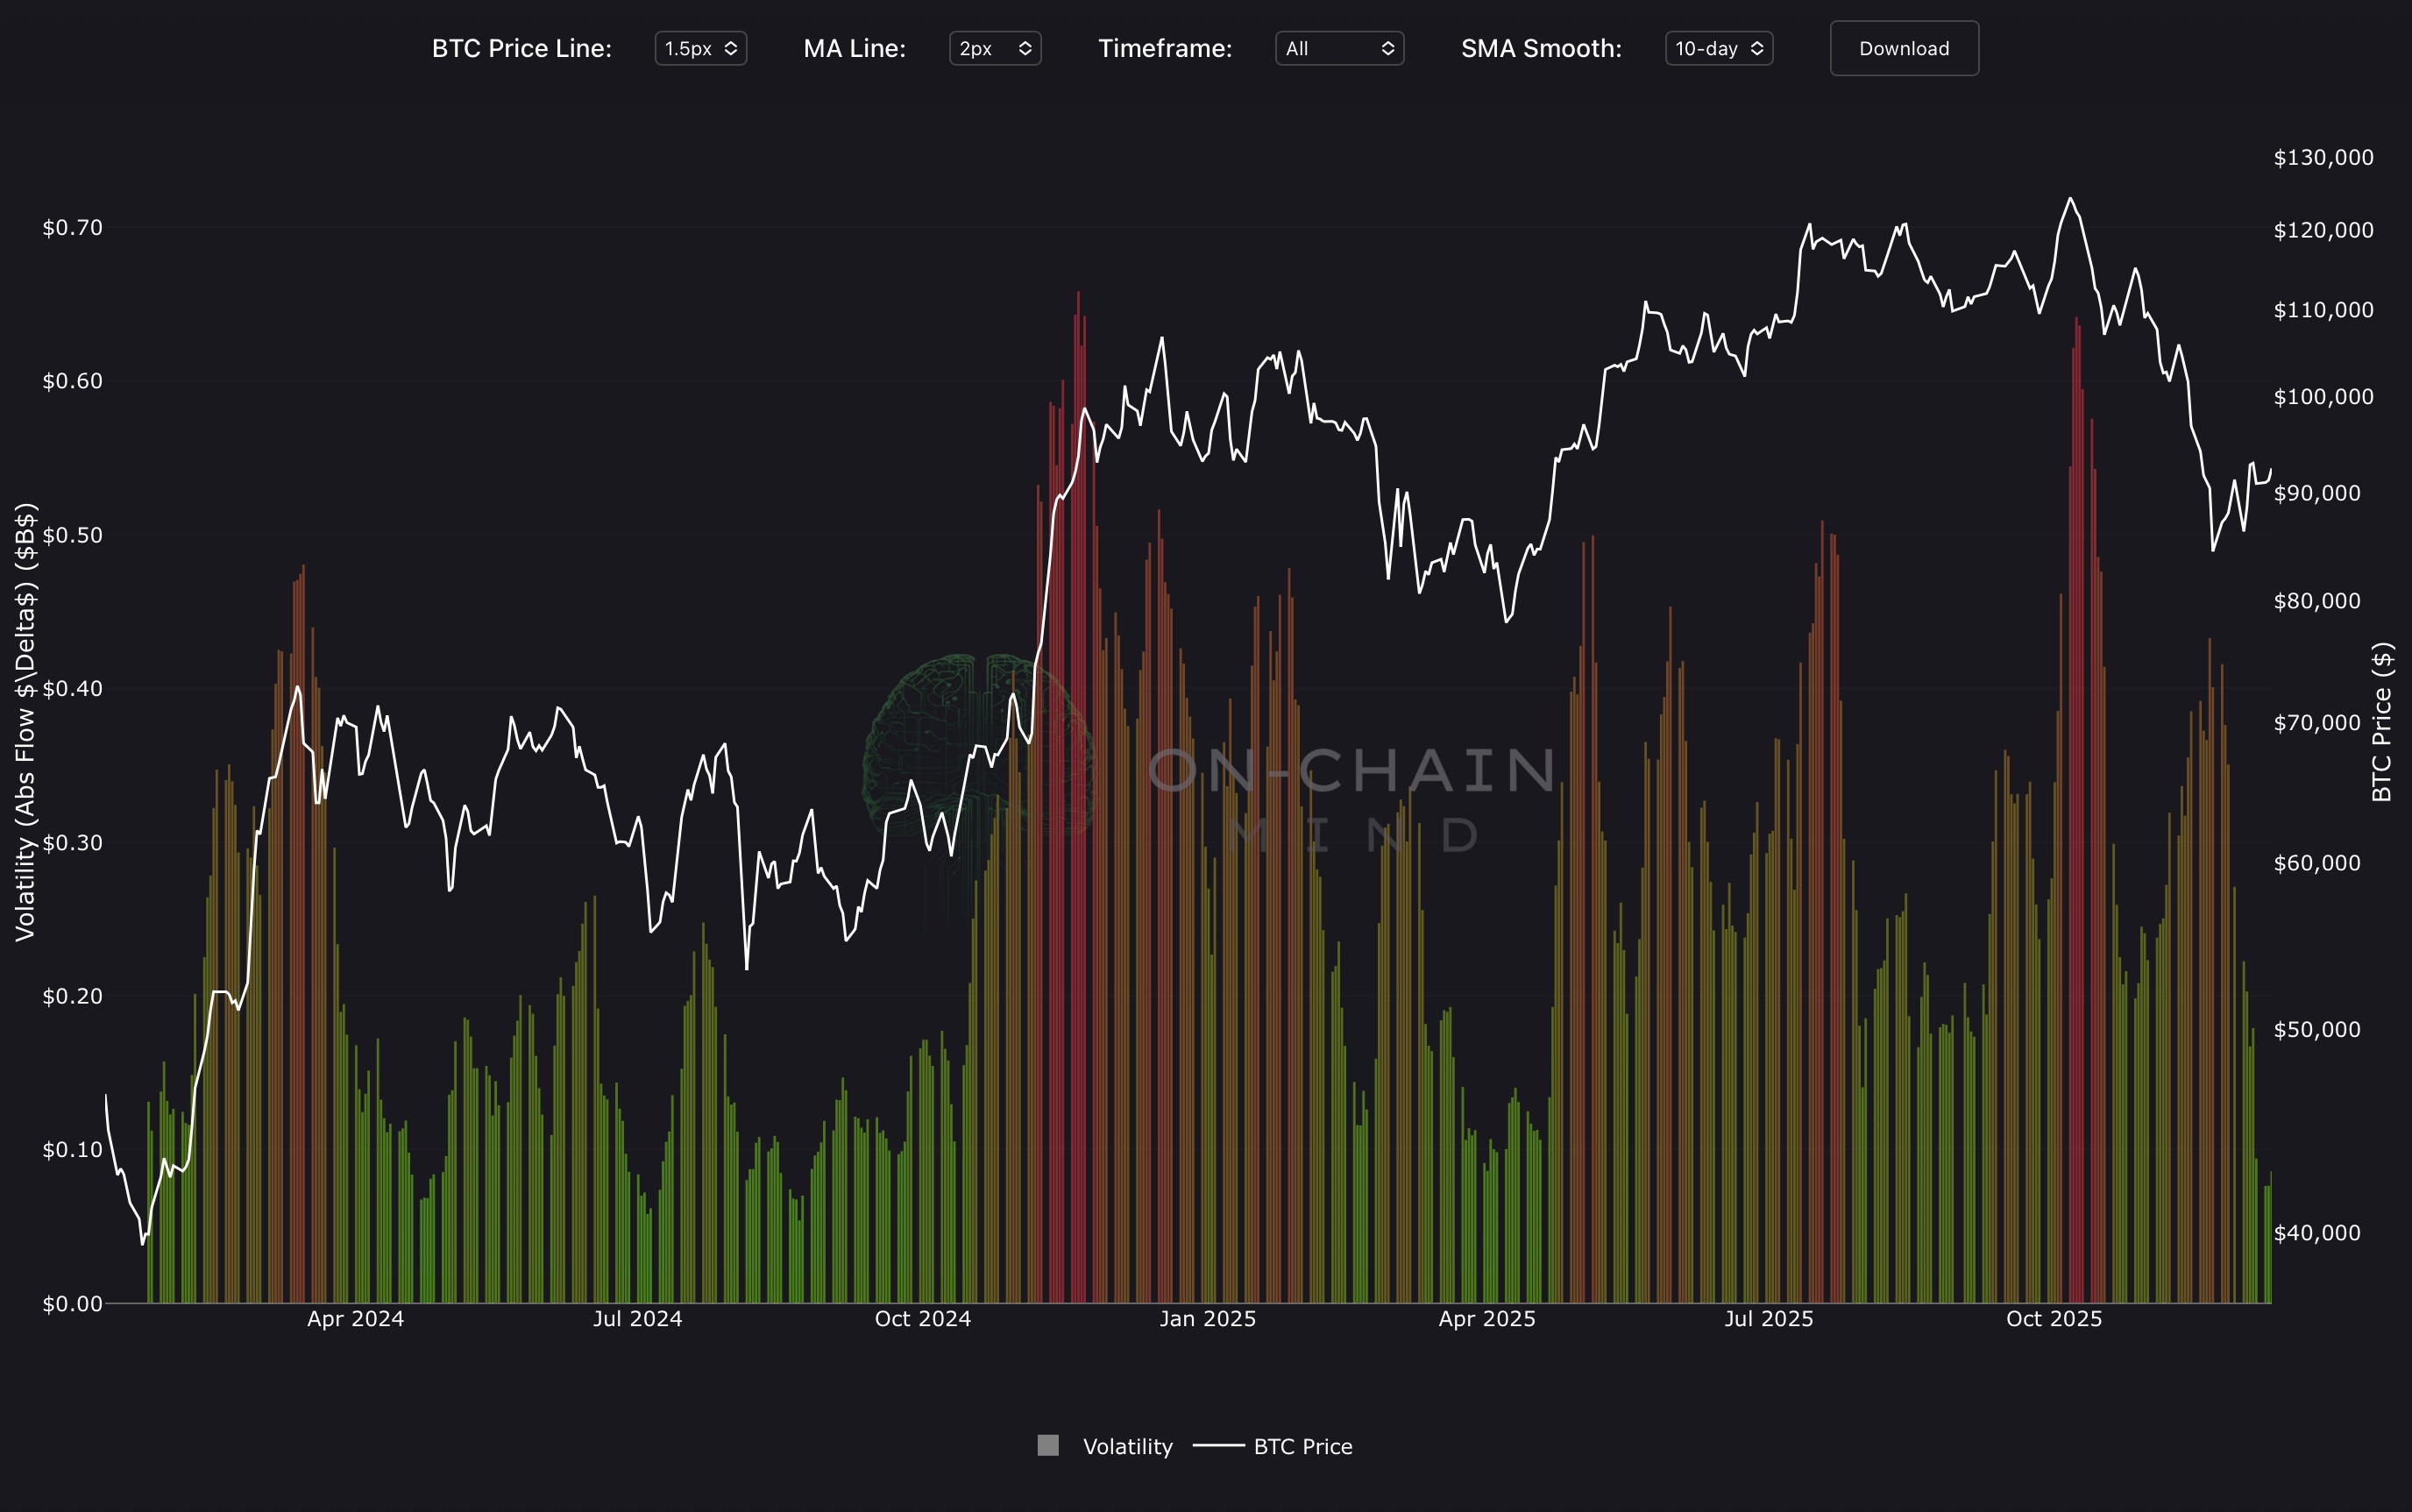
The Bitcoin ETF Volatility indicator measures the absolute daily change in cumulative ETF net flows (in USD billions), smoothed over a user-selected period (10-50 days), and displayed as a bar chart with a dynamic lime-to-red gradient (lime for low volatility, vivid red for extreme turbulence). This creates an instant visual read of institutional flow stability versus panic.
How To Use
Vivid red spikes signal explosive volatility in ETF flows and historically coincide with major market shocks, forced redemptions, or liquidation cascades, often marking the climax of fear-driven sell-offs and ideal zones for contrarian accumulation. Lime green bars reveal prolonged calm and typically occur during steady inflows, consolidation, or post-crash rebuilding, creating low-risk environments for positioning ahead of the next move.
Traders monitor red spikes as euphoric signals, persistent lime zones as stealth accumulation windows, and the transition from red to lime as confirmation of regime shift, making ETF Volatility one of the most direct tools for reading institutional panic versus conviction in real time.
Copyright © 2025 On-Chain Mind