
BTC Sharpe Ratio
onchainmind.io
© 2025 On-Chain Mind. All rights reserved.
Description:
Premium Indicator
Premium Indicator
Indicator Overview
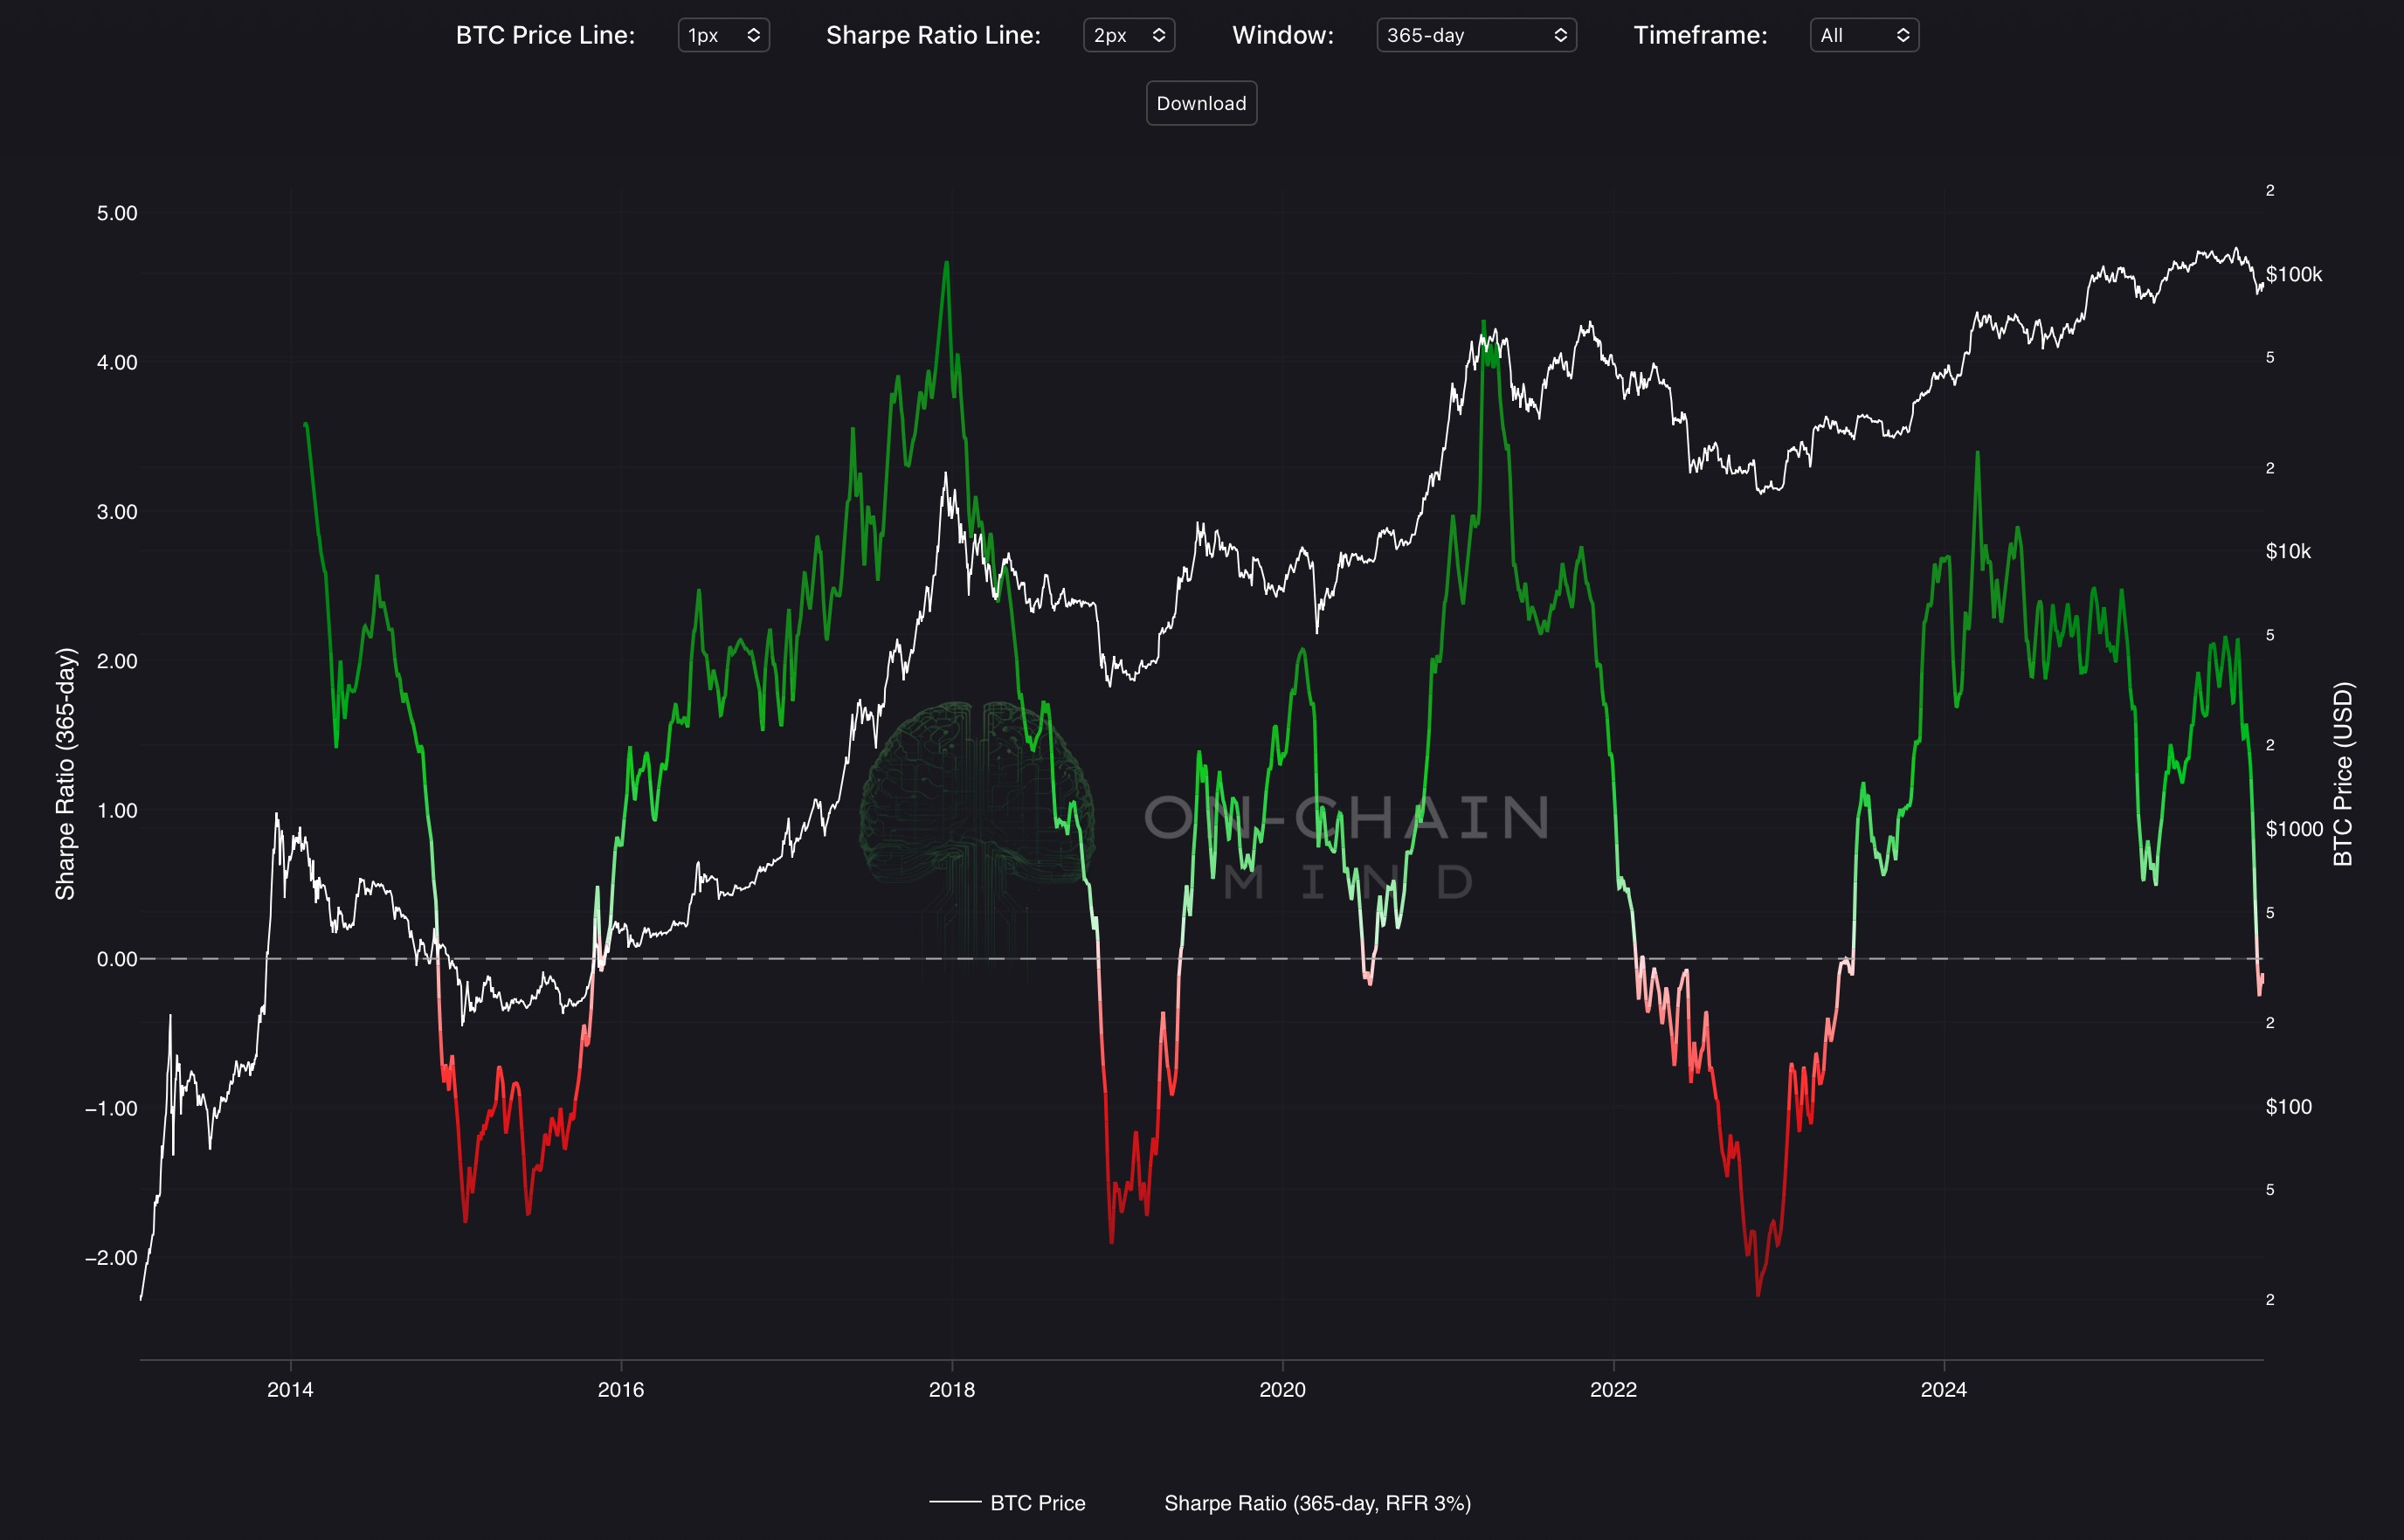
The Sharpe Ratio (BTC) indicator measures Bitcoin’s risk-adjusted return by calculating the annualised excess return over a risk-free rate (fixed at 3%) divided by the standard deviation of returns, using user-selectable rolling windows (90-day, 180-day, 365-day, or 730-day). The metric is displayed on the primary axis with a dual-gradient colour scheme, red intensifying for negative values (poor risk-adjusted performance) and green intensifying for positive values (strong risk-adjusted performance), while Bitcoin’s price is overlaid on a secondary logarithmic axis in white for contextual reference.
How To Use
High and rising Sharpe Ratio values (especially above 1.0–2.0) signal strong risk-adjusted outperformance, indicating efficient bull markets, healthy accumulation phases, and favourable reward-to-risk conditions for holding or entering positions, while low or negative values highlight periods of poor returns relative to volatility, often marking bear markets, drawdowns, or inefficient price action warranting caution or reduced exposure. Divergences, such as Bitcoin price reaching new highs while the Sharpe Ratio weakens or remains subdued, warn of deteriorating risk-adjusted momentum and potential reversals, whereas price consolidation or declines accompanied by a rising Sharpe Ratio suggest improving efficiency and upcoming bullish regimes. Traders monitor crosses above zero for regime shifts into positive risk-adjusted territory, sustained readings above historical averages for trend confirmation, or drops below key supports as exit signals, enhancing timing of entries, position sizing, and overall cycle navigation in Bitcoin markets.