
Bull Momentum Gauge
onchainmind.io
© 2025 On-Chain Mind. All rights reserved.
Description:
Premium Indicator
Premium Indicator
Indicator Overview
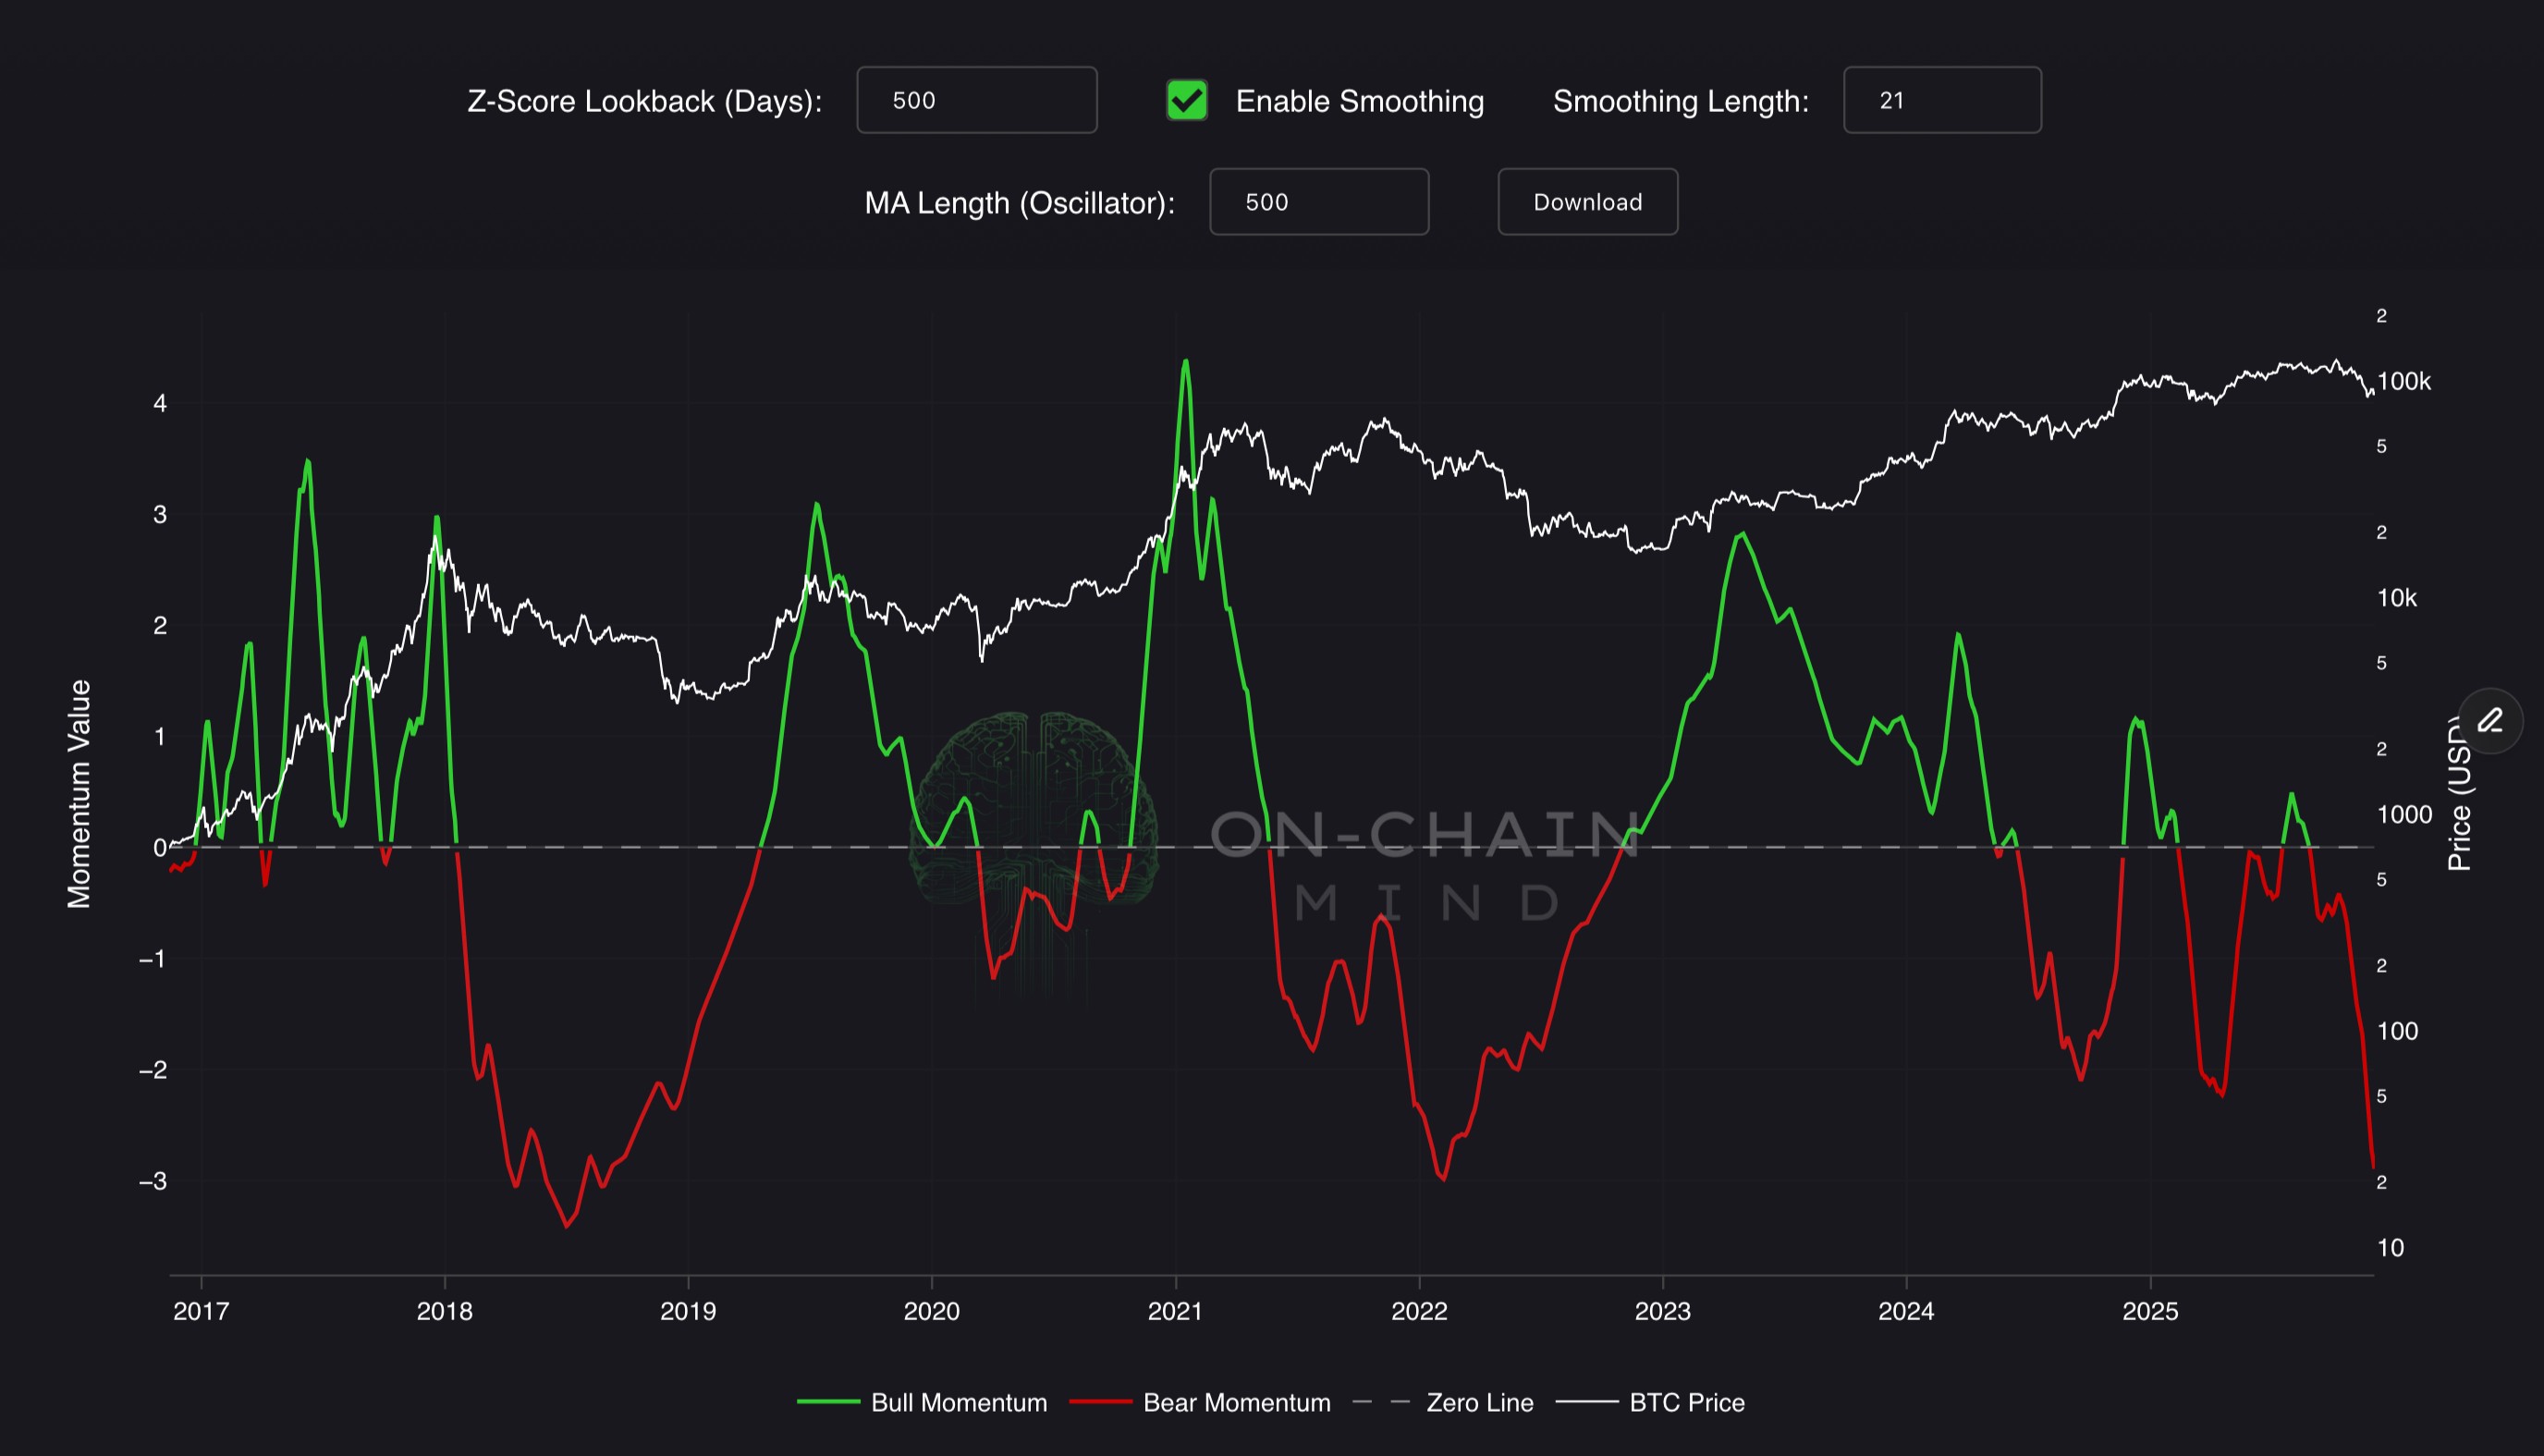
The Bull Momentum Gauge measures the relative strength of Bitcoin’s price action by comparing the inverted Z-score of its deviation from the 365-day (1-year) moving average to its own 200-day moving average. In simpler terms, it quantifies how abnormally stretched or compressed Bitcoin’s price is, relative to its long-term trend. By inverting the Z-score, we focus on positive momentum rather than negative deviation. The comparison to the 200-day average of this Z-score ensures that we smooth out short-term noise and capture sustained market strength or weakness, creating a dynamic, responsive gauge of bullish momentum.
This indicator helps filter out sideways or uncertain price action and avoids reliance on subjective macro or narrative-based analysis. When the value of the gauge crosses above its 200-day moving average, it signals a momentum regime shift to the upside — this is a “green zone” indicating a favourable risk-reward environment. Conversely, when it falls below, we enter the “red zone”, suggesting weakening momentum and a higher risk of drawdown. This approach allows for systematic entries and exits based purely on price-derived momentum, helping traders ride major bull trends while avoiding prolonged bear phases.
How To Use
Traders can buy on positive crossovers above zero and sell or hedge on negative shifts. Investors may accumulate during lime phases and reduce exposure in red zones, leveraging the gauge’s cycle-aware design to capitalise on Bitcoin’s momentum-driven market cycles.