
Daily Mining Revenue (USD)
onchainmind.io
© 2025 On-Chain Mind. All rights reserved.
Add to Favourites
Description:
Premium Indicator
Premium Indicator
Indicator Overview
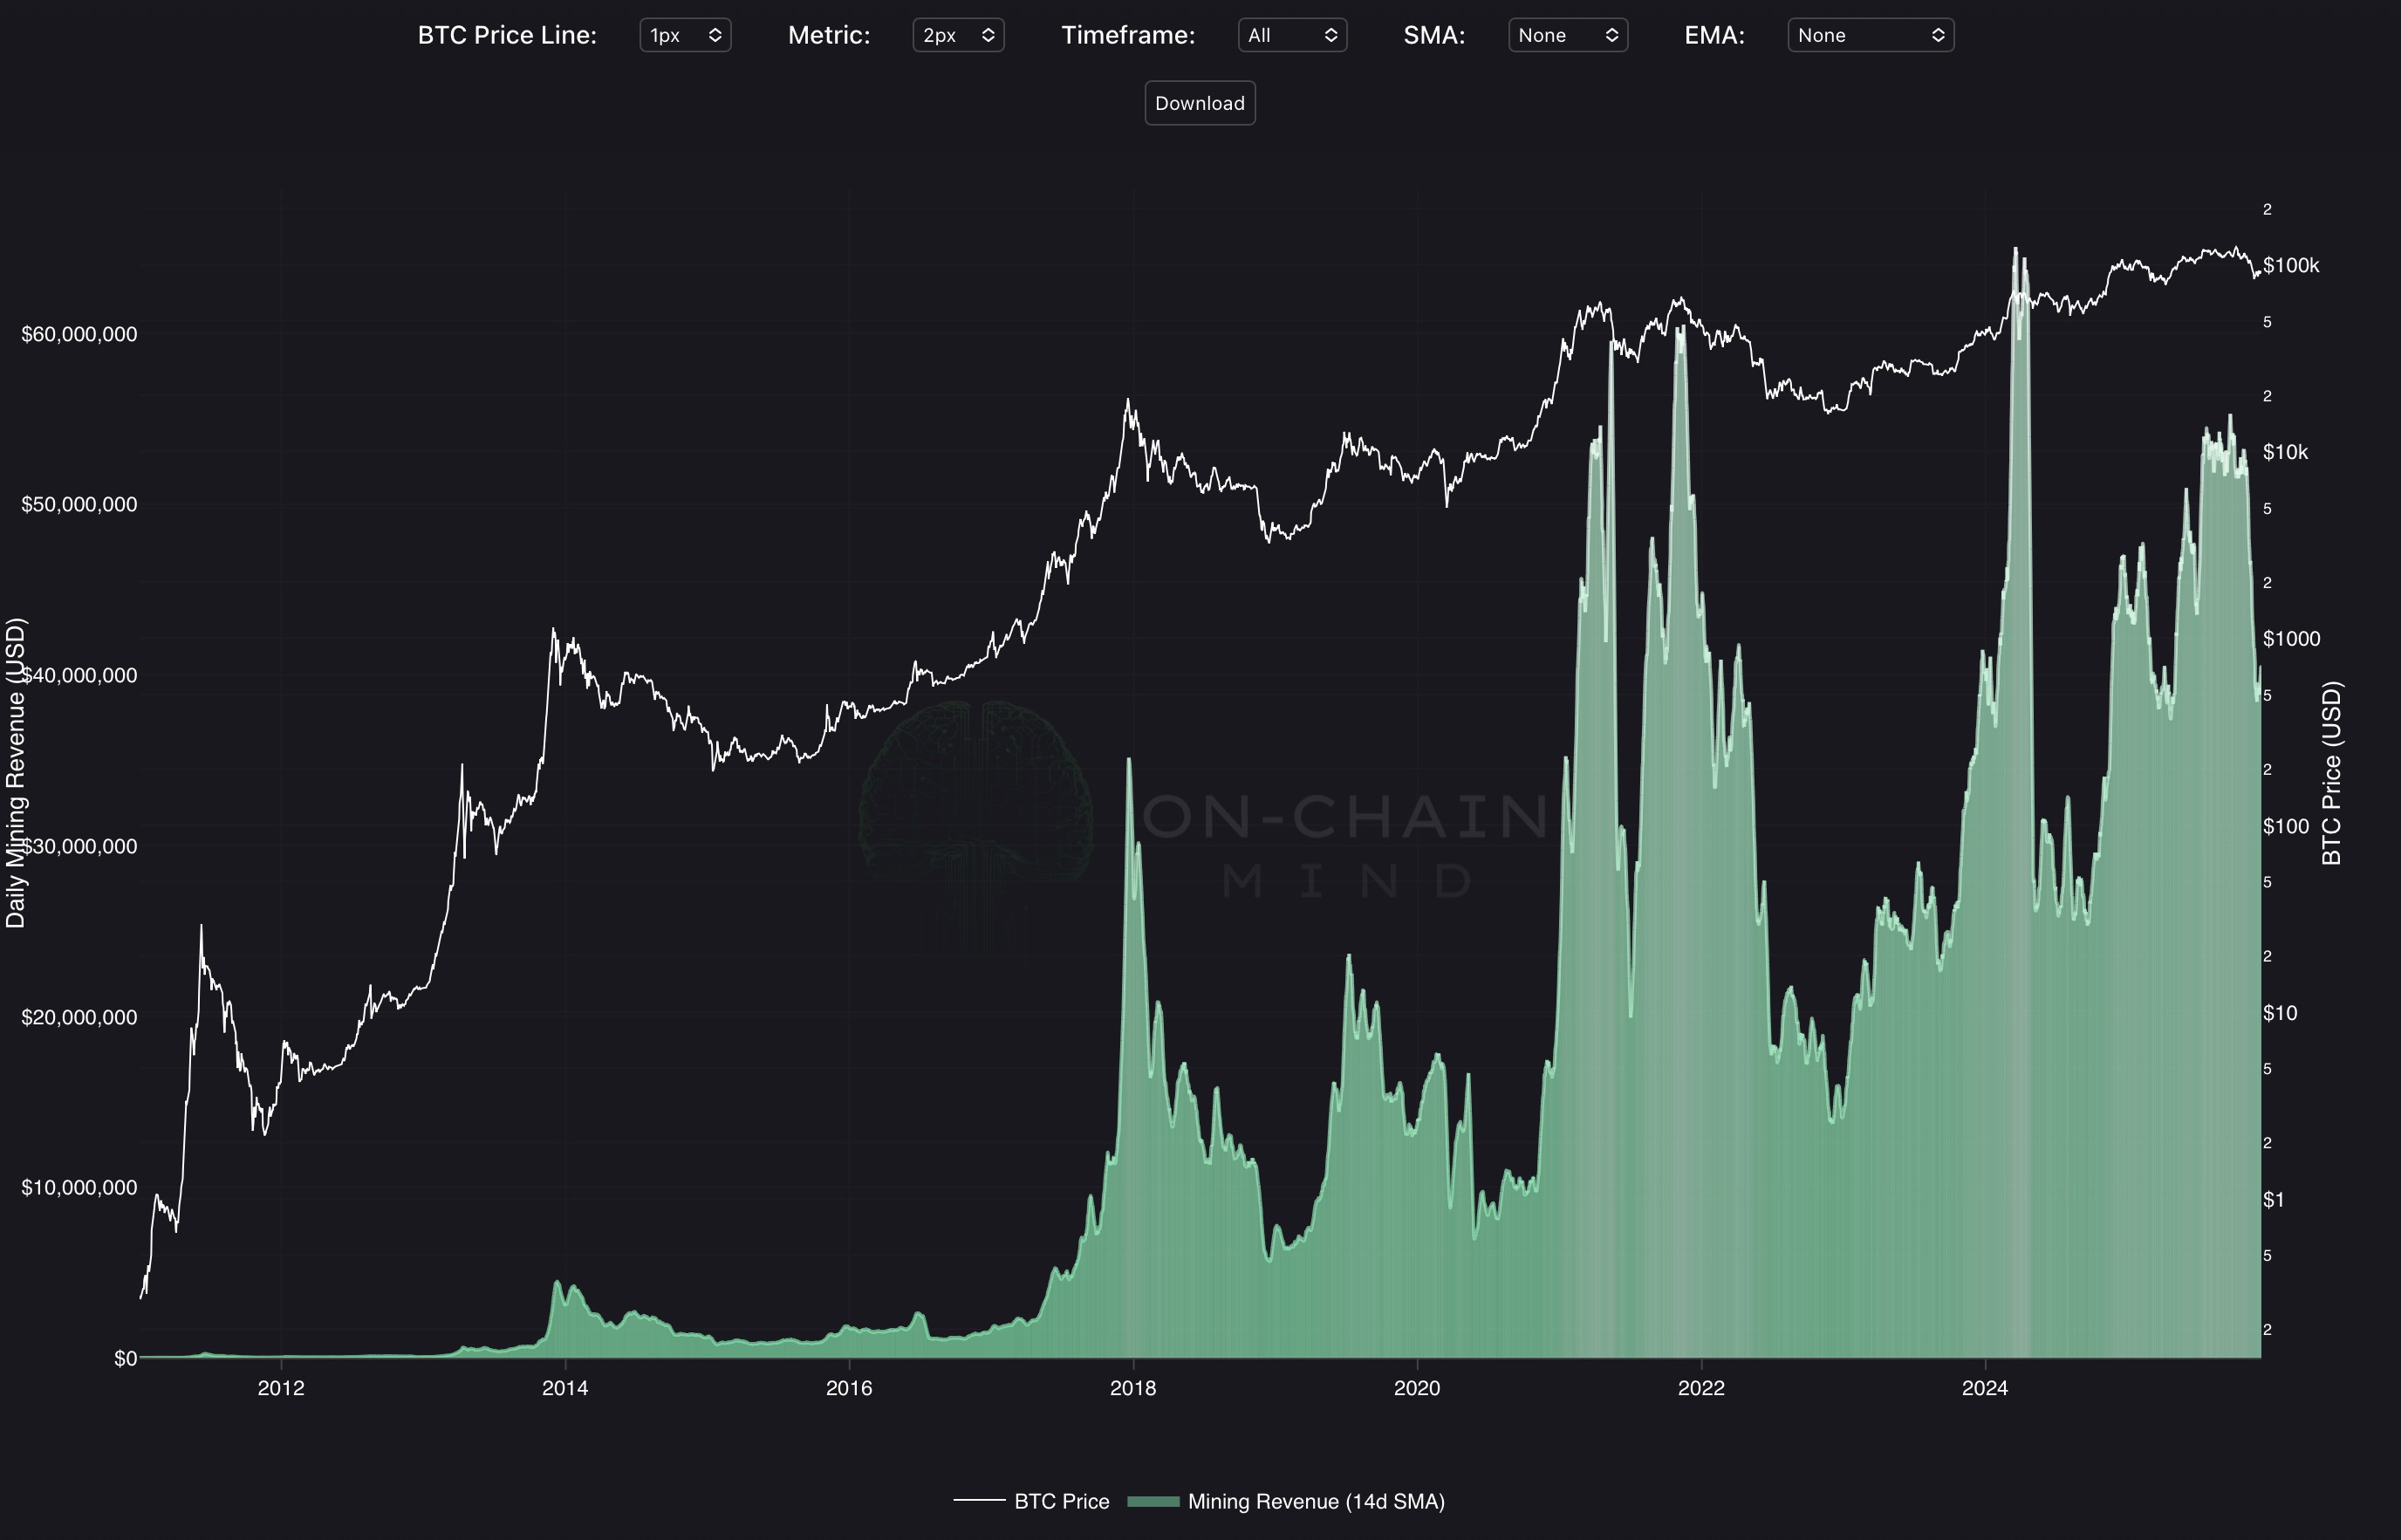
The Daily Mining Revenue indicator displays Bitcoin miners’ daily USD revenue presented as a filled area chart with a gradient from deep green (low revenue) to bright white (peak revenue). Bitcoin’s spot price is overlaid on a secondary logarithmic axis in white for context, with optional SMA/EMA overlays and unified hover showing exact revenue figures. This creates an immediate visual read of miner income pressure and its impact on network security and selling behaviour.
How To Use
Bright white spikes signal extreme revenue events, typically coinciding with all-time high prices, halving anticipation, or parabolic bull runs, marking periods of maximum miner profitability and potential supply flooding as older coins are sold. Deep green troughs reveal revenue collapse, historically occurring during brutal bear markets, capitulation phases, or post-halving adjustment, creating windows of minimal selling pressure and some of the strongest accumulation zones in Bitcoin’s history.
Divergences are critical: price rallying on declining (green-shifting) revenue warns of weakening miner support and impending corrections, while price weakness with stabilising or rising revenue suggests resilient network economics and high-probability rebounds. Traders monitor white extremes as caution or profit-taking signals and deep green zones as generational buying opportunities, making Daily Mining Revenue one of the purest on-chain indicators of supply-side pressure and cycle inflection points in Bitcoin markets.
Copyright © 2025 On-Chain Mind