
Diminishing MACD
onchainmind.io
© 2025 On-Chain Mind. All rights reserved.
Description:
Premium Indicator
Premium Indicator
Indicator Overview
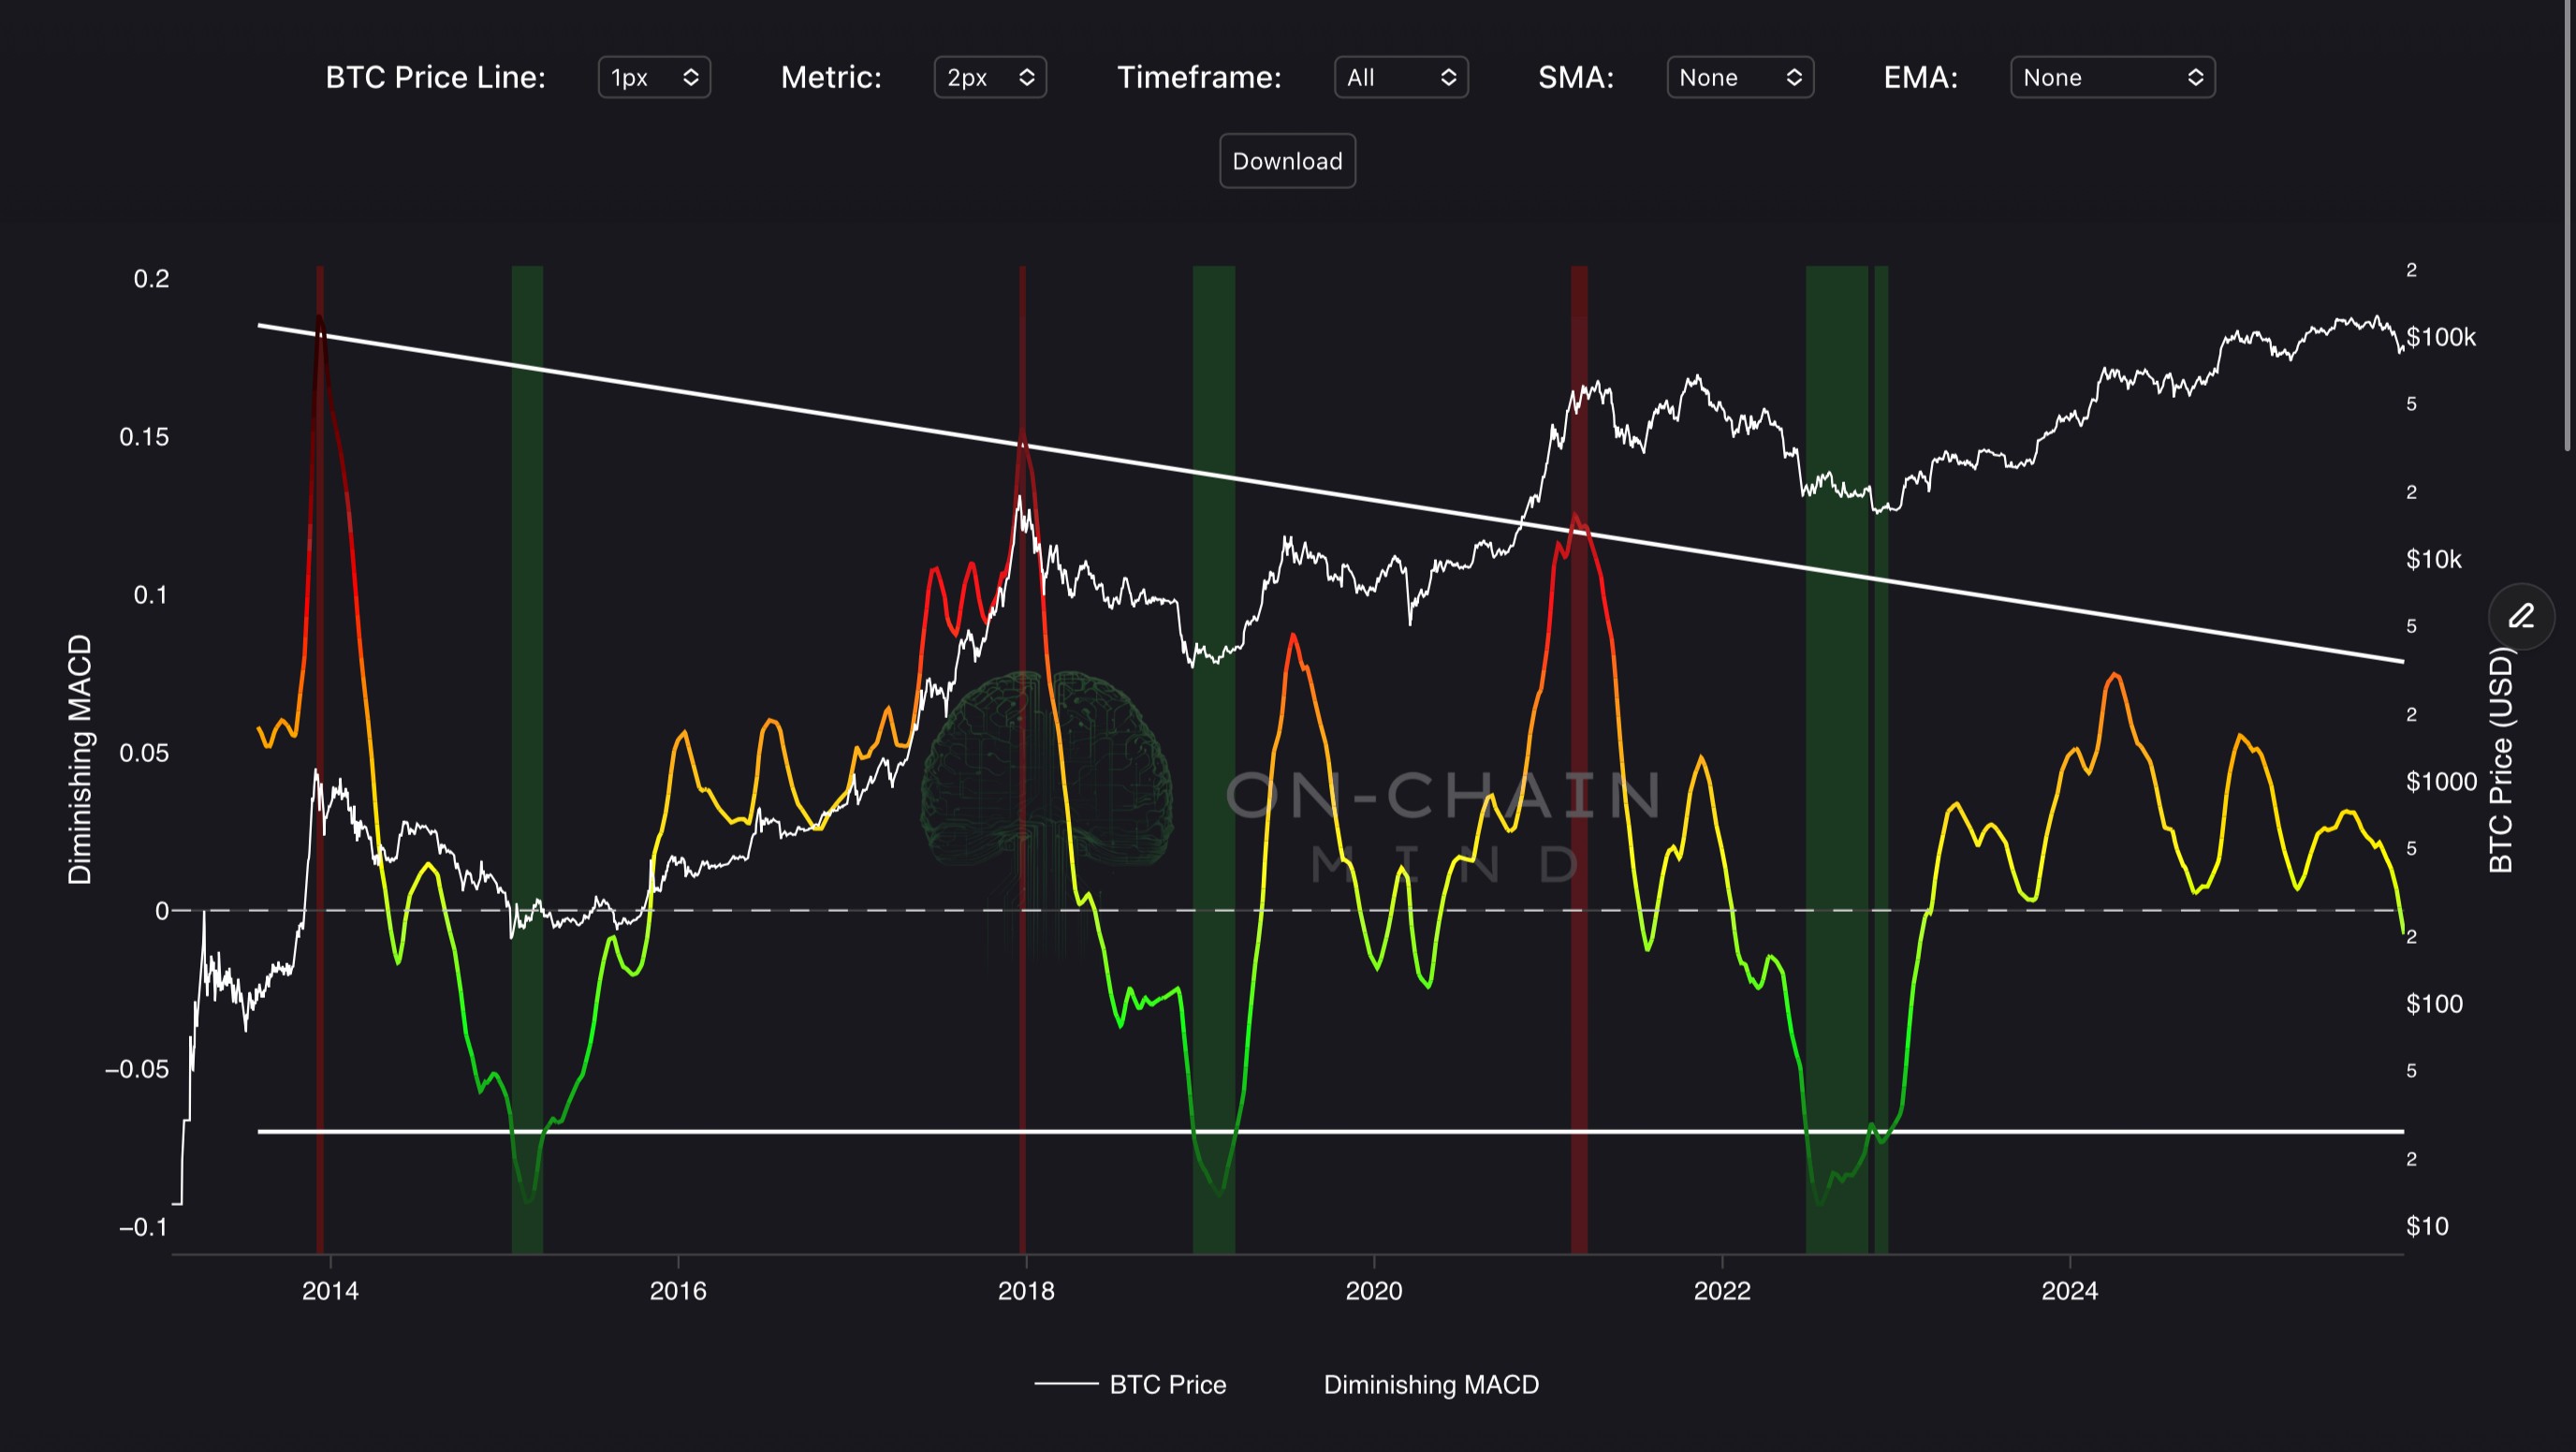
The Diminishing MACD indicator measures Bitcoin’s momentum by calculating the logarithmic difference between a fast and slow EMA of weekly closing prices. It highlights diminishing returns in price trends, with a normalised range and dynamic trigger lines. This indicator is vital for identifying overbought or oversold conditions, helping investors gauge when Bitcoin’s momentum is peaking or troughing within its cyclical market structure.
How To Use
Values above the top trigger (white line) indicate strong bullish momentum, often signaling overbought conditions and potential reversals, prompting caution or profit-taking. Values below the bottom trigger (grey line) suggest oversold conditions, ideal for accumulation during price dips. The gradient line, shifting from black to white, visualises momentum intensity. Background colours (red for above, green for below) highlight extreme zones. Traders can buy on dips below the bottom trigger and sell on spikes above the top trigger. Investors may increase exposure during oversold periods and reduce positions in overbought phases to align with Bitcoin’s momentum cycles.