
Logarithmic Deviation Torch
Description:
Premium Indicator
Indicator Overview
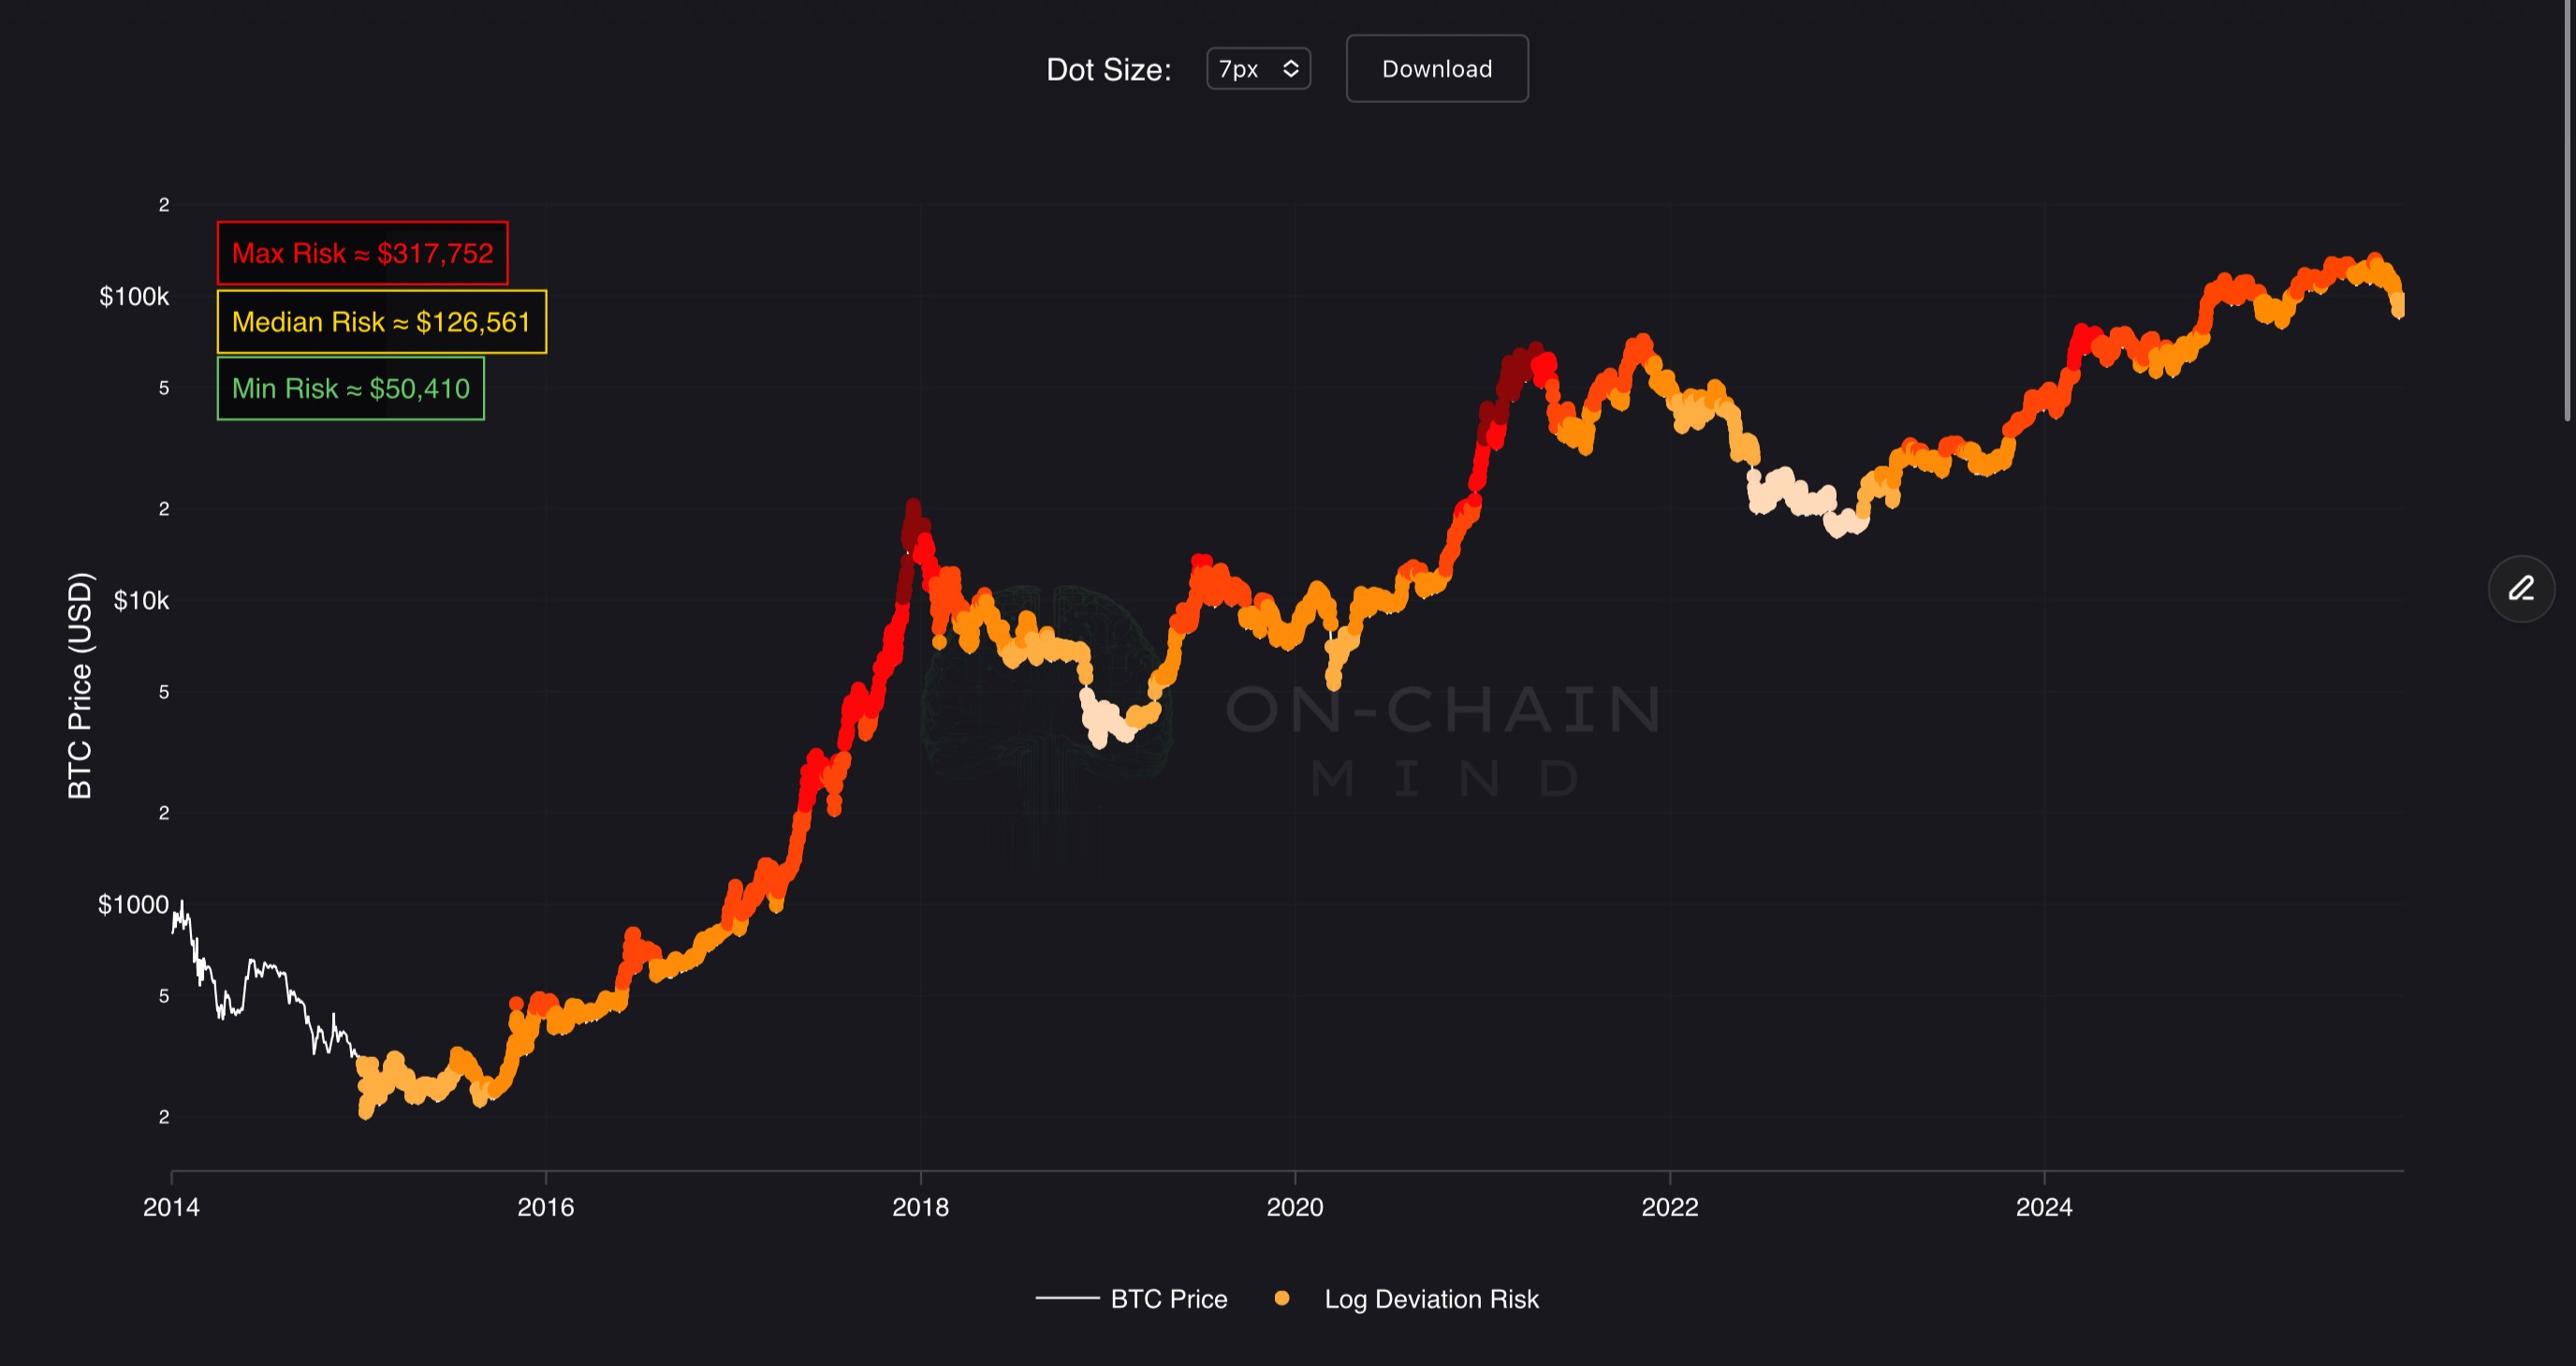
The Logarithmic Deviation Torch is a long-term valuation and risk-assessment tool that measures Bitcoin’s historical over- and underextension relative to a long term average. By combining logarithmic price deviation with a time-weighting factor, it creates a single metric that gives greater relevance to recent market cycles while preserving the full historical spectrum. The resulting values are normalized across all available data and displayed as colored dots above the price chart, using a 6-stage heat-map scale from peach (extreme underextension) to dark red (extreme overextension). Three key projected price levels — Max Risk, Median Risk, and Min Risk, are displayed in real time, showing the Bitcoin price that would correspond to the most extreme historical deviations if they occurred today.
How To Use
Extreme dark red dots signal historically rare overextension and elevated crash risk, while peach/white dots indicate extreme underextension and historically strong accumulation zones. The Max Risk annotation (red) represents the price level Bitcoin would reach if current market structure replicated the most overextended regime in history, serving as a dynamic upper-boundary warning. Conversely, the Min Risk annotation (green) marks the level corresponding to the deepest historical undervaluation. Traders use crossings of the Median Risk line and clustering of dot colors to assess regime shifts, identify potential cycle tops and bottoms, and calibrate position sizing. The indicator is most effective on full logarithmic history views and serves as a strategic compass for cycle-aware investors rather than a short-term timing tool.
Data Source: https://onchainmind.app
Copyright © 2025 On-Chain Mind