
Mean Reversion Oscillator
onchainmind.io
© 2025 On-Chain Mind. All rights reserved.
Description:
Premium Indicator
Premium Indicator
Indicator Overview
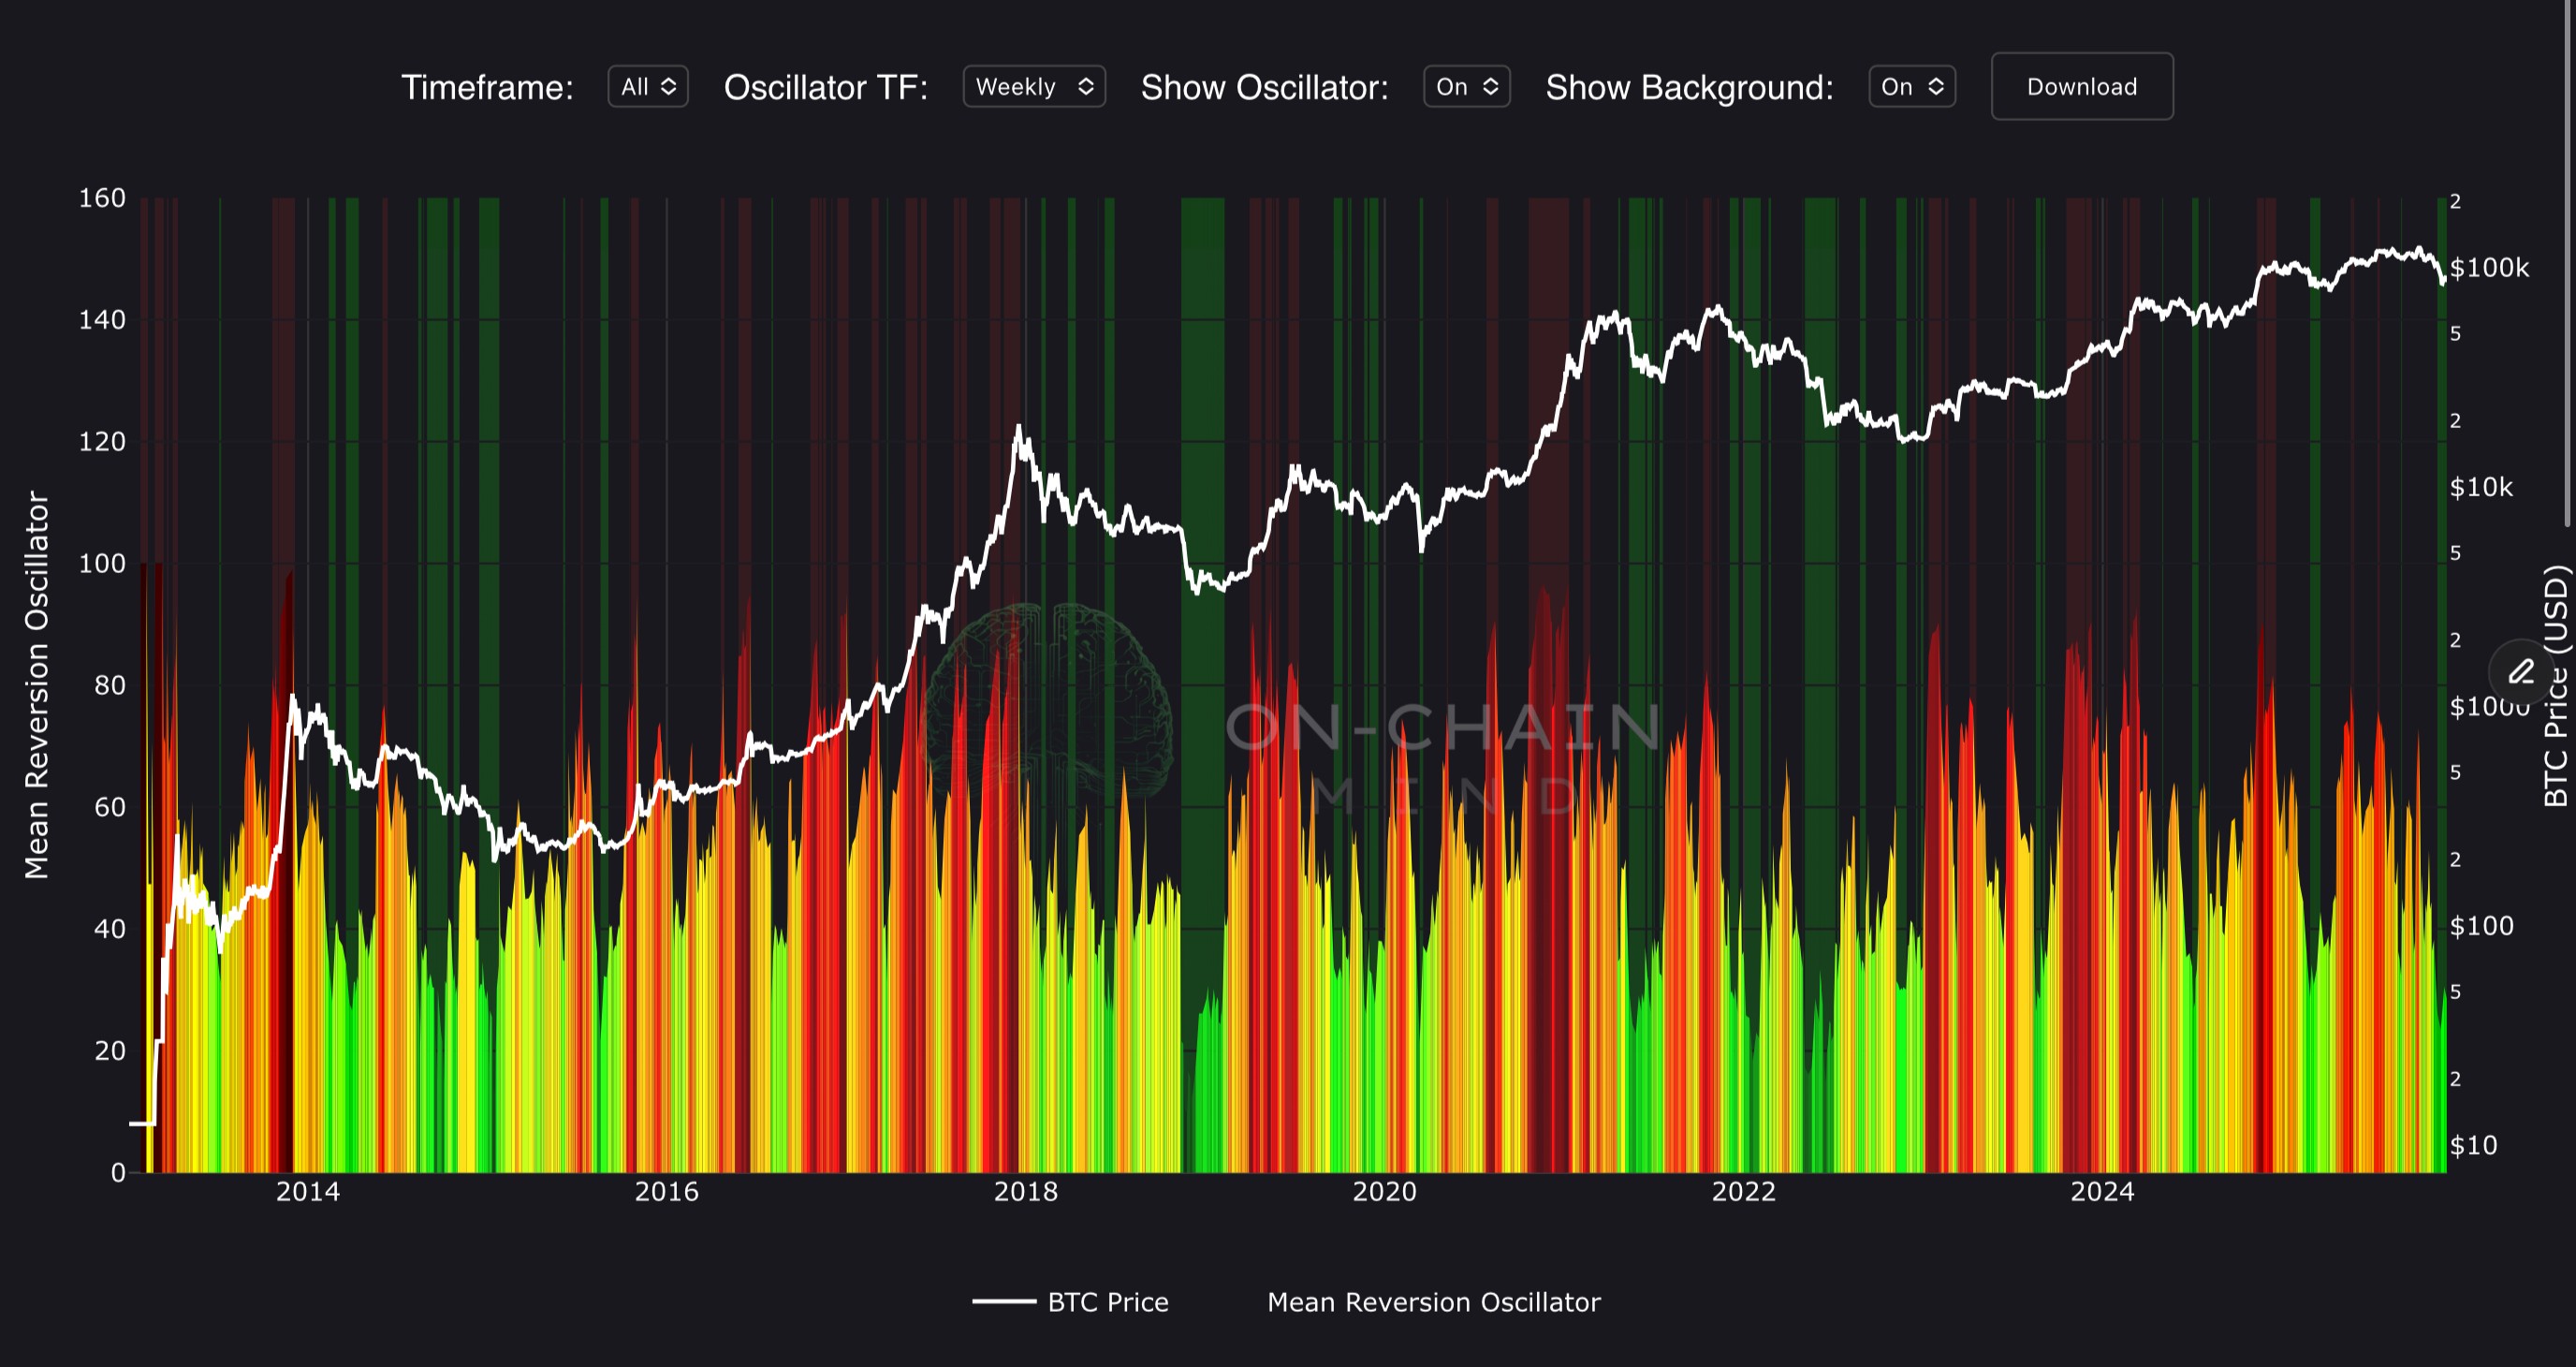
The Mean Reversion Oscillator (MRO) measures Bitcoin’s deviation from recent price trends using an RSI-based methodology applied to both weekly and monthly aggregated data. Normalised and colour-coded, it produces a dynamic oscillator curve that highlights overbought and oversold conditions, enabling traders to visualise mean-reversion opportunities. The indicator also features a background glow to emphasise extreme conditions, providing an intuitive view of market pressure. By combining MRO readings with Bitcoin’s price on a log scale, the indicator delivers a clear framework for anticipating potential trend reversals or consolidation phases.
How To Use
The MRO curve uses a colour gradient to communicate the strength of market deviation. Values approaching the upper extreme indicate overbought conditions (potential pullbacks), while lower values signal oversold conditions (potential rebounds). Weekly and monthly timeframes can be toggled to distinguish between short-term and macro-level cycles. The background glow further highlights these extremes: red zones mark overbought regions, green zones highlight oversold periods. Traders can use rising oscillator values to manage caution during peaks and focus on accumulation during low-value troughs, capturing opportunities in Bitcoin’s cyclical mean-reversion dynamics.