
Mining Revenue Volatility
onchainmind.io
© 2025 On-Chain Mind. All rights reserved.
Add to Favourites
Description:
Premium Indicator
Premium Indicator
Indicator Overview
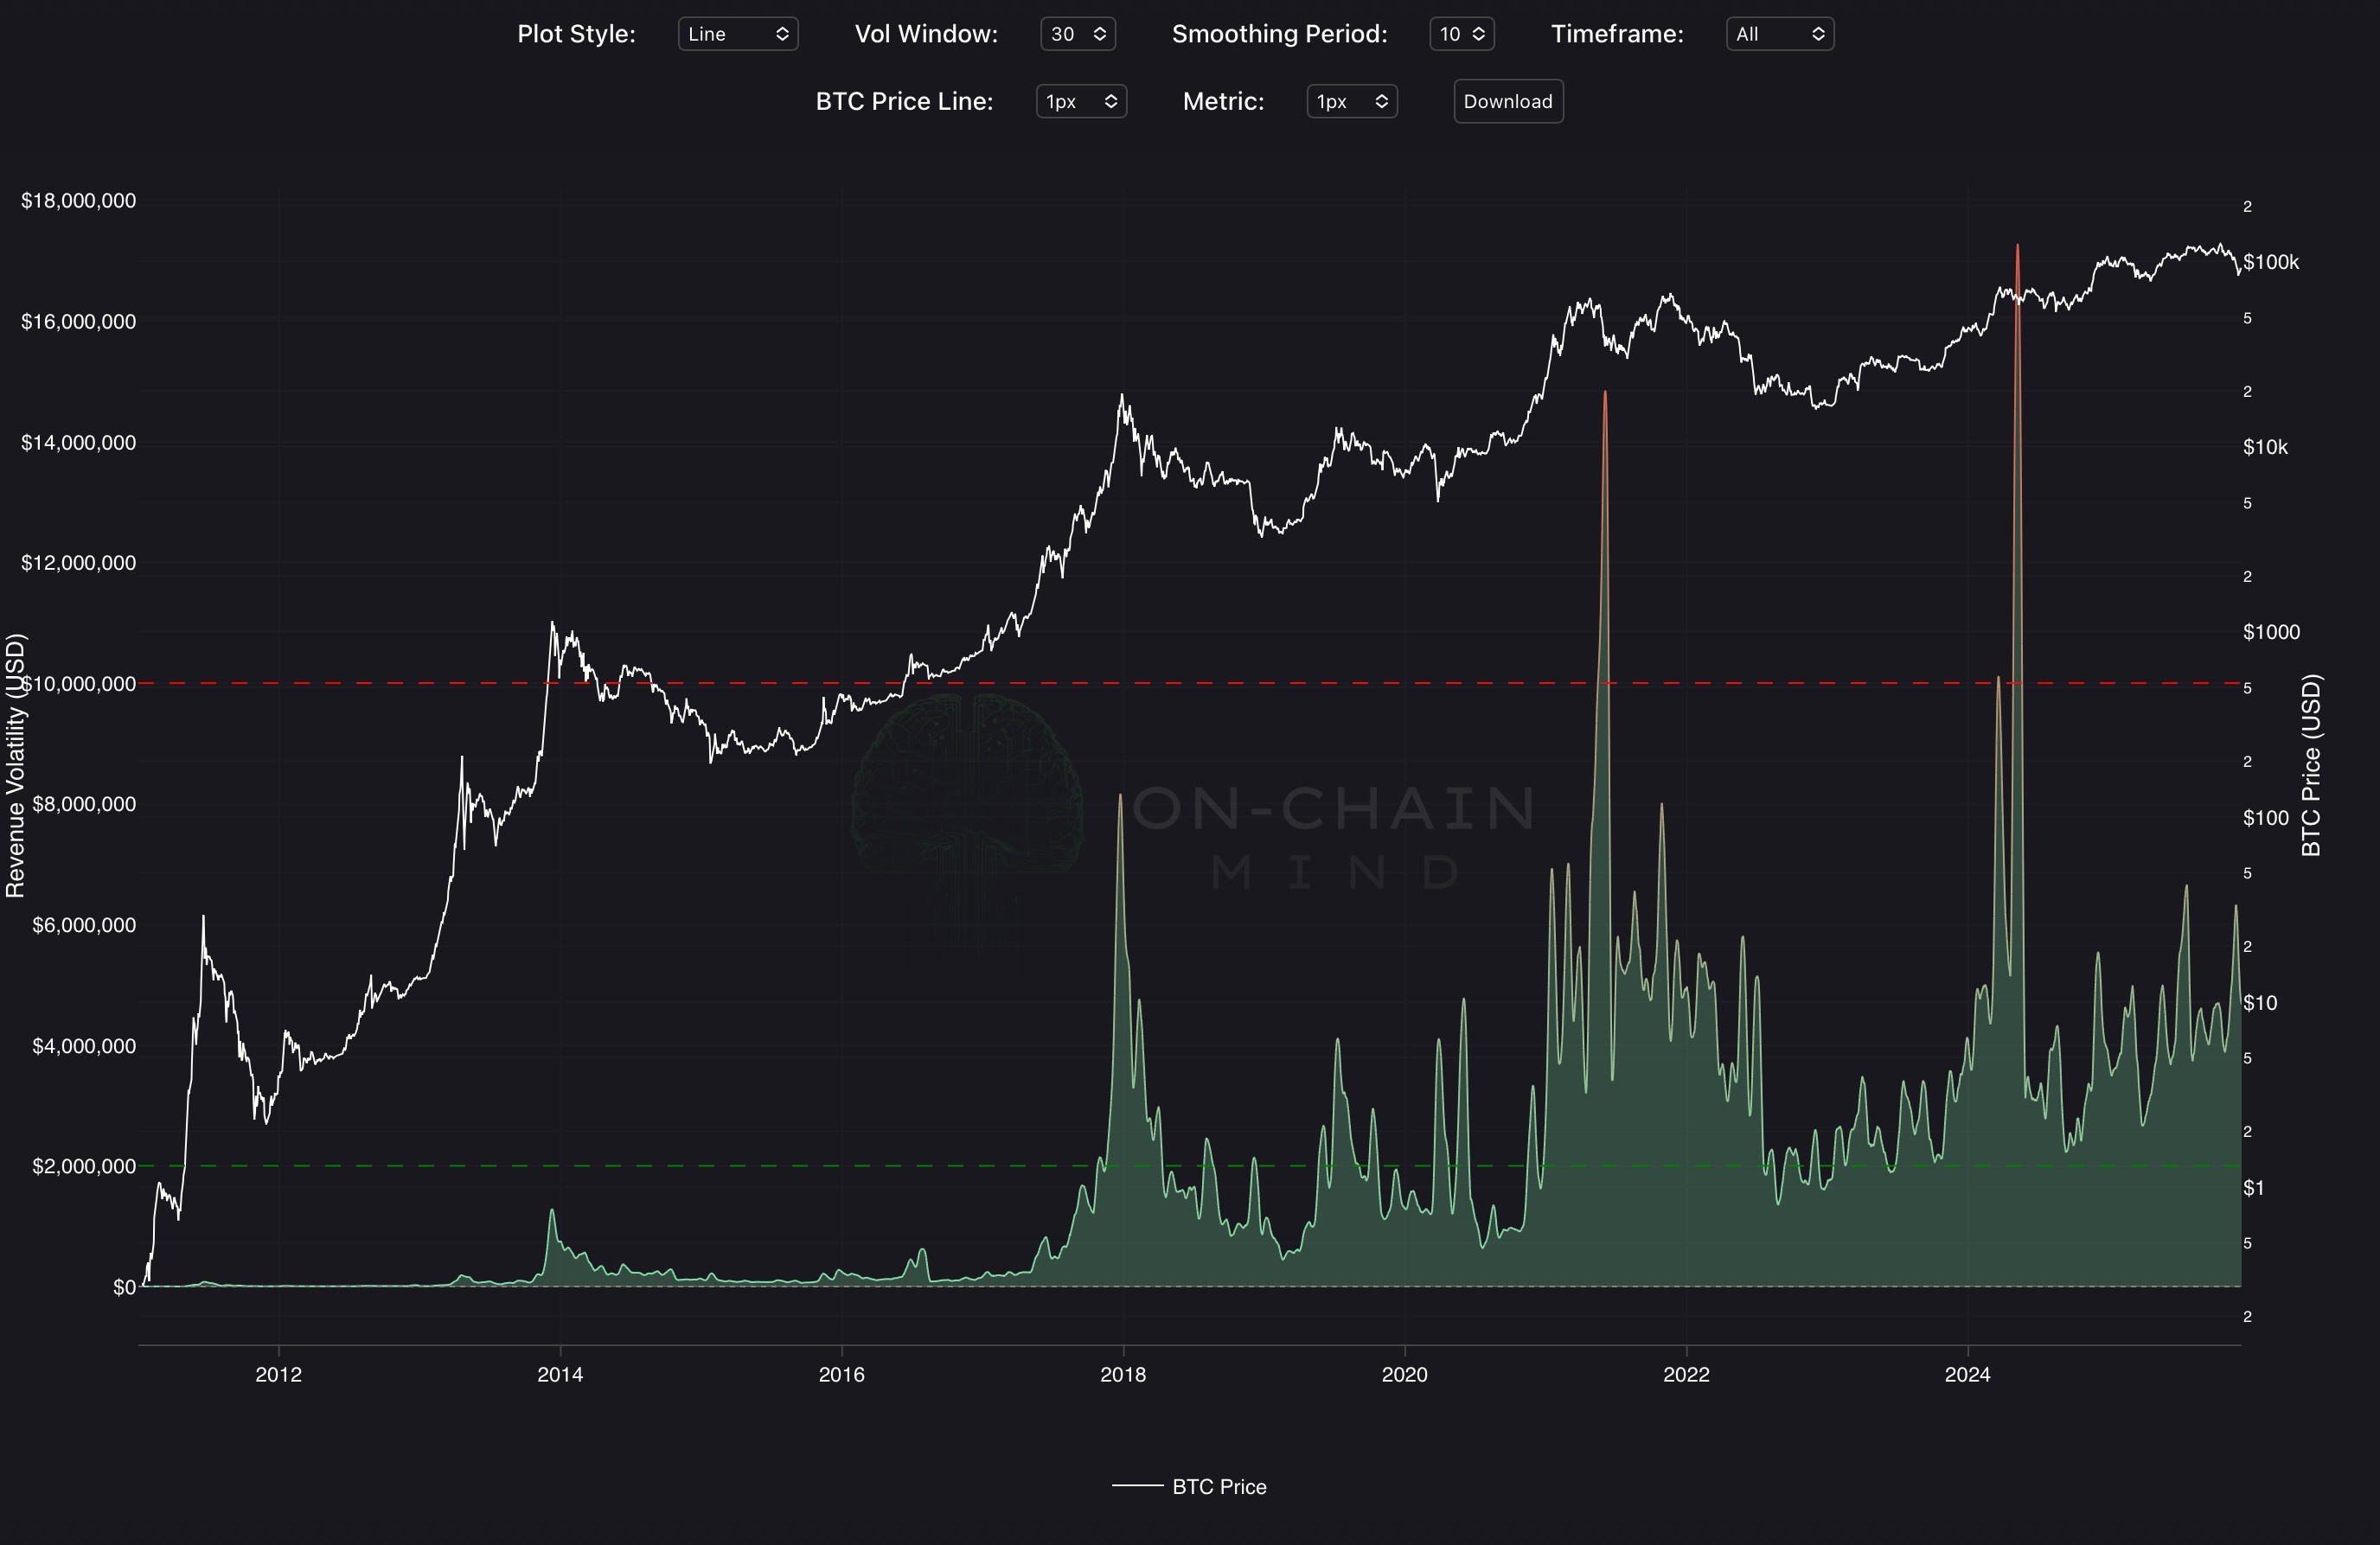
The Mining Revenue Volatility indicator measures the standard deviation of Bitcoin miners’ daily USD revenue over a user-selected window (15-100 days), then smooths the result with a secondary period (5-30 days). The output is displayed as a gradient line or column chart that shifts from extremely low volatility, revenue stability to extreme volatility spikes. Bitcoin price is overlaid on a secondary logarithmic axis in white, with optional smoothing overlays and unified hover showing exact volatility values.
How To Use
Deep red spikes signal explosive volatility in miner income and historically coincide with parabolic price advances, halving events, or sudden supply shocks, often marking the final stages of bull runs and ideal zones for caution or profit-taking. Deep green troughs reveal prolonged revenue stability and typically occur during consolidation phases, post-crash calm, or stealth accumulation periods, creating some of the lowest-risk windows for long-term positioning.
Price rallying while volatility remains low (green) suggests controlled, sustainable upside, while price weakness with rising volatility (shifting toward red) warns of distribution and increasing downside risk. Traders use sharp red spikes as sell or hedge signals, persistent green zones as accumulation opportunities, and the transition from green to red as early confirmation of regime change, making this one of the most effective tools for tracking miner income turbulence and identifying major turning points in Bitcoin’s price cycles.
Copyright © 2025 On-Chain Mind