
Monthly ETF Flows
onchainmind.io
© 2025 On-Chain Mind. All rights reserved.
Description:
Premium Indicator
Premium Indicator
Indicator Overview
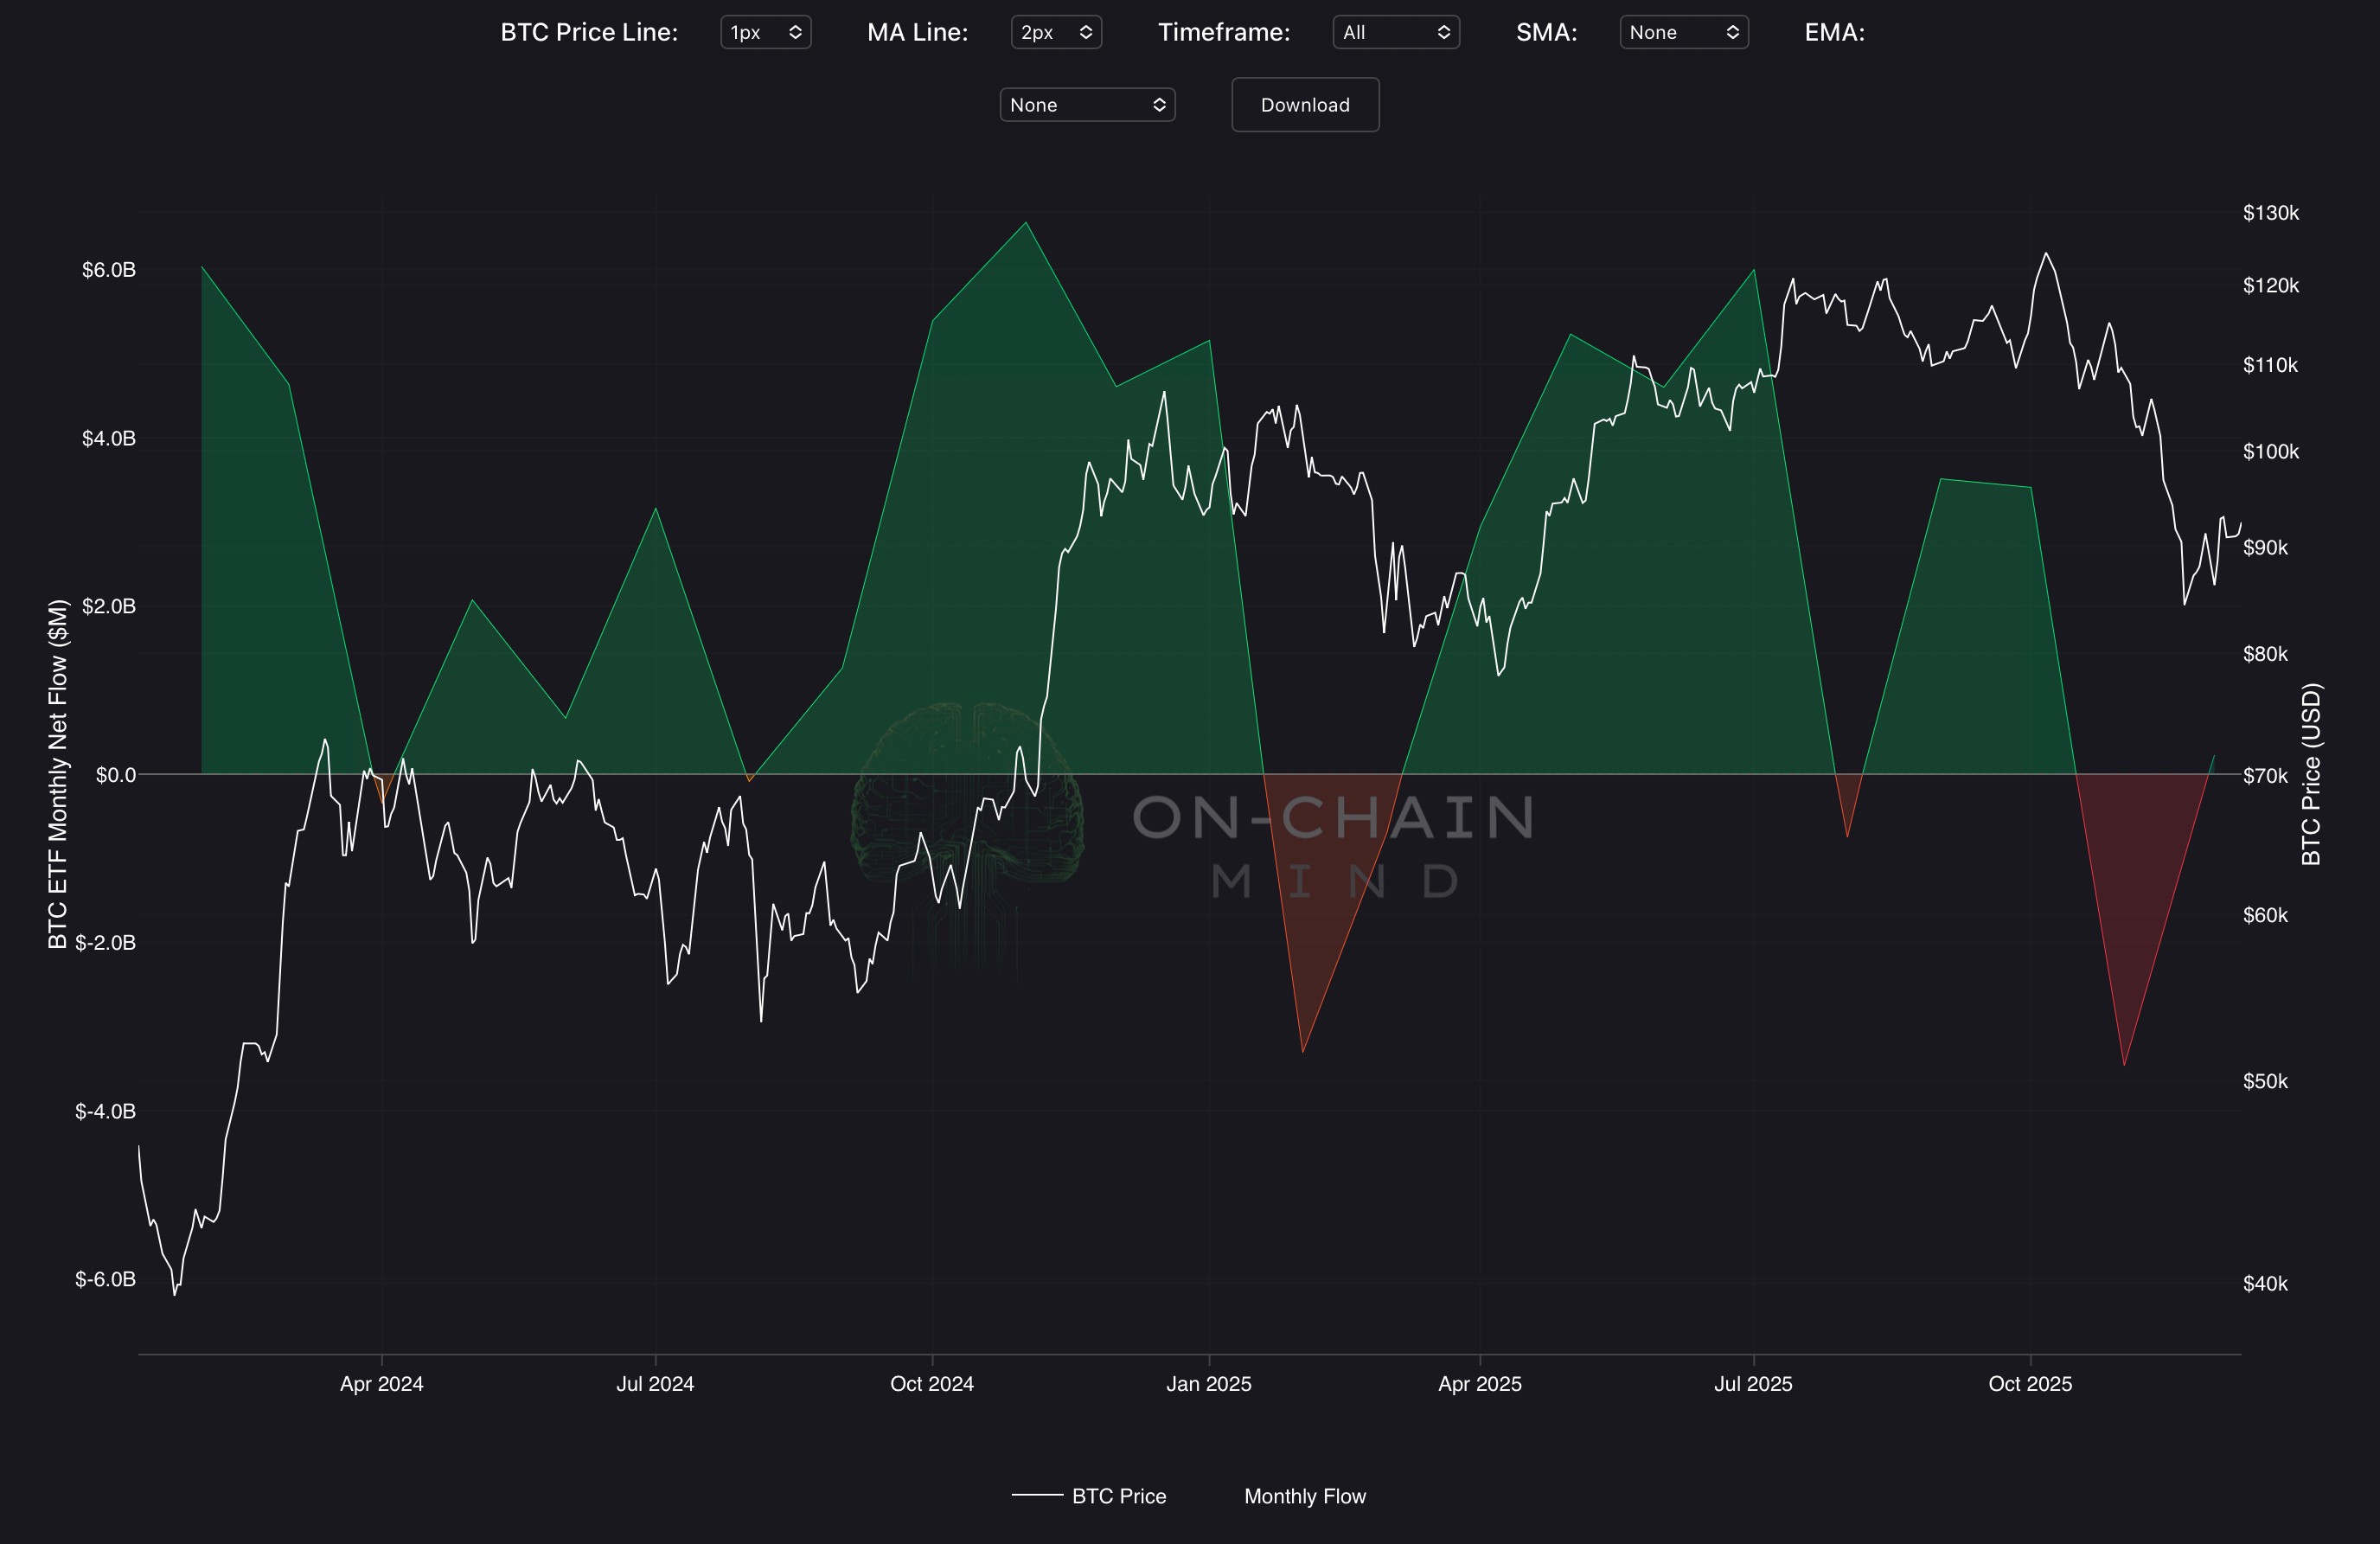
The Bitcoin ETF Monthly Net Flow indicator aggregates combined USD inflows and outflows across all major spot Bitcoin ETFs on a monthly basis, presented as a dynamic gradient area chart that shifts from red (monthly outflows) through to green (monthly inflows). Bitcoin price is overlaid on a secondary logarithmic axis in white, with optional SMA/EMA overlays and unified hover showing exact monthly USD amounts for both raw and smoothed flows.
How To Use
Green monthly bars signal overwhelming, sustained institutional demand and historically mark the most powerful phases of Bitcoin bull cycles, perfect for long-term positioning or adding aggressively. Deep red monthly bars reveal extreme redemption waves or panic selling and typically coincide with final capitulation, creating the strongest generational accumulation opportunities since ETF inception.
Traders treat vivid green months as decisive bull-market confirmation, deep red months as once-in-a-cycle buy signals, and the zero line as the ultimate arbiter of institutional conviction, making Monthly ETF Net Flow the cleanest, highest-signal measure of regulated capital commitment to Bitcoin.
Copyright © 2025 On-Chain Mind