
MSTR Cost Bands
onchainmind.io
© 2025 On-Chain Mind. All rights reserved.
Description:
Premium Indicator
Premium Indicator
Indicator Overview
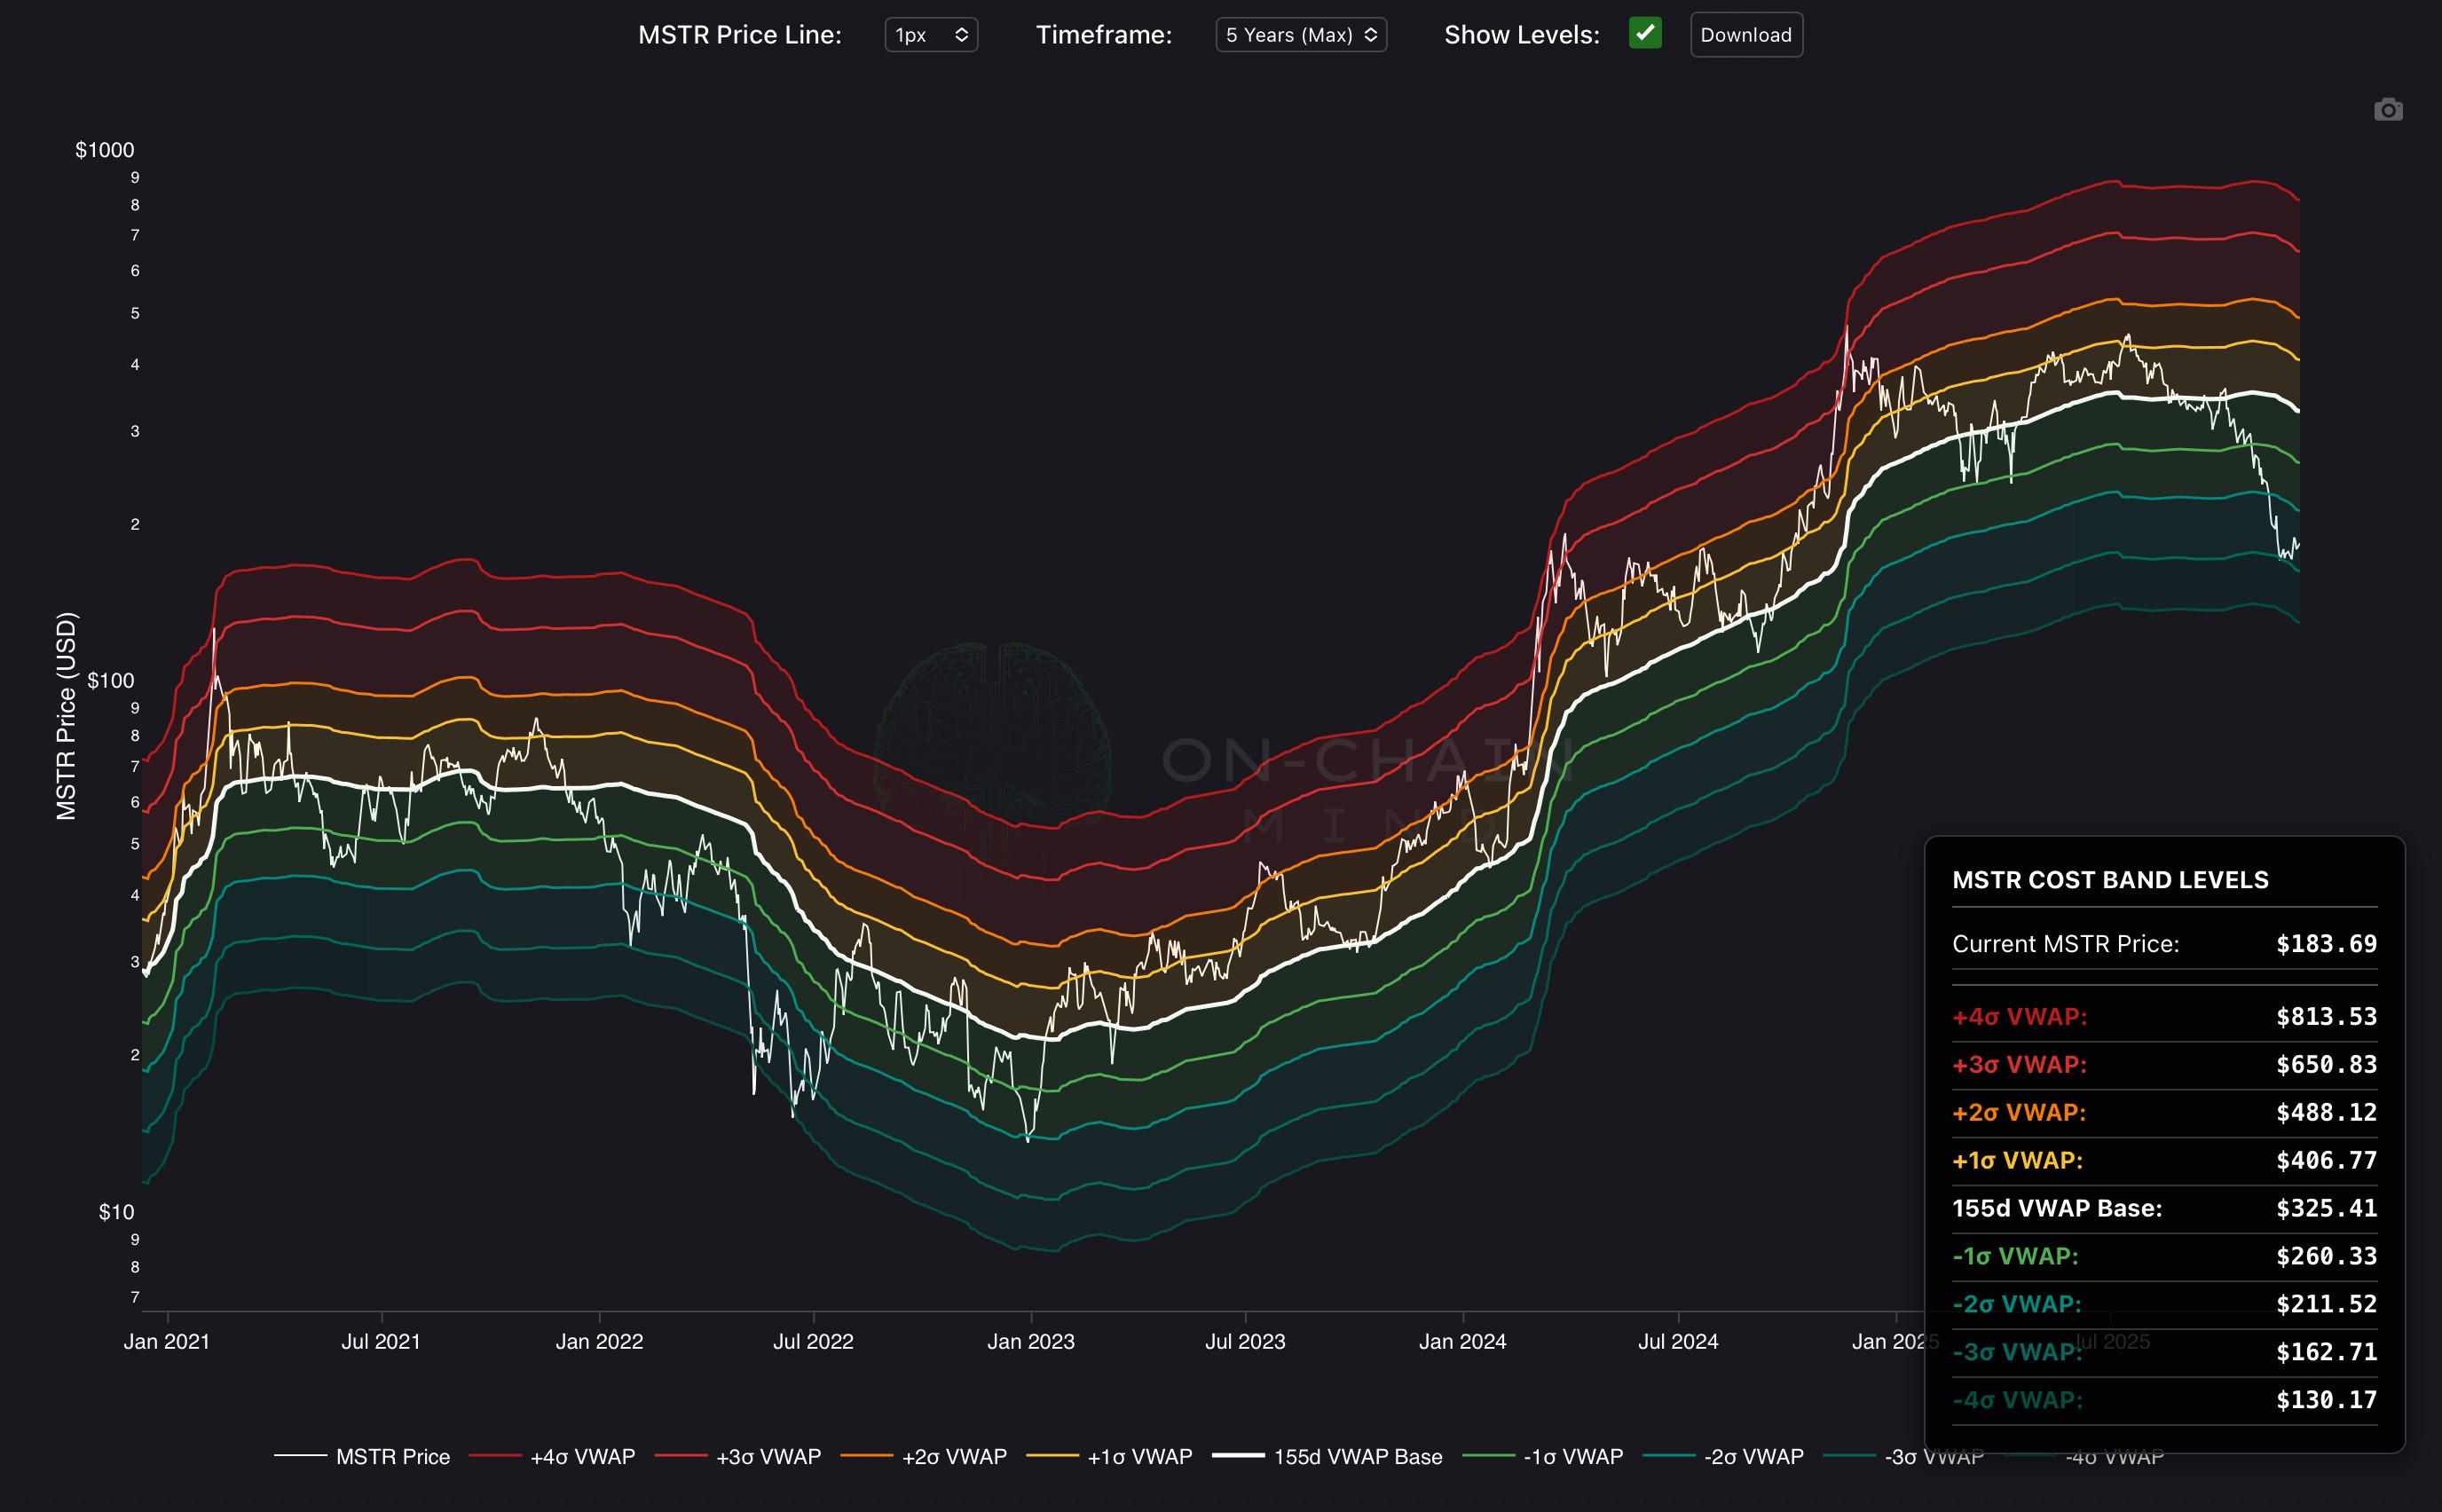
The MSTR Cost Bands indicator simulates the short-term holder cost basis for Strategy by using a synthetic positioning model that reconstructs recent participant entry levels from rolling, liquidity-weighted price dynamics. The algorithm derives a dominant cost anchor by aggregating price action over a fixed temporal window with adaptive weighting, then applies a normalised volatility transform to generate multi-sigma deviation envelopes around this anchor. These statistically bounded regimes quantify relative premium and discount states versus inferred recent cost distribution, with band spacing dynamically adjusting to changes in realised variance.
MSTR’s share price is overlaid on a logarithmic axis for context, with an info panel showing current band levels, enabling visual assessment of premium/discount relative to recent corporate cost basis in this Bitcoin-leveraged equity.
How To Use
Premiums significantly above the baseline (e.g., crossing +2σ orange or +3σ red bands) signal overextension, potential exhaustion from speculative buying, or inflated valuations during hype cycles, often warranting caution or profit-taking, while deep discounts below the basline (e.g., into -2σ teal or -3σ deep teal bands) indicate undervaluation, capitulation zones, or attractive entry points amid fear or dilution concerns. Divergences, such as MSTR price surging while remaining within upper bands, warn of unsustainable momentum and reversal risk, whereas price weakness testing lower bands suggests building support and potential rebounds. Traders monitor breaks above upper bands for confirmation of bullish euphoria or drops below lower bands as signals of bearish pressure, supporting precise timing of entries, exits, and arbitrage between MSTR shares and Bitcoin exposure in this highly correlated asset.