
MSTR Traded Volume
onchainmind.io
© 2025 On-Chain Mind. All rights reserved.
Description:
Premium Indicator
Premium Indicator
Indicator Overview
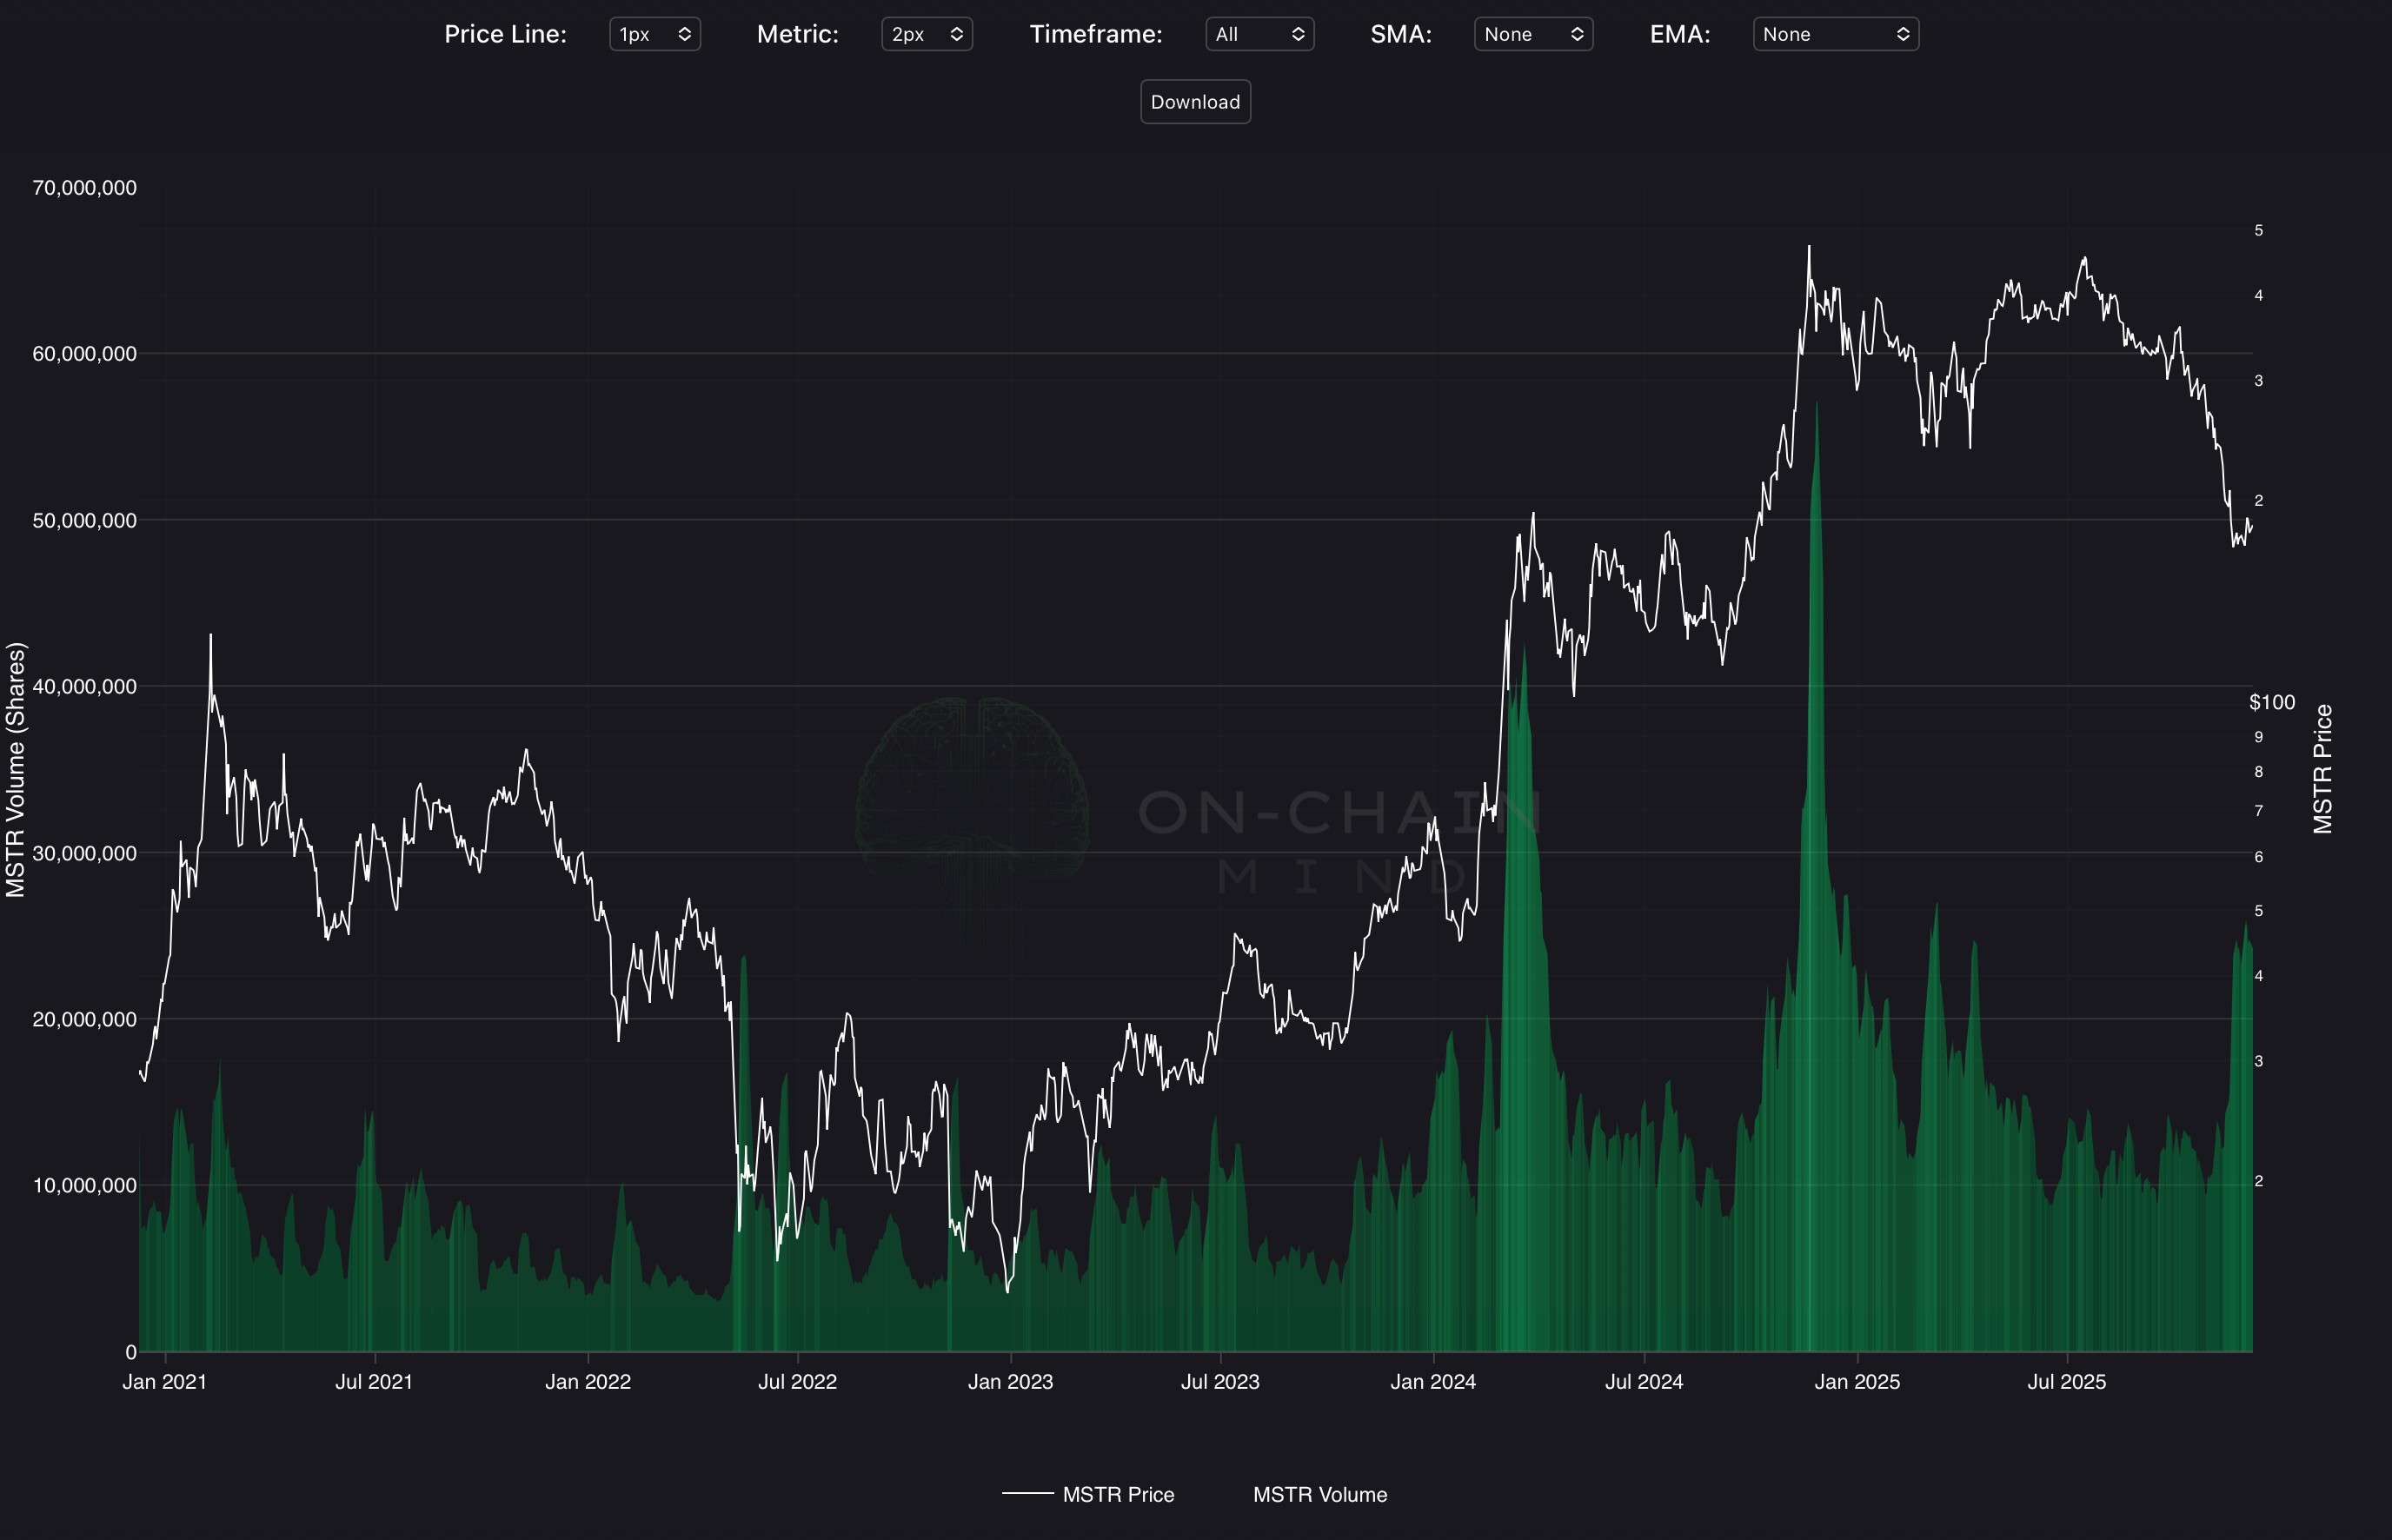
The MSTR Traded Volume indicator displays Strategy’s daily share volume as a filled area chart on the primary axis that ranges from deep green (low volume) to bright green (extreme volume). MSTR’s price is overlaid on a secondary logarithmic axis in white for context, with optional SMA/EMA overlays on volume and unified hover showing both price and exact share volume. This creates an immediate visual read of participation intensity, essential for interpreting the strength behind price moves in this highly volatile, Bitcoin-leveraged equity.
How To Use
Extreme green spikes signal explosive participation, typically coinciding with major Bitcoin purchase announcements, debt raises, premium surges, or short squeezes, confirming conviction and often marking the peak of bullish momentum. Dark green troughs indicate volume drought and disinterest, frequently seen during consolidation or premium compression, creating stealth accumulation windows before the next leg up. Divergences are especially powerful: price making new highs on fading volume warns of distribution and impending pullbacks, while price weakness on rising volume suggests forced selling or capitulation and high-probability rebounds. Traders use volume spikes above recent averages as confirmation for entries on breakouts or exits on exhaustion, while persistent low volume during sideways action signals low-risk accumulation zones. The indicator is indispensable for separating noise from real conviction in MSTR’s announcement-driven, high-beta price action.
Copyright © 2025 On-Chain Mind