
Power Law DCA Drawdown
onchainmind.io
© 2025 On-Chain Mind. All rights reserved.
Description:
Premium Indicator
Premium Indicator
Indicator Overview
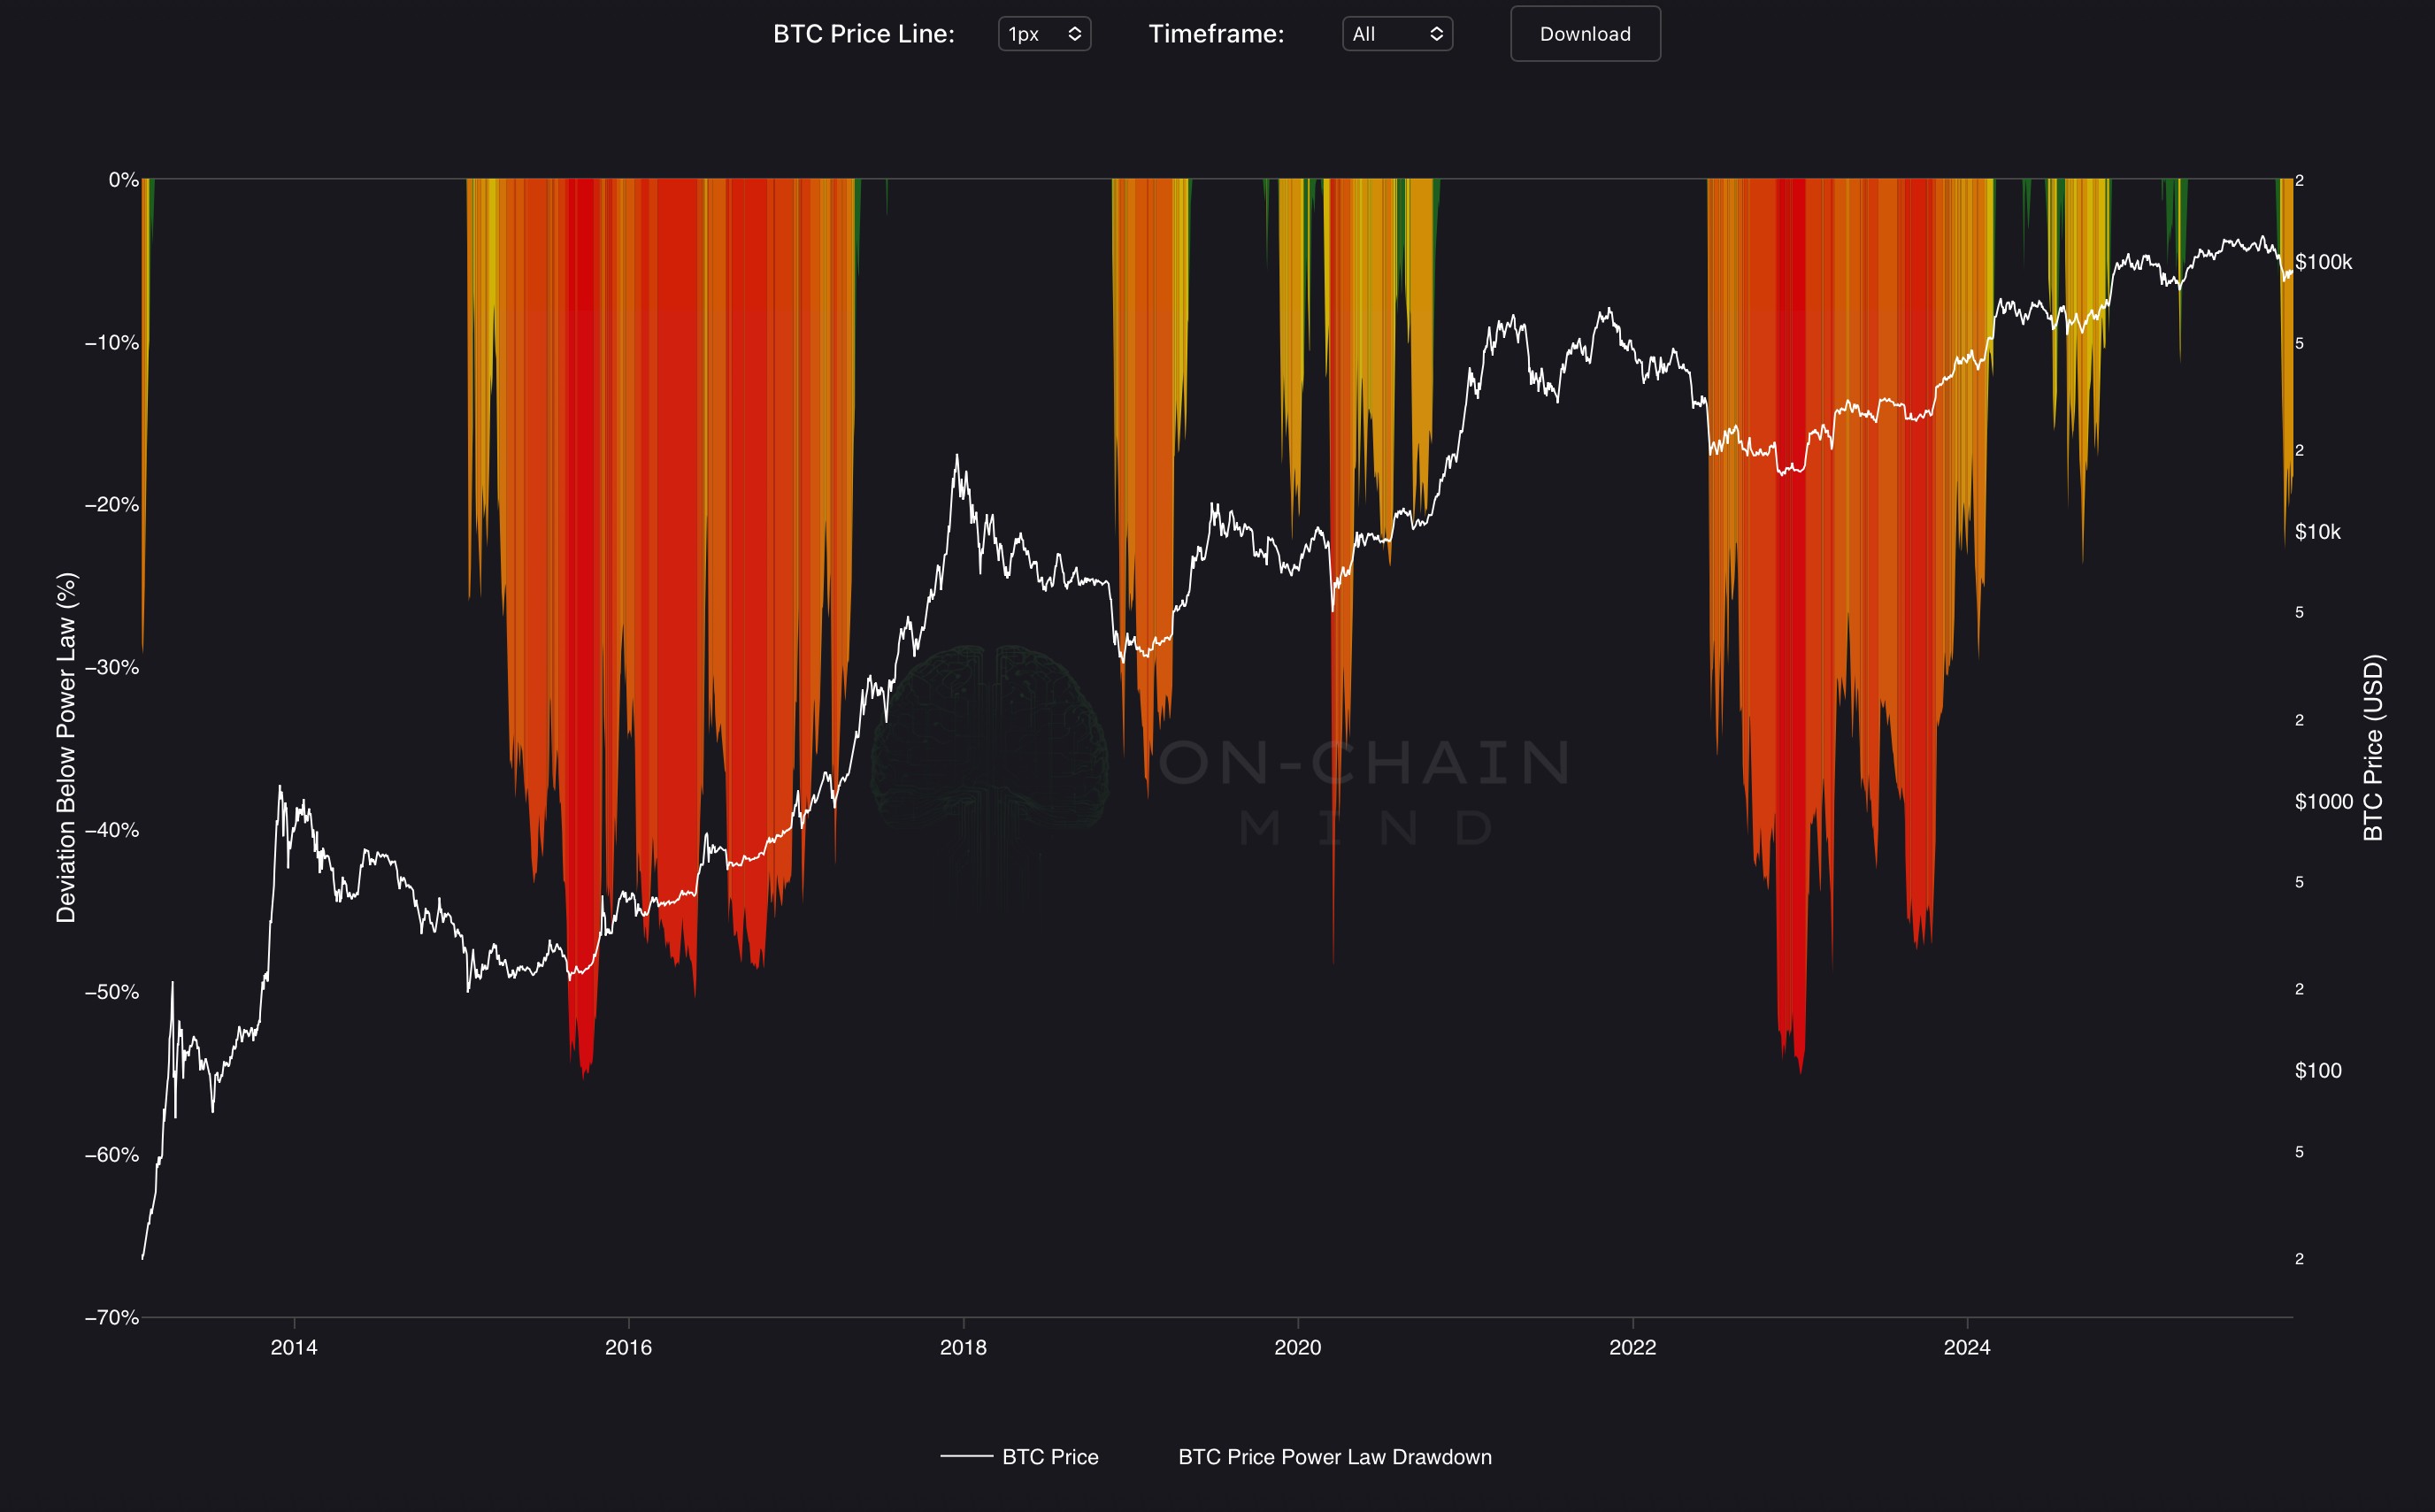
The Bitcoin Power Law Drawdown indicator measures Bitcoin’s price deviation below the long-term power-law centre line (the fitted trend since genesis), expressed as a percentage drawdown clamped at 0% (price at or above trend equals zero deviation). The result is displayed as a filled area chart on a linear scale from 0% to -70%, with a gradient from neutral (price on trend) to deep red (maximum drawdown).
How To Use
Deep red plunges below -40% signal extreme undervaluation relative to the power-law adoption trend and historically mark the strongest generational buying zones. White or near-zero readings indicate price alignment with the long-term trend, while any positive deviation is clamped at zero to focus solely on drawdown opportunities.
Traders monitor vivid red spikes as rare, high-conviction DCA signals (the deeper the red, the stronger the historical forward returns), persistent white zones as neutral trend-following periods, and the transition from red to white as confirmation of new bull cycles. This makes Power Law Drawdown one of the most powerful DCA tools available, lighting up precisely when Bitcoin is cheapest relative to its structural adoption curve.