
Short-Term Risk Score
onchainmind.io
© 2025 On-Chain Mind. All rights reserved.
Description:
Premium Indicator
Premium Indicator
Indicator Overview
The Short-Term Risk Score indicator is a composite on-chain metric that aggregates 8 normalised sub-components, including:
Short-Term Holder MVRV (Market Value to Realised Value ratio for recent holders, highlights unrealised profit and loss among the most speculative participants.)
Short-Term Holder SOPR (Spent Output Profit Ratio for coins moved within 155 days, indicates profit-taking pressure among newer holders.)
Microstructural Risk (Combines recent drawdown from 90-day low, ATR-based volatility buffer, and bullish/bearish cycle adjustment.)
30/60 Ratio Vector (Measures short-term momentum relative to intermediate trend, fast/slow EMA ratio deviation.)
30-day Sharpe Ratio (Risk-adjusted return using log returns, excess over near-zero risk-free rate.)
Velocity RSI (A momentum oscillator capturing the speed and direction of price ranges.)
Mayer Multiple (Price relative to 200-day SMA, classic long-term overextension gauge.)
MVRV Monthly Delta (Rate of change in overall MVRV over the prior 30 days, annualised, captures shifting valuation momentum.)
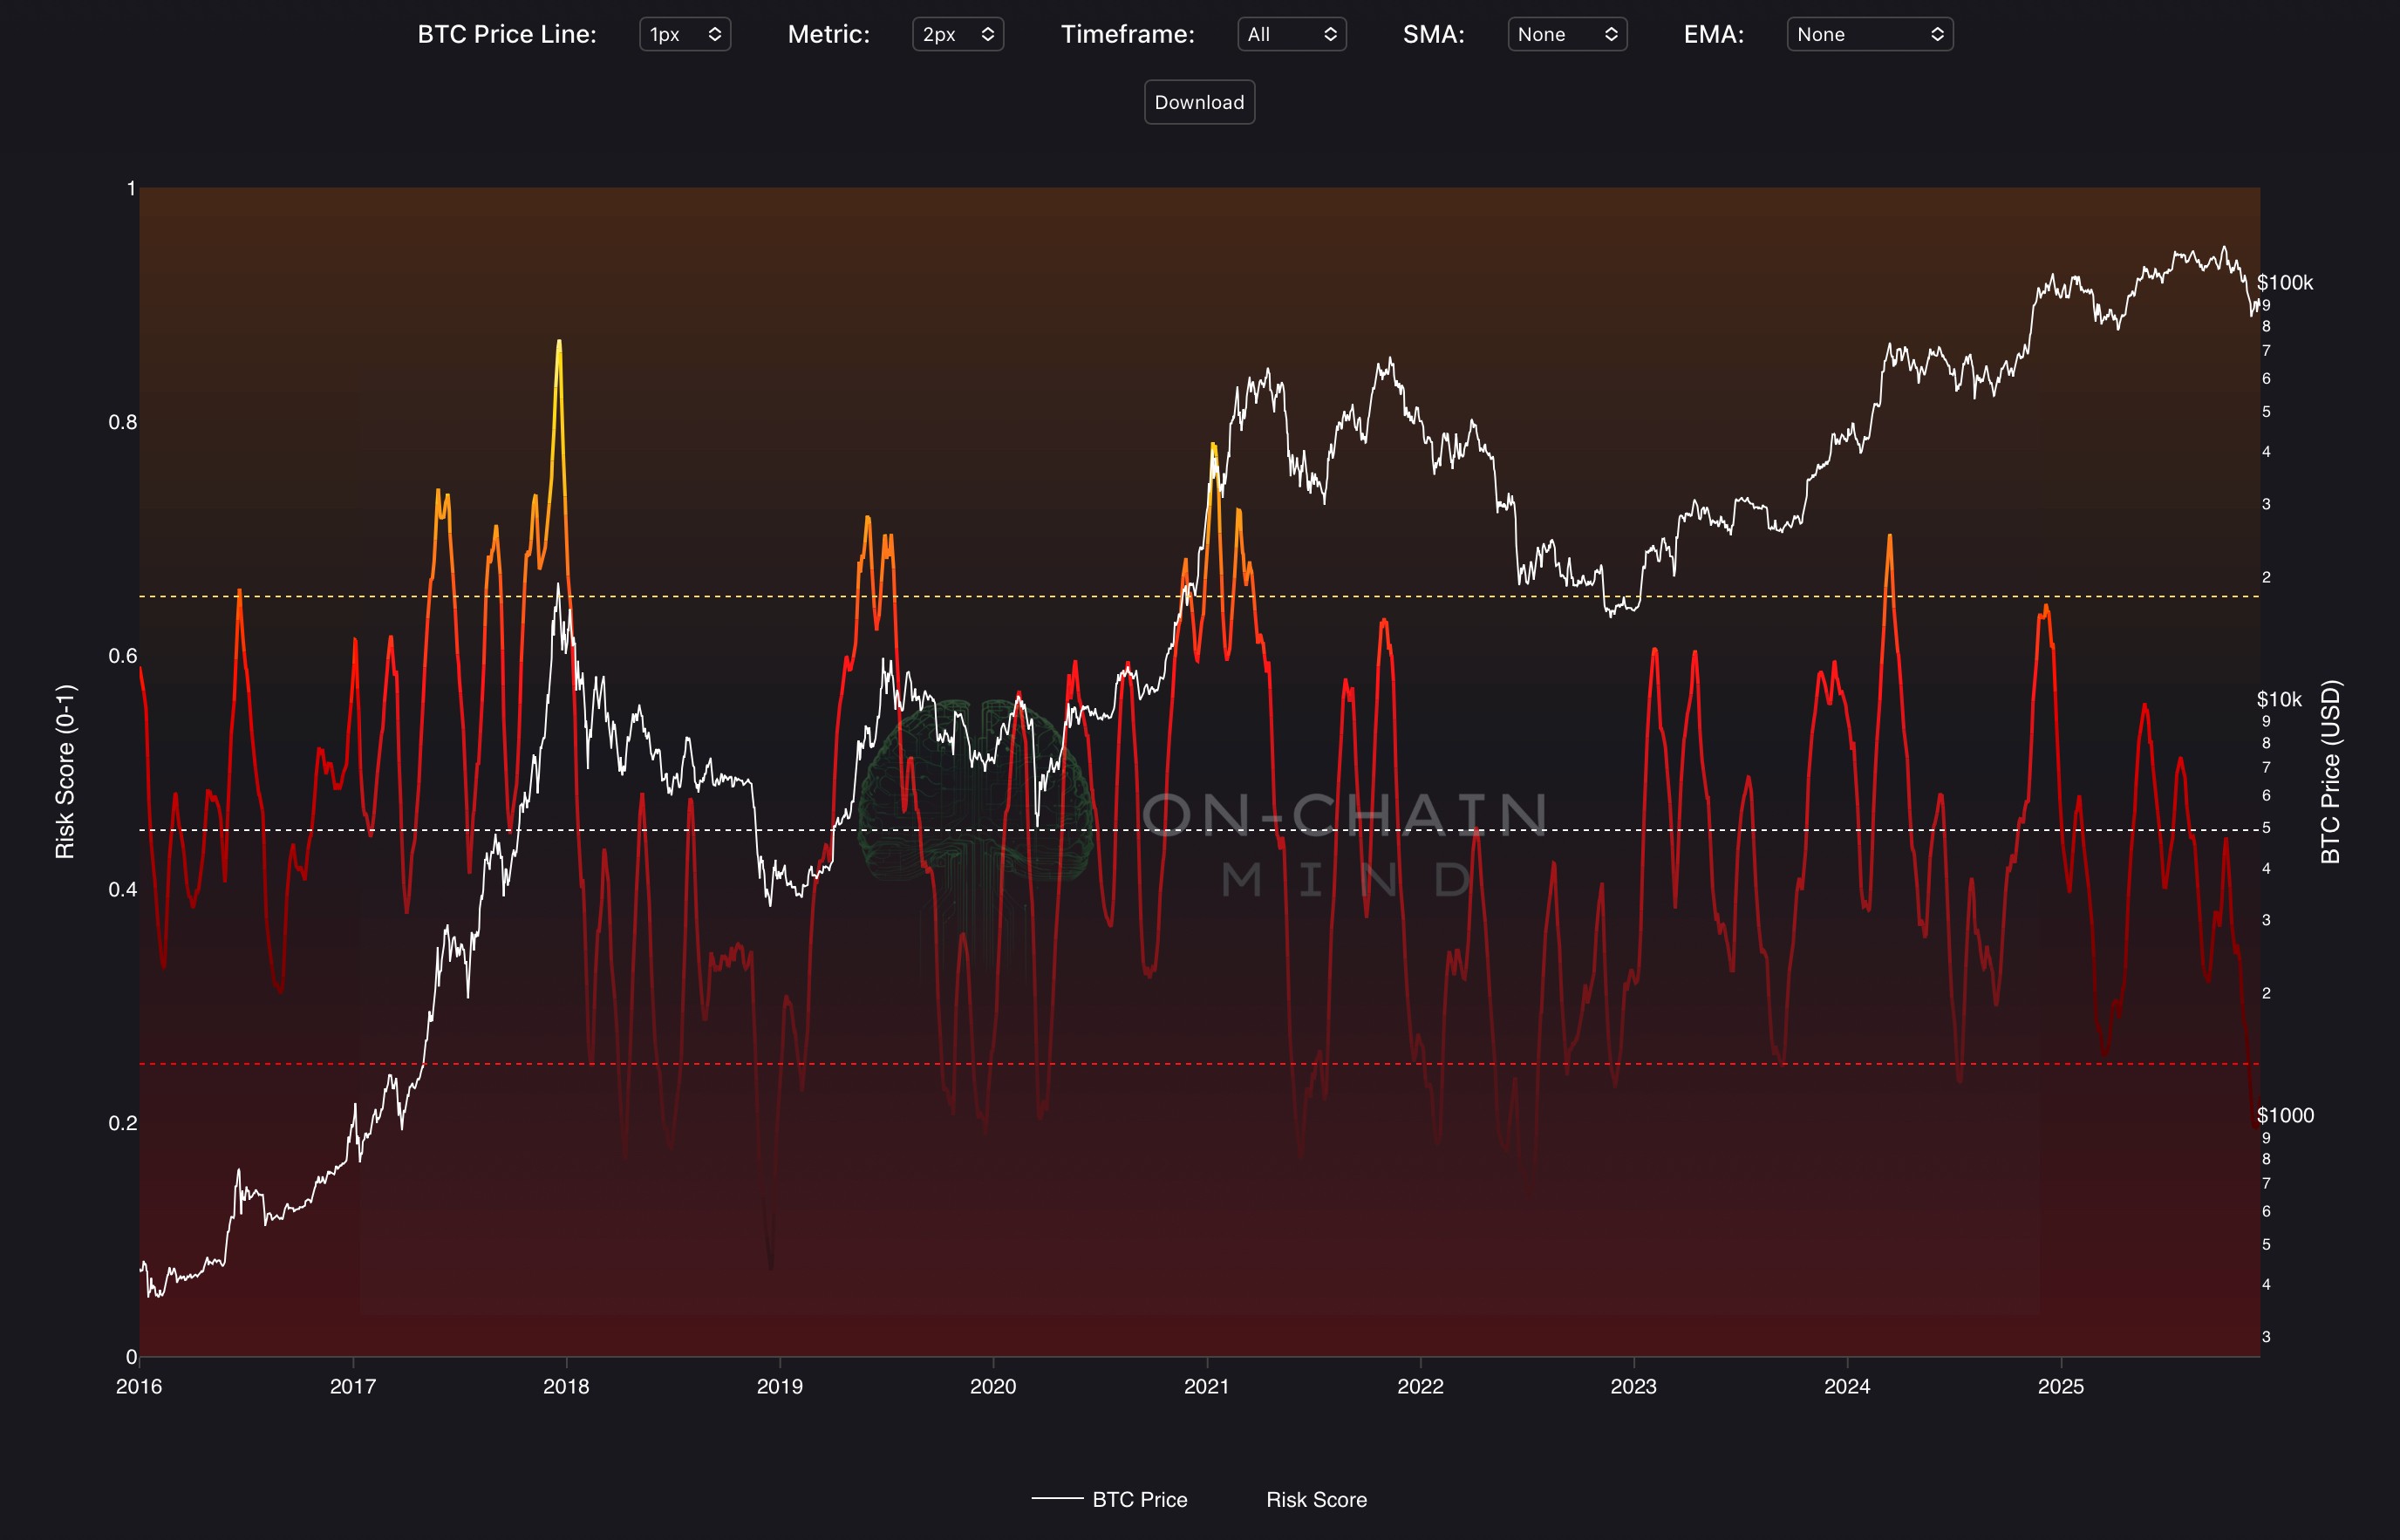
The final composite blends short-term speculative behaviour (STH metrics, Sharpe, velocity) with microstructural and valuation signals to produce a responsive yet robust short-term risk gauge. The line is rendered with a continuous red-to-yellow gradient (dark red at low values intensifying through orange to bright yellow at maximum short-term risk).
How To Use
Low and declining scores (especially below the red line) signal reduced short-term risk, often coinciding with capitulation, attractive accumulation zones, and favourable entry conditions as speculative pressure eases, while high and rising scores (above the yellow line) indicate elevated risk from overvalued short-term holders, profit-taking momentum, and potential exhaustion or impending corrections. Divergences, such as Bitcoin price advancing sharply while the risk score climbs into high territory, warn of unsustainable rallies and increasing reversal probability, whereas price weakness accompanied by a falling risk score suggests diminishing downside pressure and improving conditions for recovery. Traders monitor crosses below the red line for low-risk buying opportunities, sustained readings above yellow line as cautionary signals for profit-taking or hedging, and transitions across the 0.5 midline for shifts in short-term regime sentiment, aiding precise risk-adjusted timing of entries, exits, and position management in Bitcoin markets.