

ON-CHAIN METRIC
Days of Issuance Bought
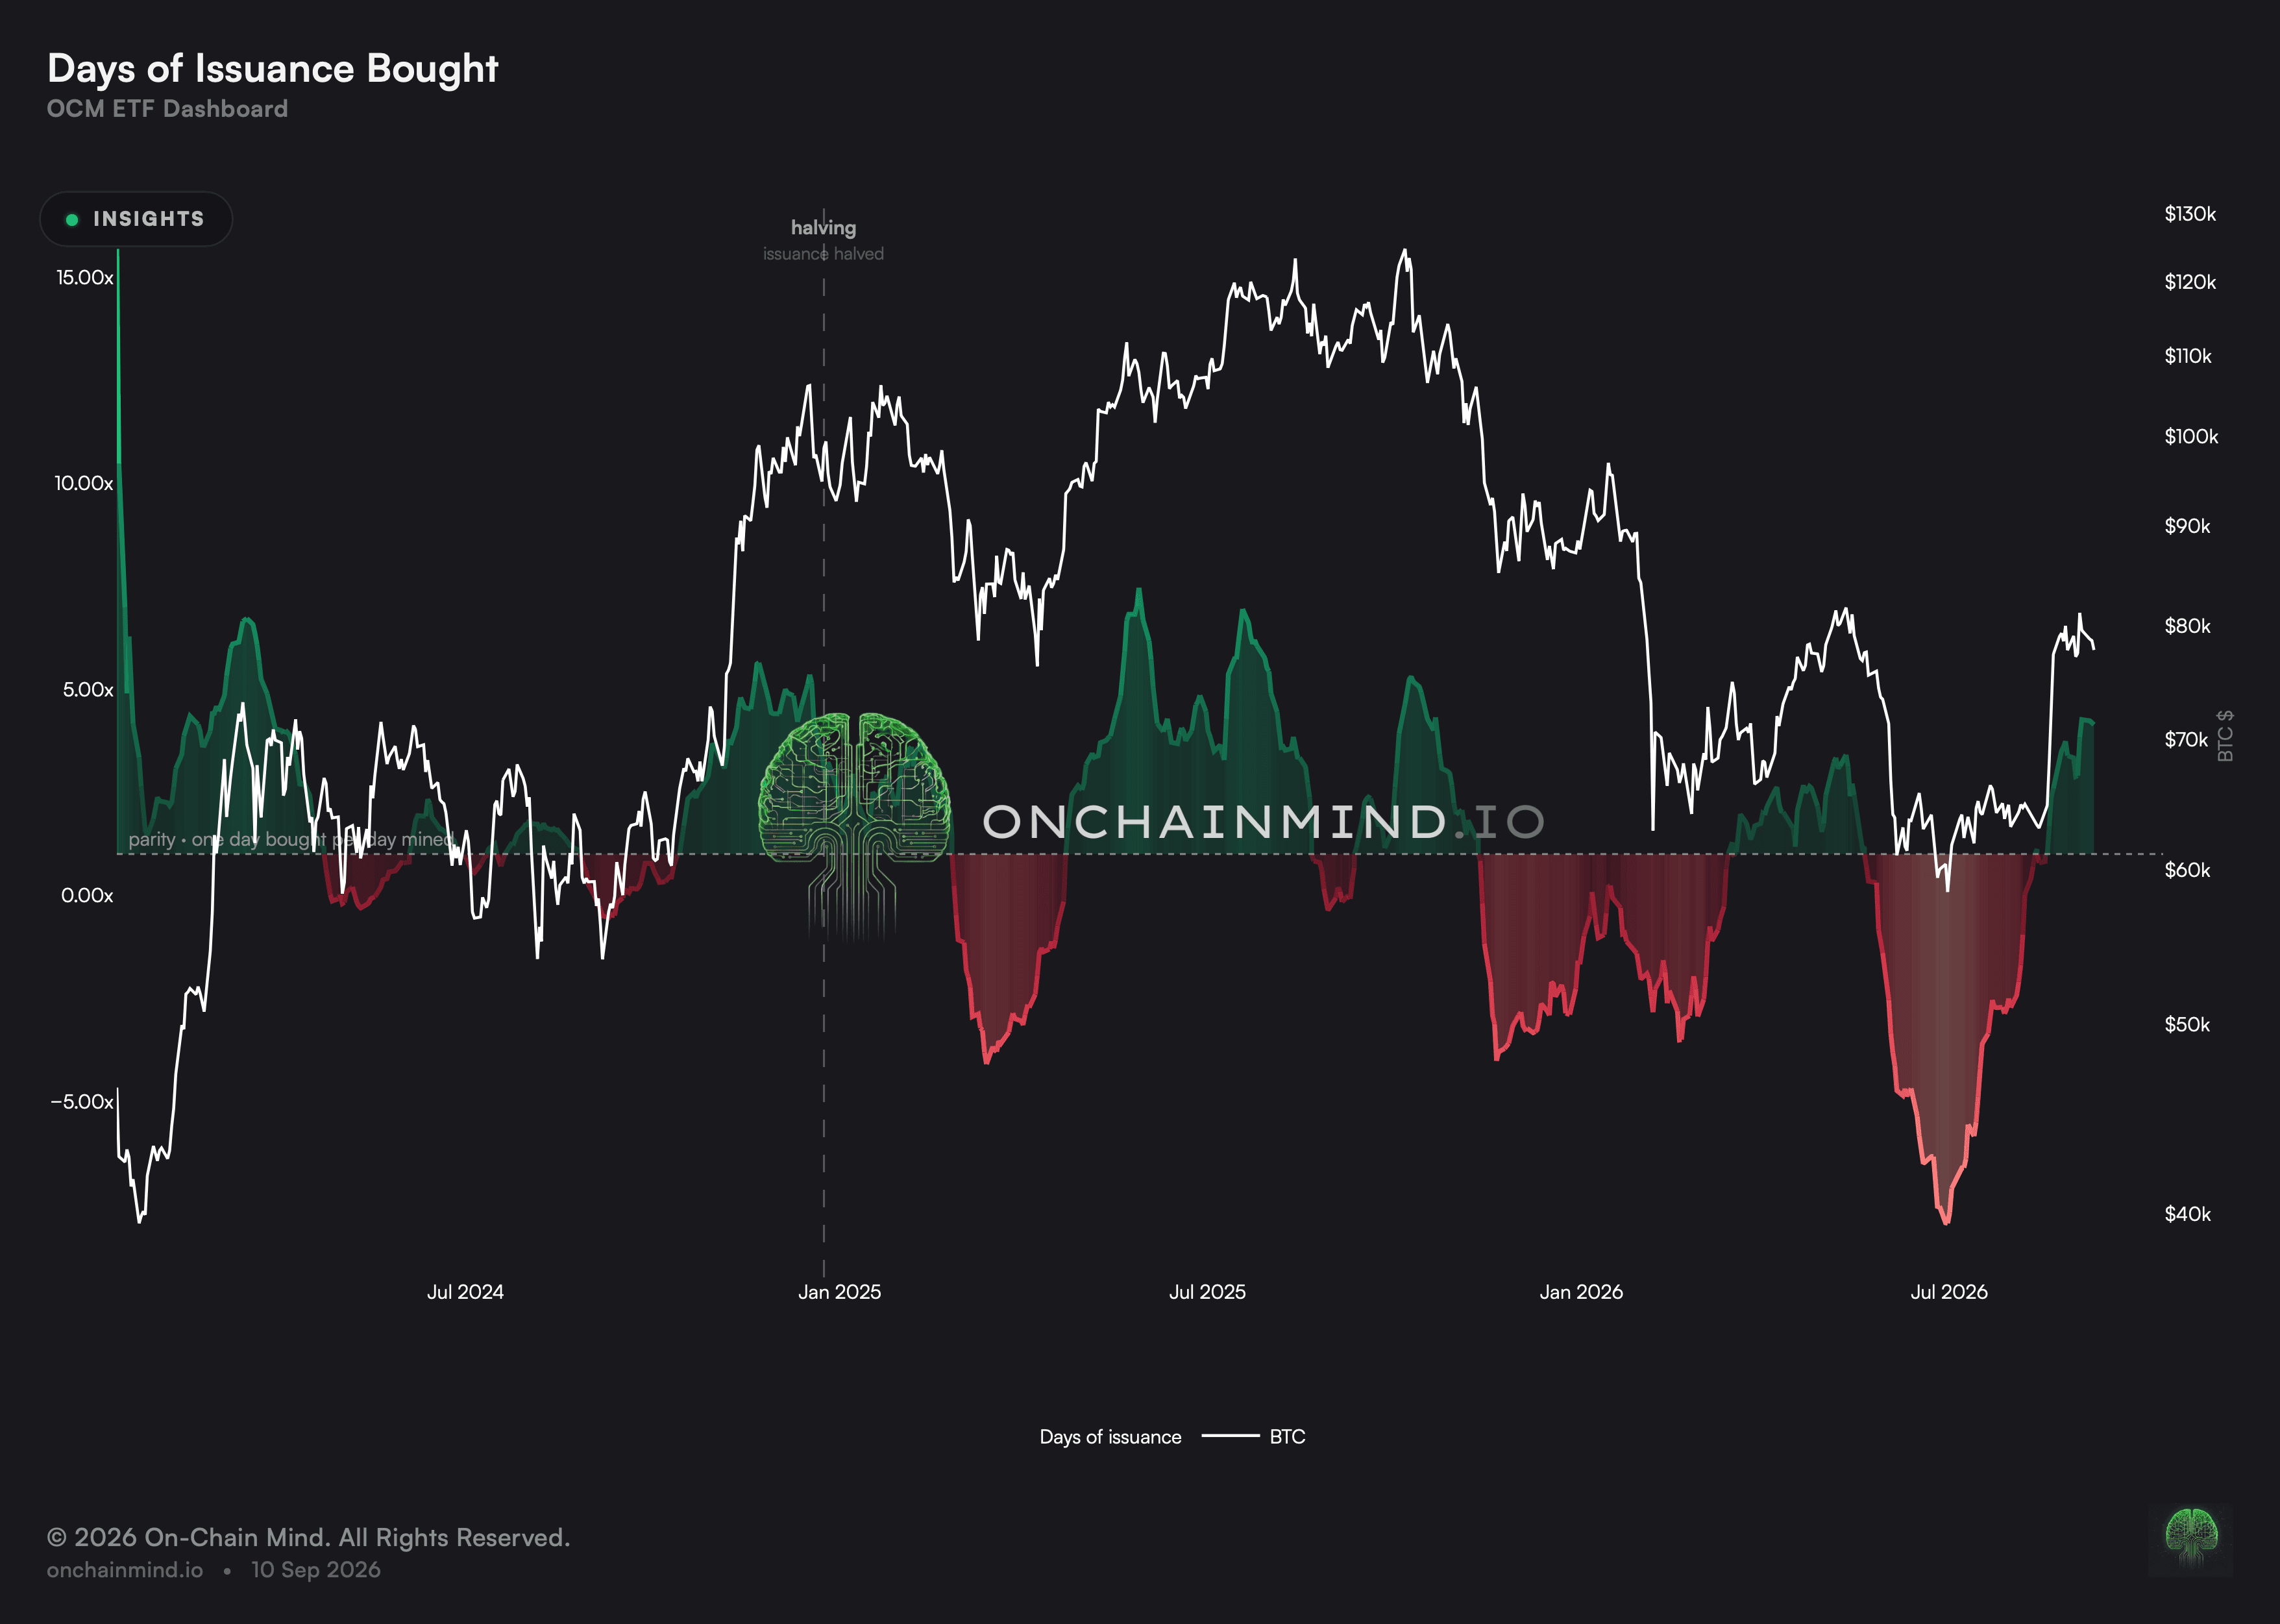
Fund buying set against the new coin created that day, on a scale where one is parity.
Open the ETF dashboard
New coin arrives at a known and published rate. Setting fund buying against that rate turns an abstract quantity of money into something concrete: how much of the day’s new supply these particular funds took for themselves.
Above parity the funds alone took more than the whole day’s new issuance, which means every other buyer that day was supplied from coin that already existed rather than from anything newly created.
What it actually measures
Parity is a meaningful line here rather than an arbitrary one. It marks the exact point at which a single group of buyers absorbed the entire day’s new supply on its own.
Readings above that line do not mean the market ran short of anything. Existing holders sell continuously, and their coin supplies every other buyer without any shortage arising.
The reading is volatile from day to day because fund buying is volatile while issuance is nearly constant. Several days together are the smallest unit worth reading.
Sustained readings above parity are the notable case rather than individual ones. A single day above the line happens routinely and a month of them does not.
Absorbing issuance is not the same as a shortage
The dramatic reading of this view is that funds buying more than the daily issuance must eventually exhaust the available supply. It is an intuitive conclusion and it does not follow from anything on the chart.
The overwhelming majority of coin in existence was mined long ago and can be sold at any time. New issuance is a small stream beside that stock, and a buyer absorbing all of it has done something notable without having made anything scarce.
What it does not tell you
It compares one group of buyers against the entire day’s new supply, which is a deliberately lopsided comparison and produces a correspondingly dramatic figure.
Issuance is nearly constant, so almost all of the movement in the reading comes from the flow side.
It ignores every other source of coin reaching the market, which is the overwhelming majority of what actually gets traded.
The issuance schedule steps down at fixed intervals, so an identical amount of buying produces a higher reading after each one.
It looks at one day at a time while allocation decisions are made over weeks, which is why single readings mislead so readily.
How to read it
Above issuance. The funds alone took more than the day’s entire new supply.
Below issuance. The funds took less than the day’s new supply.
Open the ETF dashboard and Days of Issuance Bought sits there with Asset Held, % of Supply and Total Flow.
Common questions
What does above parity mean?
That the funds alone bought more coin than the entire day’s new issuance, which means every other buyer that day was supplied from coin that already existed rather than from anything newly created.
Does that create a shortage?
No, and this is the standard misreading. Existing holders sell continuously, and the stock of coin already mined dwarfs the daily stream of new coin.
Why is it so volatile?
Because fund buying is volatile and issuance is nearly constant, so almost all of the movement comes from one side. Several days together are the smallest useful reading.
Is the comparison fair?
It is deliberately lopsided. One group of buyers is set against all new supply, which makes for a vivid figure and a partial one.
What does it leave out?
Every other source of coin reaching the market, which is the overwhelming majority of what actually changes hands on any given day. New issuance is a small stream beside it.
ON-CHAIN METRIC
Days of Issuance Bought
Fund buying set against the new coin created that day, on a scale where one is parity.
Open the ETF dashboard
New coin arrives at a known and published rate. Setting fund buying against that rate turns an abstract quantity of money into something concrete: how much of the day’s new supply these particular funds took for themselves.
Above parity the funds alone took more than the whole day’s new issuance, which means every other buyer that day was supplied from coin that already existed rather than from anything newly created.
What it actually measures
Parity is a meaningful line here rather than an arbitrary one. It marks the exact point at which a single group of buyers absorbed the entire day’s new supply on its own.
Readings above that line do not mean the market ran short of anything. Existing holders sell continuously, and their coin supplies every other buyer without any shortage arising.
The reading is volatile from day to day because fund buying is volatile while issuance is nearly constant. Several days together are the smallest unit worth reading.
Sustained readings above parity are the notable case rather than individual ones. A single day above the line happens routinely and a month of them does not.
Absorbing issuance is not the same as a shortage
The dramatic reading of this view is that funds buying more than the daily issuance must eventually exhaust the available supply. It is an intuitive conclusion and it does not follow from anything on the chart.
The overwhelming majority of coin in existence was mined long ago and can be sold at any time. New issuance is a small stream beside that stock, and a buyer absorbing all of it has done something notable without having made anything scarce.
What it does not tell you
It compares one group of buyers against the entire day’s new supply, which is a deliberately lopsided comparison and produces a correspondingly dramatic figure.
Issuance is nearly constant, so almost all of the movement in the reading comes from the flow side.
It ignores every other source of coin reaching the market, which is the overwhelming majority of what actually gets traded.
The issuance schedule steps down at fixed intervals, so an identical amount of buying produces a higher reading after each one.
It looks at one day at a time while allocation decisions are made over weeks, which is why single readings mislead so readily.
How to read it
Above issuance. The funds alone took more than the day’s entire new supply.
Below issuance. The funds took less than the day’s new supply.
Open the ETF dashboard and Days of Issuance Bought sits there with Asset Held, % of Supply and Total Flow.
Common questions
What does above parity mean?
That the funds alone bought more coin than the entire day’s new issuance, which means every other buyer that day was supplied from coin that already existed rather than from anything newly created.
Does that create a shortage?
No, and this is the standard misreading. Existing holders sell continuously, and the stock of coin already mined dwarfs the daily stream of new coin.
Why is it so volatile?
Because fund buying is volatile and issuance is nearly constant, so almost all of the movement comes from one side. Several days together are the smallest useful reading.
Is the comparison fair?
It is deliberately lopsided. One group of buyers is set against all new supply, which makes for a vivid figure and a partial one.
What does it leave out?
Every other source of coin reaching the market, which is the overwhelming majority of what actually changes hands on any given day. New issuance is a small stream beside it.