

ON-CHAIN METRIC
Flow Drawdown
How far committed capital has retraced from its high, which is not a price measure.
Open the ETF dashboard
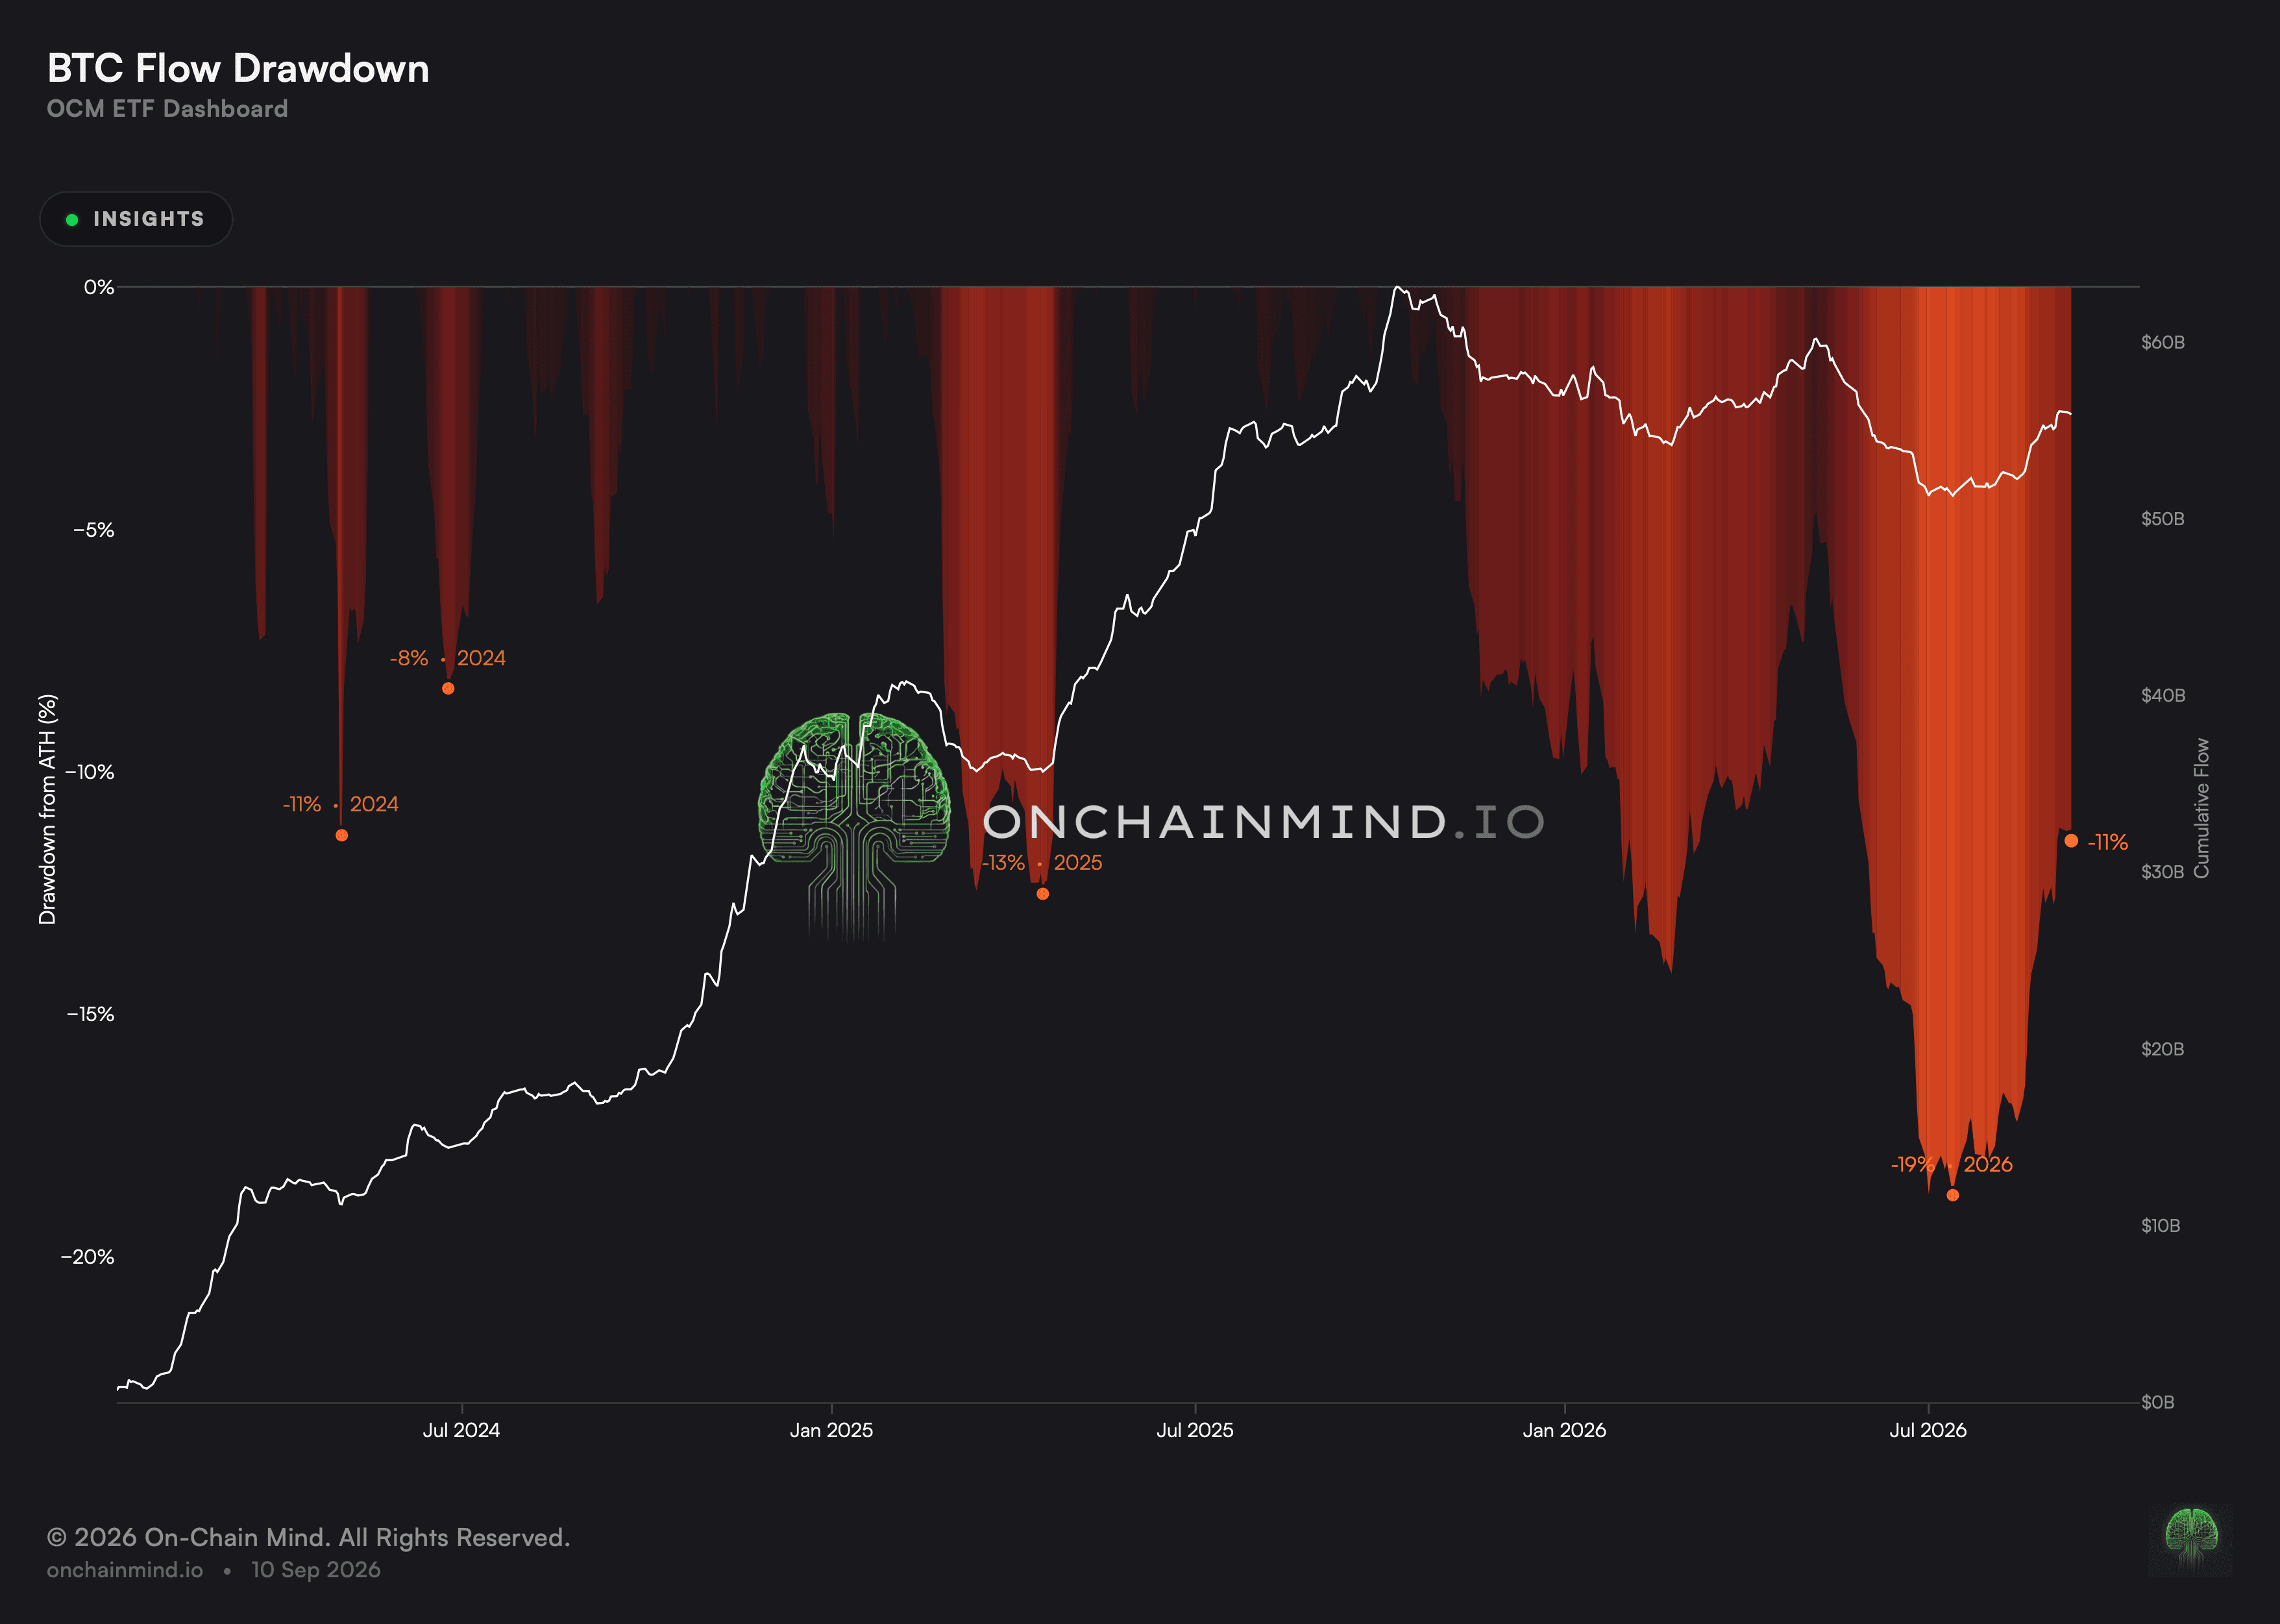
Applying a drawdown to committed capital rather than to price answers a question price cannot reach. Not how much value has been lost on paper, but how much money has actually been taken back out by the people who put it in.
The two come apart constantly, and the divergence is the whole reason to have this view. A large fall in price with no redemptions at all leaves this reading pinned at zero, which is a specific and useful thing to know about a decline while it is happening.
What it actually measures
Zero means the running total sits at its high, which has been the ordinary state. Committed capital that has never been withdrawn keeps this reading pinned there indefinitely.
Any meaningful depth on this line is a genuine event rather than routine variation. It means investors chose to take money back out, which is a decision somebody made rather than a repricing that happened to them.
The recovery is as informative as the fall itself. Capital returning after a withdrawal is a different signal from capital that never left in the first place.
The speed of a retracement matters. A gradual drift down and a sharp drop of the same depth describe different behaviour by the same holder base.
Price falling and money leaving are separate events
The two get treated as one thing during a decline. Value falls, headlines follow, and the assumption is that investors are heading for the exit.
This reading is where that assumption gets tested, and it has frequently failed. Substantial declines have passed with this line barely moving, which says the holder base sat through them. That is a materially different market from one where the money actually left.
What it does not tell you
It measures the aggregate and nothing finer. Investors leaving while others arrive in similar quantity produce no reading here at all, however much turnover that represents.
Reported flows lag and are revised, so recent depth is the least reliable part of the line.
It cannot distinguish a redemption from a switch between funds where the reporting nets the two together.
A shallow drawdown is easy to reach in a large complex, so the depth of the line is not comparable across the history in the way it looks.
It measures against the peak alone, so a long stretch of gradual decline reads as a single deepening figure rather than as a process.
How to read it
At the high. No money has been taken back out on net, so the retracement is nil.
Underwater. Some committed money has been withdrawn since the peak.
Flow Drawdown sits on the ETF dashboard beside Total Flow, Combined Flows and Assets Under Management.
Common questions
Why not just use a price drawdown?
Because this measures money actually withdrawn rather than value merely lost. A large fall in price with no redemptions alongside it leaves this reading at zero, which says a great deal about the character of that decline.
Why is zero the ordinary state?
Because committed capital that has never been taken out keeps the running total at its high. Any meaningful depth here is a genuine event rather than routine variation.
What does a recovery say?
That capital returned after leaving, which is a different thing from capital that never left. The shape either side of a withdrawal is as informative as the withdrawal.
Does it see individual investors leaving?
No. It measures the aggregate, so investors leaving while others arrive produce no reading at all.
How reliable is the recent end?
The least reliable part of the whole line. Reported flows lag and are revised afterwards, so a shallow recent drawdown may deepen substantially or disappear altogether.
ON-CHAIN METRIC
Flow Drawdown
How far committed capital has retraced from its high, which is not a price measure.
Open the ETF dashboard
Applying a drawdown to committed capital rather than to price answers a question price cannot reach. Not how much value has been lost on paper, but how much money has actually been taken back out by the people who put it in.
The two come apart constantly, and the divergence is the whole reason to have this view. A large fall in price with no redemptions at all leaves this reading pinned at zero, which is a specific and useful thing to know about a decline while it is happening.
What it actually measures
Zero means the running total sits at its high, which has been the ordinary state. Committed capital that has never been withdrawn keeps this reading pinned there indefinitely.
Any meaningful depth on this line is a genuine event rather than routine variation. It means investors chose to take money back out, which is a decision somebody made rather than a repricing that happened to them.
The recovery is as informative as the fall itself. Capital returning after a withdrawal is a different signal from capital that never left in the first place.
The speed of a retracement matters. A gradual drift down and a sharp drop of the same depth describe different behaviour by the same holder base.
Price falling and money leaving are separate events
The two get treated as one thing during a decline. Value falls, headlines follow, and the assumption is that investors are heading for the exit.
This reading is where that assumption gets tested, and it has frequently failed. Substantial declines have passed with this line barely moving, which says the holder base sat through them. That is a materially different market from one where the money actually left.
What it does not tell you
It measures the aggregate and nothing finer. Investors leaving while others arrive in similar quantity produce no reading here at all, however much turnover that represents.
Reported flows lag and are revised, so recent depth is the least reliable part of the line.
It cannot distinguish a redemption from a switch between funds where the reporting nets the two together.
A shallow drawdown is easy to reach in a large complex, so the depth of the line is not comparable across the history in the way it looks.
It measures against the peak alone, so a long stretch of gradual decline reads as a single deepening figure rather than as a process.
How to read it
At the high. No money has been taken back out on net, so the retracement is nil.
Underwater. Some committed money has been withdrawn since the peak.
Flow Drawdown sits on the ETF dashboard beside Total Flow, Combined Flows and Assets Under Management.
Common questions
Why not just use a price drawdown?
Because this measures money actually withdrawn rather than value merely lost. A large fall in price with no redemptions alongside it leaves this reading at zero, which says a great deal about the character of that decline.
Why is zero the ordinary state?
Because committed capital that has never been taken out keeps the running total at its high. Any meaningful depth here is a genuine event rather than routine variation.
What does a recovery say?
That capital returned after leaving, which is a different thing from capital that never left. The shape either side of a withdrawal is as informative as the withdrawal.
Does it see individual investors leaving?
No. It measures the aggregate, so investors leaving while others arrive produce no reading at all.
How reliable is the recent end?
The least reliable part of the whole line. Reported flows lag and are revised afterwards, so a shallow recent drawdown may deepen substantially or disappear altogether.