

ON-CHAIN METRIC
OI Ratio
Which instrument the market is leaning on, and why the two behave so differently.
Open the Derivatives dashboard
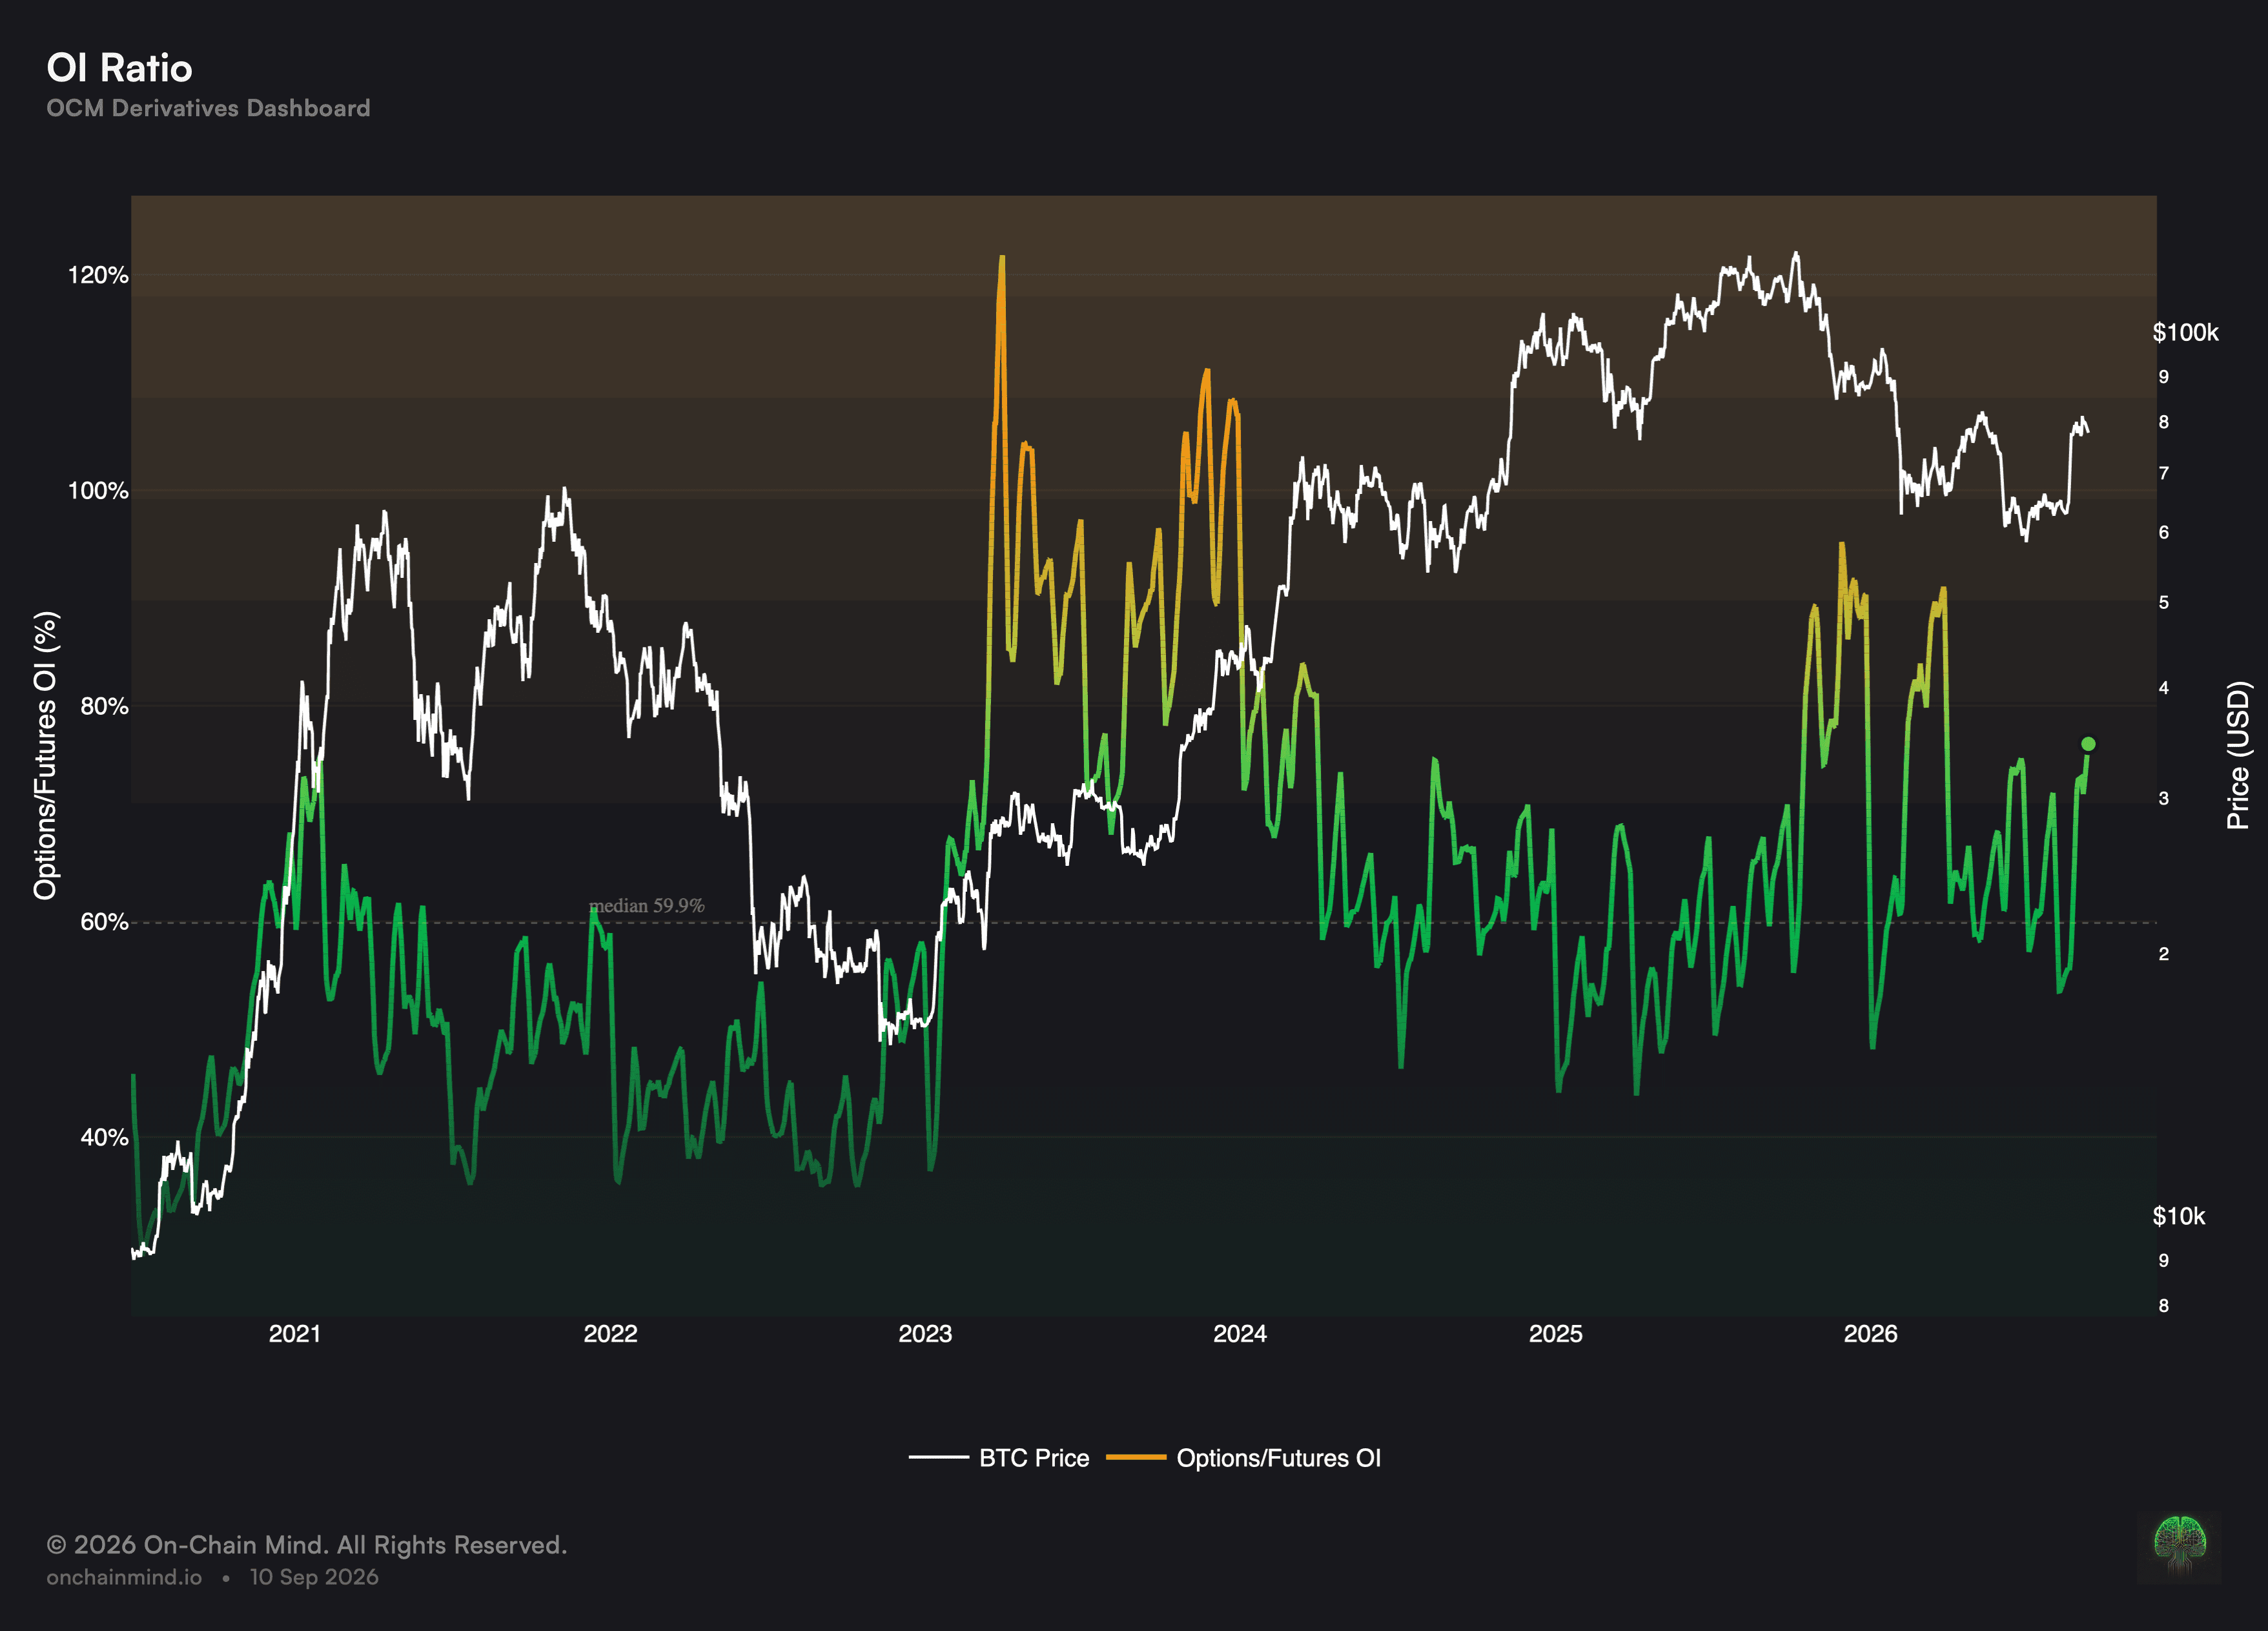
The OI Ratio reads how much of the open interest in this market sits in options against how much sits in futures. It is a question about which instrument traders are expressing themselves through, not about how much leverage there is.
The mix matters because the two break differently under pressure. A market leaning on one behaves nothing like a market leaning on the other when something goes wrong.
What it actually measures
A low reading says futures carry the positioning. That leverage is exposed to forced closure, and forced closure is what turns an ordinary decline into a cascade, because each position closed pushes price towards the next one.
A high reading says options carry it. A buyer there has a defined worst case, but the sellers on the other side hedge continuously, and that hedging is flow the market has to absorb.
The level has drifted upward across the record as the options market matured, so the reading is judged against its own history rather than against any fixed line. A figure that once meant options-heavy would now be unremarkable.
Options do not remove risk, they relocate it
It is tempting to read a shift towards options as a market getting safer, because the cascade mechanism weakens. Some of that is real: a buyer who has paid a premium cannot be forced out of the position.
The risk moves rather than disappearing. It lands with the sellers, who hedge continuously as price travels, and their hedging becomes flow the market has to absorb, sometimes calming a move and sometimes feeding it. Different risk, not less of it.
What it does not tell you
Total leverage is invisible to it. A market can shift heavily towards options while the overall commitment grows, shrinks or stands still, so the reading needs a level beside it before it means much.
Coverage is not complete. Options positioning is concentrated at a handful of specialist venues, so the reading leans on those being tracked well, and a venue outside the set is simply absent from the number.
It carries no direction. Neither instrument implies a view, and a shift in the mix says how the market is positioned rather than which way it expects to go.
How to read it
Futures-led. Futures carry the positioning, which leaves leverage more exposed to forced closure.
Balanced. Neither instrument dominates how the market is positioned.
Options-heavy. Options carry the positioning, so buyers have a known worst case and sellers are hedging behind them.
OI Ratio is kept on the Derivatives dashboard, in company with Derivative Load, CDRI and CGDI.
Common questions
Why separate options from futures at all?
Because the two break differently. A futures position can be closed out against its holder’s will and set off the next one; an option simply expires, and this is the hedging behind it that reaches the market.
What has pushed the reading higher over the years?
Options markets have matured and larger participants tend to prefer instruments with a defined worst case. The drift means the reading has to be judged against its own record.
Is an options-heavy market safer?
Not automatically. It weakens the cascade mechanism, and in exchange it adds hedging flow that can speed a move up near heavily traded strikes. The risk has changed shape rather than shrunk.
Does this show how much leverage exists?
No, only how it is split. Total commitment can be rising, falling or flat while the mix between the two instruments does something else entirely.
Can the ratio be read as bullish or bearish?
Neither. Both instruments are used in both directions, so the reading describes the shape of positioning rather than its intent.
ON-CHAIN METRIC
OI Ratio
Which instrument the market is leaning on, and why the two behave so differently.
Open the Derivatives dashboard
The OI Ratio reads how much of the open interest in this market sits in options against how much sits in futures. It is a question about which instrument traders are expressing themselves through, not about how much leverage there is.
The mix matters because the two break differently under pressure. A market leaning on one behaves nothing like a market leaning on the other when something goes wrong.
What it actually measures
A low reading says futures carry the positioning. That leverage is exposed to forced closure, and forced closure is what turns an ordinary decline into a cascade, because each position closed pushes price towards the next one.
A high reading says options carry it. A buyer there has a defined worst case, but the sellers on the other side hedge continuously, and that hedging is flow the market has to absorb.
The level has drifted upward across the record as the options market matured, so the reading is judged against its own history rather than against any fixed line. A figure that once meant options-heavy would now be unremarkable.
Options do not remove risk, they relocate it
It is tempting to read a shift towards options as a market getting safer, because the cascade mechanism weakens. Some of that is real: a buyer who has paid a premium cannot be forced out of the position.
The risk moves rather than disappearing. It lands with the sellers, who hedge continuously as price travels, and their hedging becomes flow the market has to absorb, sometimes calming a move and sometimes feeding it. Different risk, not less of it.
What it does not tell you
Total leverage is invisible to it. A market can shift heavily towards options while the overall commitment grows, shrinks or stands still, so the reading needs a level beside it before it means much.
Coverage is not complete. Options positioning is concentrated at a handful of specialist venues, so the reading leans on those being tracked well, and a venue outside the set is simply absent from the number.
It carries no direction. Neither instrument implies a view, and a shift in the mix says how the market is positioned rather than which way it expects to go.
How to read it
Futures-led. Futures carry the positioning, which leaves leverage more exposed to forced closure.
Balanced. Neither instrument dominates how the market is positioned.
Options-heavy. Options carry the positioning, so buyers have a known worst case and sellers are hedging behind them.
OI Ratio is kept on the Derivatives dashboard, in company with Derivative Load, CDRI and CGDI.
Common questions
Why separate options from futures at all?
Because the two break differently. A futures position can be closed out against its holder’s will and set off the next one; an option simply expires, and this is the hedging behind it that reaches the market.
What has pushed the reading higher over the years?
Options markets have matured and larger participants tend to prefer instruments with a defined worst case. The drift means the reading has to be judged against its own record.
Is an options-heavy market safer?
Not automatically. It weakens the cascade mechanism, and in exchange it adds hedging flow that can speed a move up near heavily traded strikes. The risk has changed shape rather than shrunk.
Does this show how much leverage exists?
No, only how it is split. Total commitment can be rising, falling or flat while the mix between the two instruments does something else entirely.
Can the ratio be read as bullish or bearish?
Neither. Both instruments are used in both directions, so the reading describes the shape of positioning rather than its intent.