

ON-CHAIN METRIC
Futures Open Interest by Exchange
How leveraged exposure is split across venues, and what happens when one carries too much.
Open the Futures dashboard
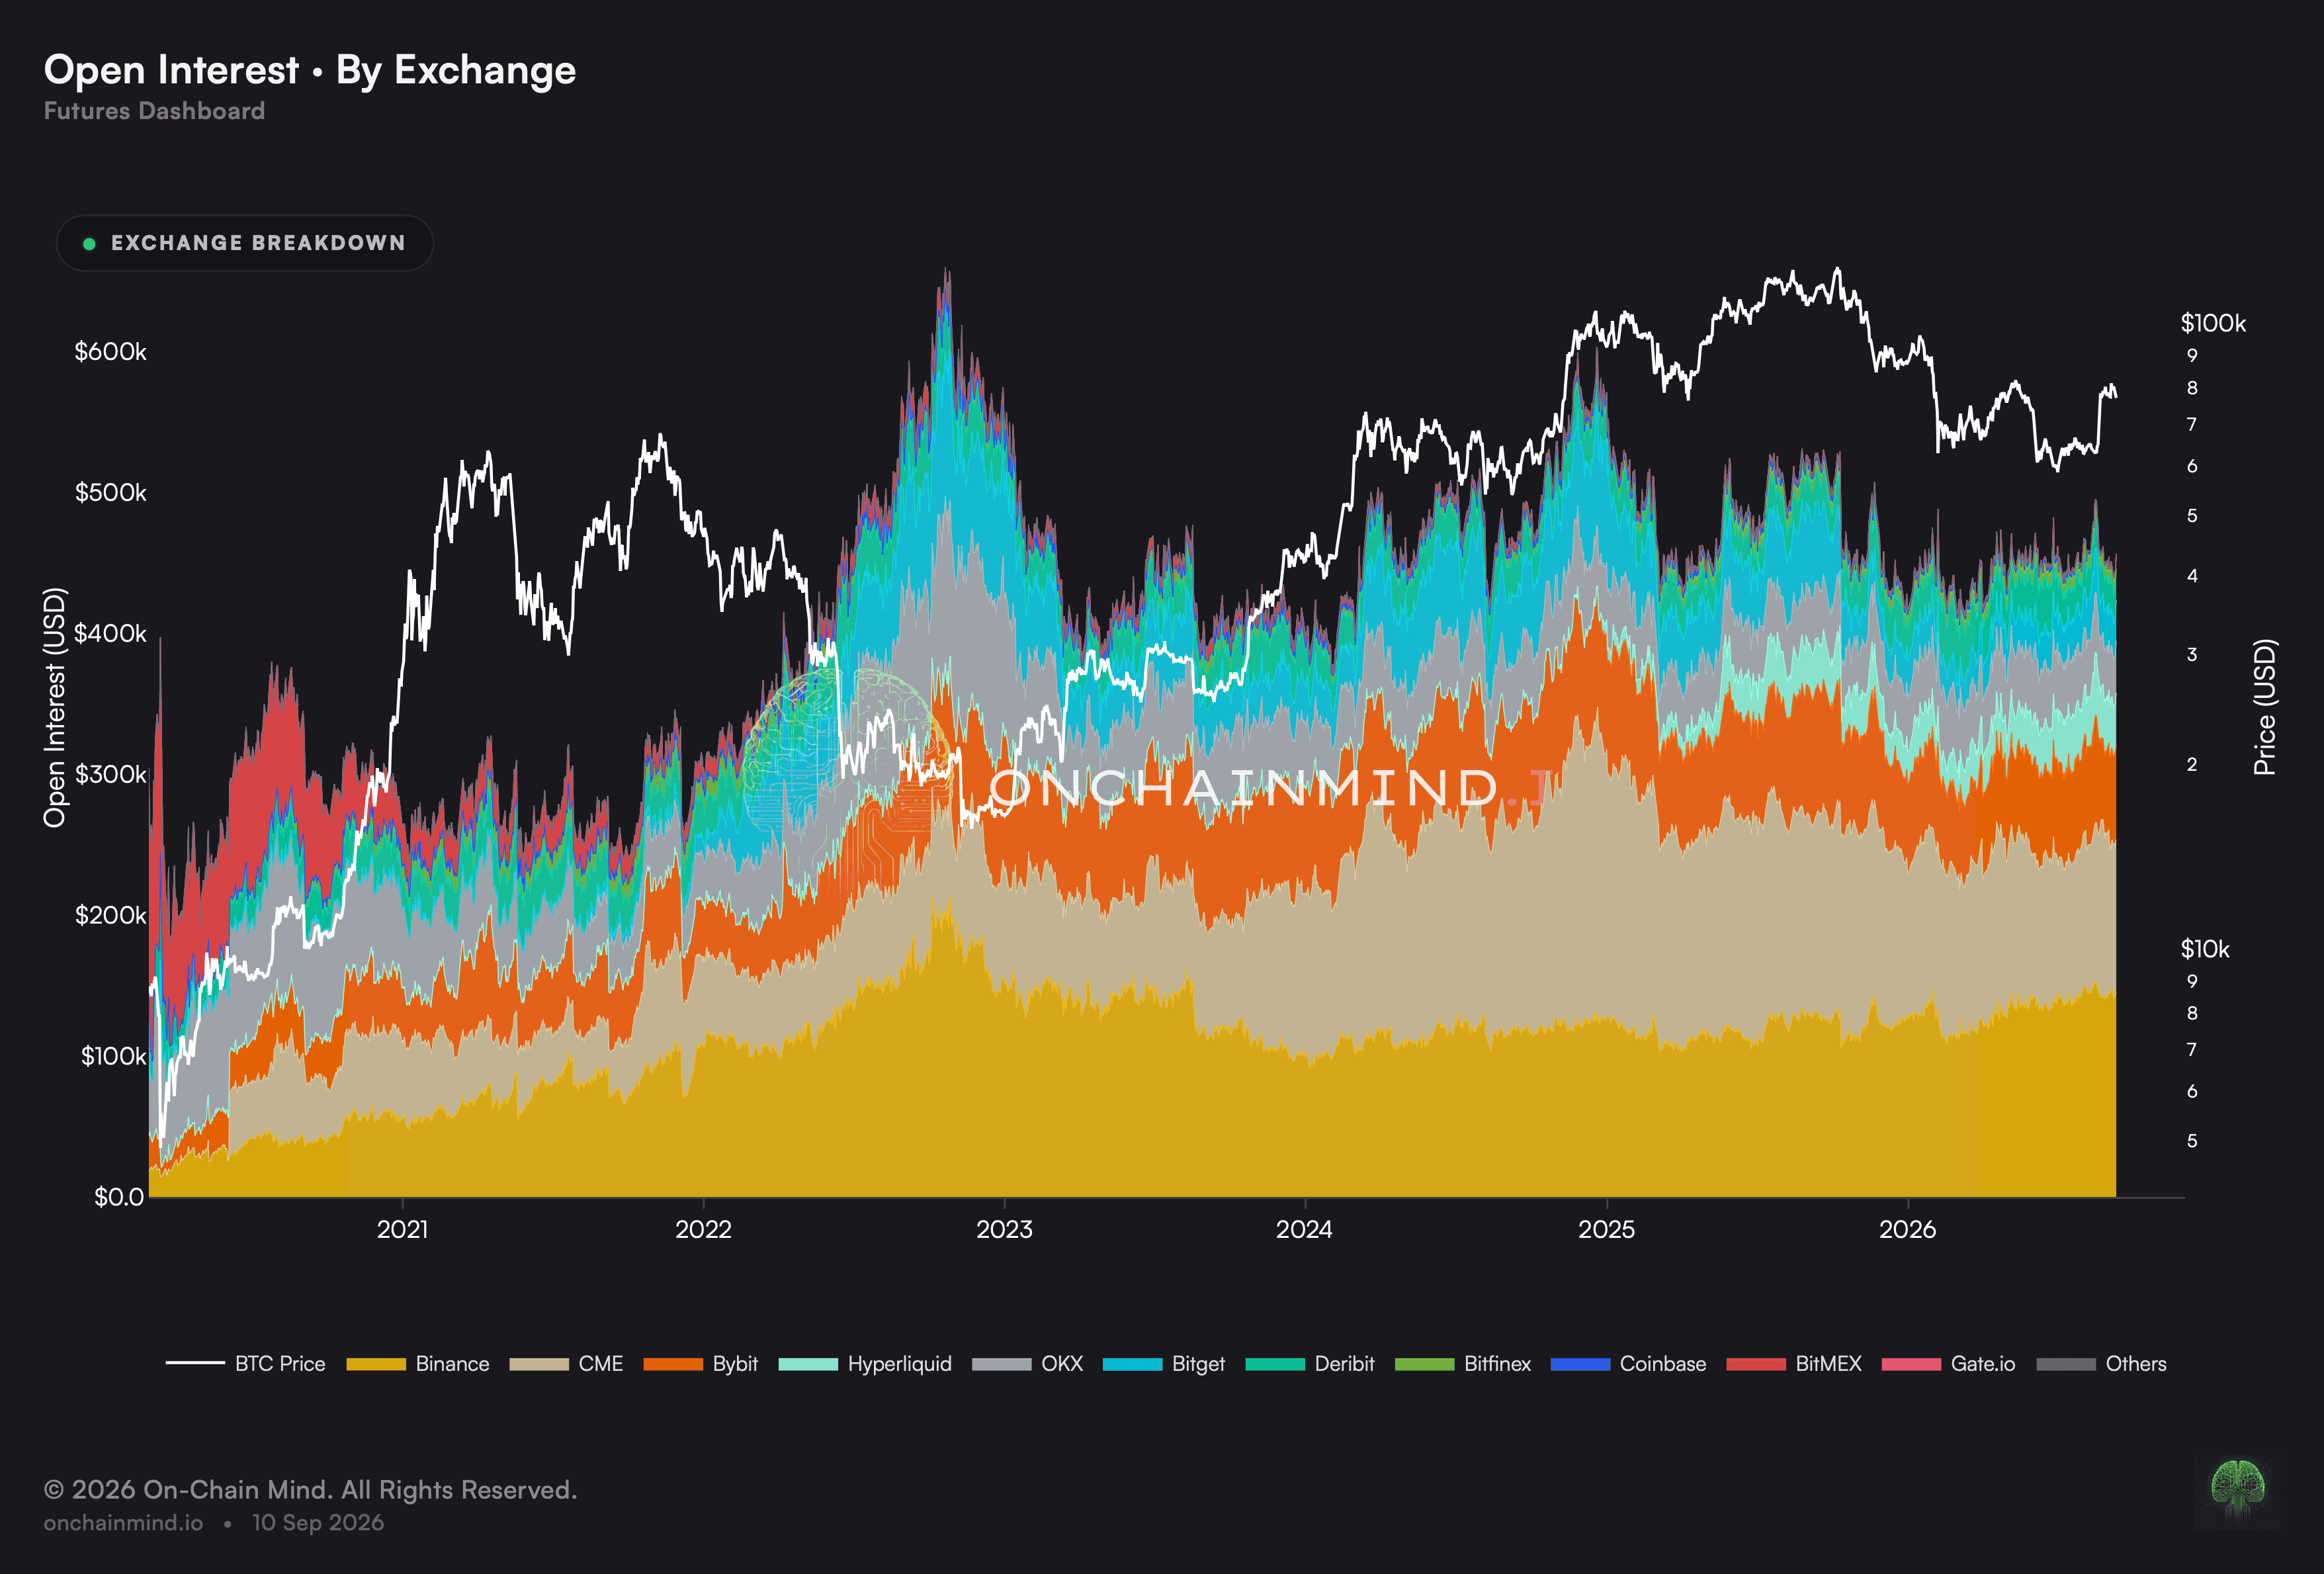
Open Interest by Exchange splits the aggregate figure across the venues that make it up, either as dollars or as each venue’s share. It answers a structural question the total cannot reach: not how much leverage exists, but where it sits.
Where it sits decides how fragile it is. Leverage is not interchangeable across exchanges, because margin rules, insurance funds and liquidation engines all differ, so the same aggregate is more or less dangerous depending on its address.
What it actually measures
One setting reports the amount sitting at each exchange and the other reports the proportions. Those answers drift apart, since an exchange can take a bigger slice of a shrinking pie while its own book is emptying out.
The leading venue’s share is the reading that matters most. When a single exchange carries an unusually large slice, its outage, its margin change or its unwind stops being its own problem and becomes the market’s.
Movement over time is the second thing to read. Proportions drifting persistently towards one exchange describe a change in the industry rather than a busy week, and the cause might be genuine preference, a fee promotion, or nothing more than traders going where the depth is.
Concentration is a risk the aggregate cannot express
A single open interest number treats every venue as interchangeable, and the mechanics say otherwise. An exchange with a thin insurance fund and an aggressive liquidation engine converts the same exposure into forced selling far sooner than one built more conservatively.
That is why the split deserves watching in its own right. Two markets with identical totals, one spread evenly and one with most of the weight in a single venue, face very different consequences from the same adverse move, and only the second figure shows it.
What it does not tell you
Venue reporting is not uniform. Contract specifications, settlement currencies and what each exchange chooses to publish all differ, so the comparison between them is sound in direction and approximate in level.
Smaller venues are grouped for readability, which means a shift happening among them stays invisible until it is large enough to change the group. The aggregate includes everything regardless of how it is drawn.
A concentrated reading is a statement about structure and not about direction. Exposure gathering on one venue says the plumbing has a single point of failure, and nothing about which way price goes next.
How to read it
Concentrated. One venue carries an unusually large slice, so its problems become the whole market’s problems.
Ordinary. Exposure is spread across the major venues in the pattern this market normally runs.
Distributed. No single venue dominates, so the plumbing has no obvious single point of failure.
Open Interest by Exchange updates on the Futures dashboard, and so do Total OI, Liquidations by Exchange and ELR by Venue.
Common questions
Why break the total down by exchange?
Because a position at one exchange is not the same instrument as a position at another. Margin schedules, backstop funds and the software that closes people out all vary, so the same exposure sits on firmer ground in some places than others.
Should I read amounts or proportions?
Amounts for the size of the pile, proportions for how it is parcelled out. The two answers drift apart, since an exchange can take a bigger slice of a shrinking pie while its own book empties.
Why would one exchange’s slice grow?
Because exposure is gathering there. The cause might be genuine preference, a fee promotion, or traders simply going where the depth is, and every one of those makes trouble at that particular exchange more expensive for everybody.
Why are smaller venues grouped together?
To keep the chart readable. The grouping is by size, and the aggregate figure includes every venue regardless of whether it is drawn on its own.
Does concentration point to lower prices?
No. It describes a structural weakness in how this market is plumbed. It says the consequences of a shock would be larger, and nothing about whether a shock arrives.
ON-CHAIN METRIC
Futures Open Interest by Exchange
How leveraged exposure is split across venues, and what happens when one carries too much.
Open the Futures dashboard
Open Interest by Exchange splits the aggregate figure across the venues that make it up, either as dollars or as each venue’s share. It answers a structural question the total cannot reach: not how much leverage exists, but where it sits.
Where it sits decides how fragile it is. Leverage is not interchangeable across exchanges, because margin rules, insurance funds and liquidation engines all differ, so the same aggregate is more or less dangerous depending on its address.
What it actually measures
One setting reports the amount sitting at each exchange and the other reports the proportions. Those answers drift apart, since an exchange can take a bigger slice of a shrinking pie while its own book is emptying out.
The leading venue’s share is the reading that matters most. When a single exchange carries an unusually large slice, its outage, its margin change or its unwind stops being its own problem and becomes the market’s.
Movement over time is the second thing to read. Proportions drifting persistently towards one exchange describe a change in the industry rather than a busy week, and the cause might be genuine preference, a fee promotion, or nothing more than traders going where the depth is.
Concentration is a risk the aggregate cannot express
A single open interest number treats every venue as interchangeable, and the mechanics say otherwise. An exchange with a thin insurance fund and an aggressive liquidation engine converts the same exposure into forced selling far sooner than one built more conservatively.
That is why the split deserves watching in its own right. Two markets with identical totals, one spread evenly and one with most of the weight in a single venue, face very different consequences from the same adverse move, and only the second figure shows it.
What it does not tell you
Venue reporting is not uniform. Contract specifications, settlement currencies and what each exchange chooses to publish all differ, so the comparison between them is sound in direction and approximate in level.
Smaller venues are grouped for readability, which means a shift happening among them stays invisible until it is large enough to change the group. The aggregate includes everything regardless of how it is drawn.
A concentrated reading is a statement about structure and not about direction. Exposure gathering on one venue says the plumbing has a single point of failure, and nothing about which way price goes next.
How to read it
Concentrated. One venue carries an unusually large slice, so its problems become the whole market’s problems.
Ordinary. Exposure is spread across the major venues in the pattern this market normally runs.
Distributed. No single venue dominates, so the plumbing has no obvious single point of failure.
Open Interest by Exchange updates on the Futures dashboard, and so do Total OI, Liquidations by Exchange and ELR by Venue.
Common questions
Why break the total down by exchange?
Because a position at one exchange is not the same instrument as a position at another. Margin schedules, backstop funds and the software that closes people out all vary, so the same exposure sits on firmer ground in some places than others.
Should I read amounts or proportions?
Amounts for the size of the pile, proportions for how it is parcelled out. The two answers drift apart, since an exchange can take a bigger slice of a shrinking pie while its own book empties.
Why would one exchange’s slice grow?
Because exposure is gathering there. The cause might be genuine preference, a fee promotion, or traders simply going where the depth is, and every one of those makes trouble at that particular exchange more expensive for everybody.
Why are smaller venues grouped together?
To keep the chart readable. The grouping is by size, and the aggregate figure includes every venue regardless of whether it is drawn on its own.
Does concentration point to lower prices?
No. It describes a structural weakness in how this market is plumbed. It says the consequences of a shock would be larger, and nothing about whether a shock arrives.