

ON-CHAIN METRIC
Positive HODL Days
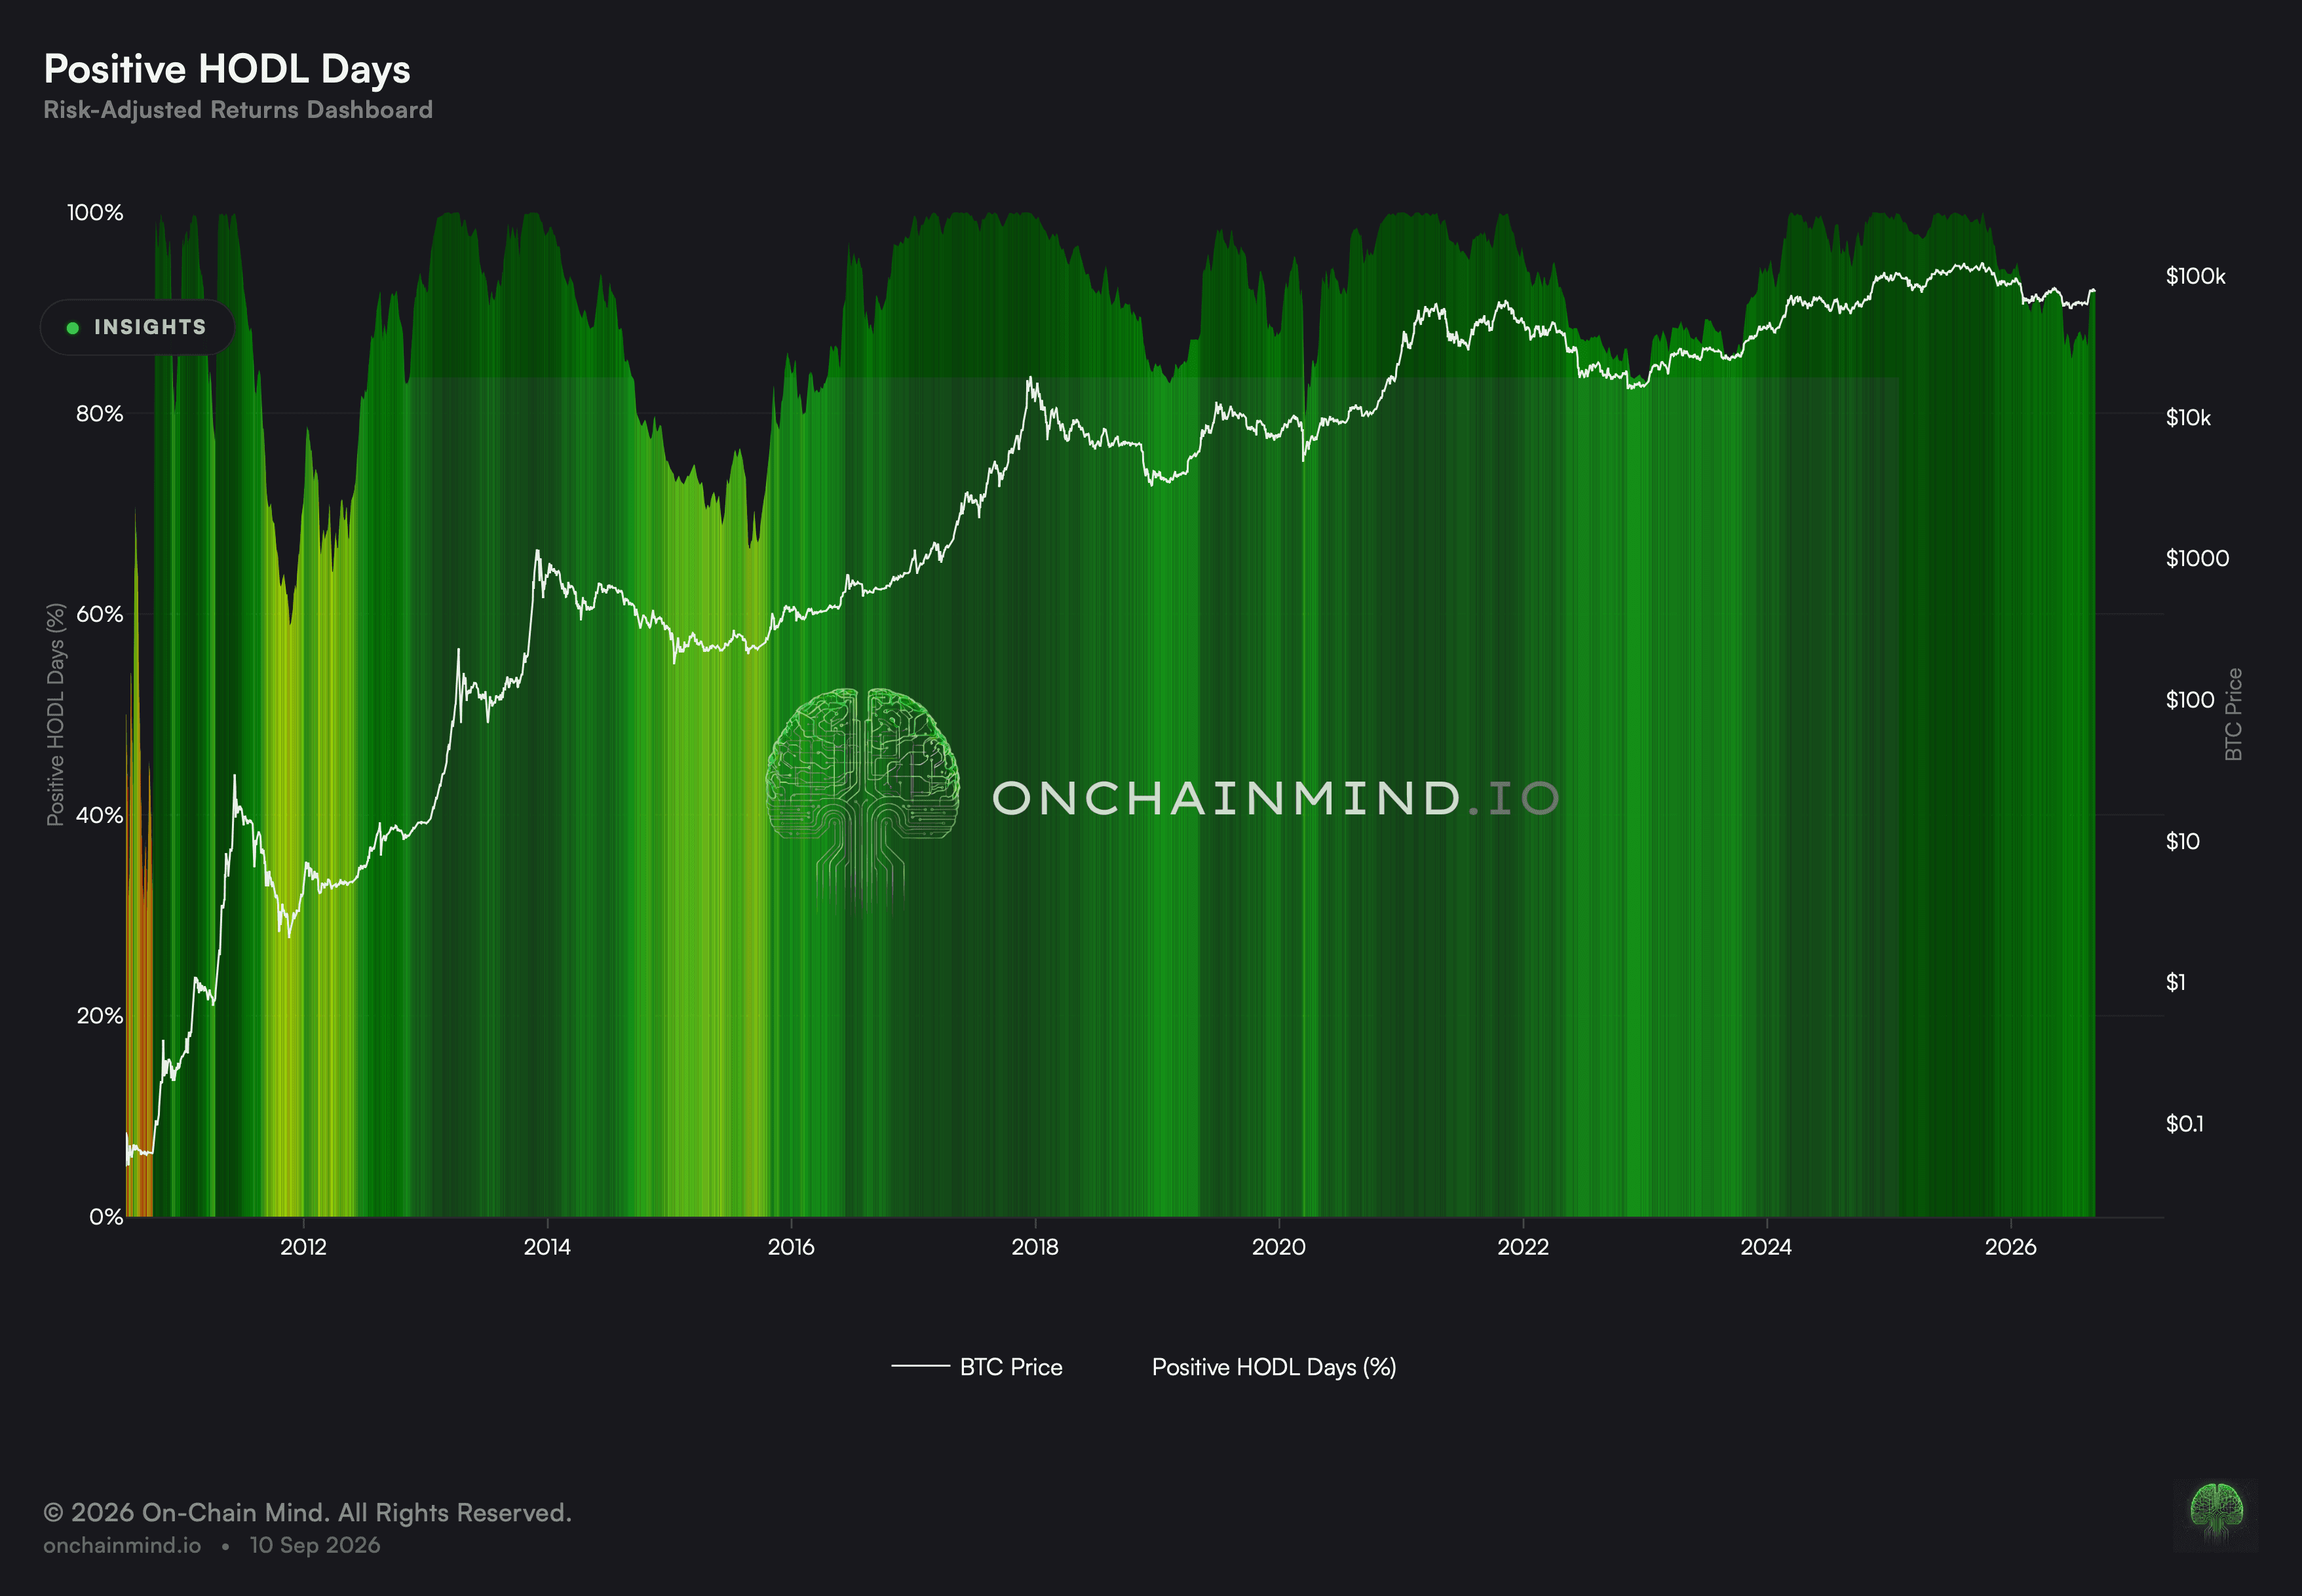
The share of all holding days across the record that currently sit in profit.
Open the Risk-Adjusted Returns dashboard
Positive HODL Days counts what proportion of every day in the asset’s life would currently be showing a gain. It is a blunt reading of how far profitability reaches back through the record.
The edges are where it earns its place. Once virtually the entire record is showing a gain, there is nobody remaining to be converted from loss into profit, and that state of affairs has tended to describe giddiness rather than robustness.
What it actually measures
Every day in the record is checked against the current price and counted as in profit or not. The reading is the share that are, which makes it a statement about how widely gains are spread, not about how far price has moved.
The same reach makes the bottom end worth reading. A sunken figure means much of the record is showing a loss, which is the punishing end of the range and where buying has historically gathered.
A holding day is not a holder
The measure counts days in the record, not people. A day on which almost nobody bought weighs exactly as much as a day on which everybody did, because the unit is the session rather than the participant.
What this settles is how much of the record is showing a gain, never how many people are. Those two questions part company the moment activity has been lumpy, which for this asset it perpetually has been. Treat it as a claim about the archive rather than about the population.
What it does not tell you
It has no sense of size. A quiet day and the heaviest session in the record contribute equally, so a period of enormous participation can be outweighed by a long stretch of very little.
A stressed reading also frames conditions rather than timing them. Past accumulation has clustered at the low end and a stressed market can stay stressed, so the level says where in the range you are and never how long that lasts.
It is also slow to turn near the top. Once the great majority of the record is in profit, a further advance barely moves the reading, which is exactly when people most want it to be responsive.
How to read it
Extreme profit. Virtually the whole record is showing a gain. That has generally described giddiness rather than robustness.
High profit. Much of the record is showing a gain, which is a taut condition without being an emergency.
Normal. The everyday ground between the edges, where this supplies background and not urgency.
Market stress. Little of the record is showing a gain. Historically the punishing end, and where buying has gathered.
Positive HODL Days appears on the Risk-Adjusted Returns dashboard, along with Profit Probability, Risk of Ruin and the Risk-Adjusted Composite.
Common questions
What does the metric show?
The proportion of all holding days currently in profit, so it reads as the breadth of profit across the record, not the size of the move.
Why should an unusually high figure worry me?
Because virtually nobody remains to be converted from loss into profit. The edges have tended to describe giddiness rather than robustness.
Does a low figure mark a place to buy?
That is the punishing end, and buying has historically gathered there, though a punished market is perfectly capable of staying punished. This sets the scene without putting a clock on it.
Does one day in the record equal one person?
No. Every entry in the archive counts once regardless of how busy it was, so a deserted session carries the same weight as a frantic one.
What does it miss as a result?
Size. A period of very heavy participation can be outweighed by a long quiet stretch, because every session counts once.
ON-CHAIN METRIC
Positive HODL Days
The share of all holding days across the record that currently sit in profit.
Open the Risk-Adjusted Returns dashboard
Positive HODL Days counts what proportion of every day in the asset’s life would currently be showing a gain. It is a blunt reading of how far profitability reaches back through the record.
The edges are where it earns its place. Once virtually the entire record is showing a gain, there is nobody remaining to be converted from loss into profit, and that state of affairs has tended to describe giddiness rather than robustness.
What it actually measures
Every day in the record is checked against the current price and counted as in profit or not. The reading is the share that are, which makes it a statement about how widely gains are spread, not about how far price has moved.
The same reach makes the bottom end worth reading. A sunken figure means much of the record is showing a loss, which is the punishing end of the range and where buying has historically gathered.
A holding day is not a holder
The measure counts days in the record, not people. A day on which almost nobody bought weighs exactly as much as a day on which everybody did, because the unit is the session rather than the participant.
What this settles is how much of the record is showing a gain, never how many people are. Those two questions part company the moment activity has been lumpy, which for this asset it perpetually has been. Treat it as a claim about the archive rather than about the population.
What it does not tell you
It has no sense of size. A quiet day and the heaviest session in the record contribute equally, so a period of enormous participation can be outweighed by a long stretch of very little.
A stressed reading also frames conditions rather than timing them. Past accumulation has clustered at the low end and a stressed market can stay stressed, so the level says where in the range you are and never how long that lasts.
It is also slow to turn near the top. Once the great majority of the record is in profit, a further advance barely moves the reading, which is exactly when people most want it to be responsive.
How to read it
Extreme profit. Virtually the whole record is showing a gain. That has generally described giddiness rather than robustness.
High profit. Much of the record is showing a gain, which is a taut condition without being an emergency.
Normal. The everyday ground between the edges, where this supplies background and not urgency.
Market stress. Little of the record is showing a gain. Historically the punishing end, and where buying has gathered.
Positive HODL Days appears on the Risk-Adjusted Returns dashboard, along with Profit Probability, Risk of Ruin and the Risk-Adjusted Composite.
Common questions
What does the metric show?
The proportion of all holding days currently in profit, so it reads as the breadth of profit across the record, not the size of the move.
Why should an unusually high figure worry me?
Because virtually nobody remains to be converted from loss into profit. The edges have tended to describe giddiness rather than robustness.
Does a low figure mark a place to buy?
That is the punishing end, and buying has historically gathered there, though a punished market is perfectly capable of staying punished. This sets the scene without putting a clock on it.
Does one day in the record equal one person?
No. Every entry in the archive counts once regardless of how busy it was, so a deserted session carries the same weight as a frantic one.
What does it miss as a result?
Size. A period of very heavy participation can be outweighed by a long quiet stretch, because every session counts once.