

ON-CHAIN METRIC
Terminal Price
A cycle-top reference that moves as the network does, so the number is never fixed.
Open the Cost Bases dashboard
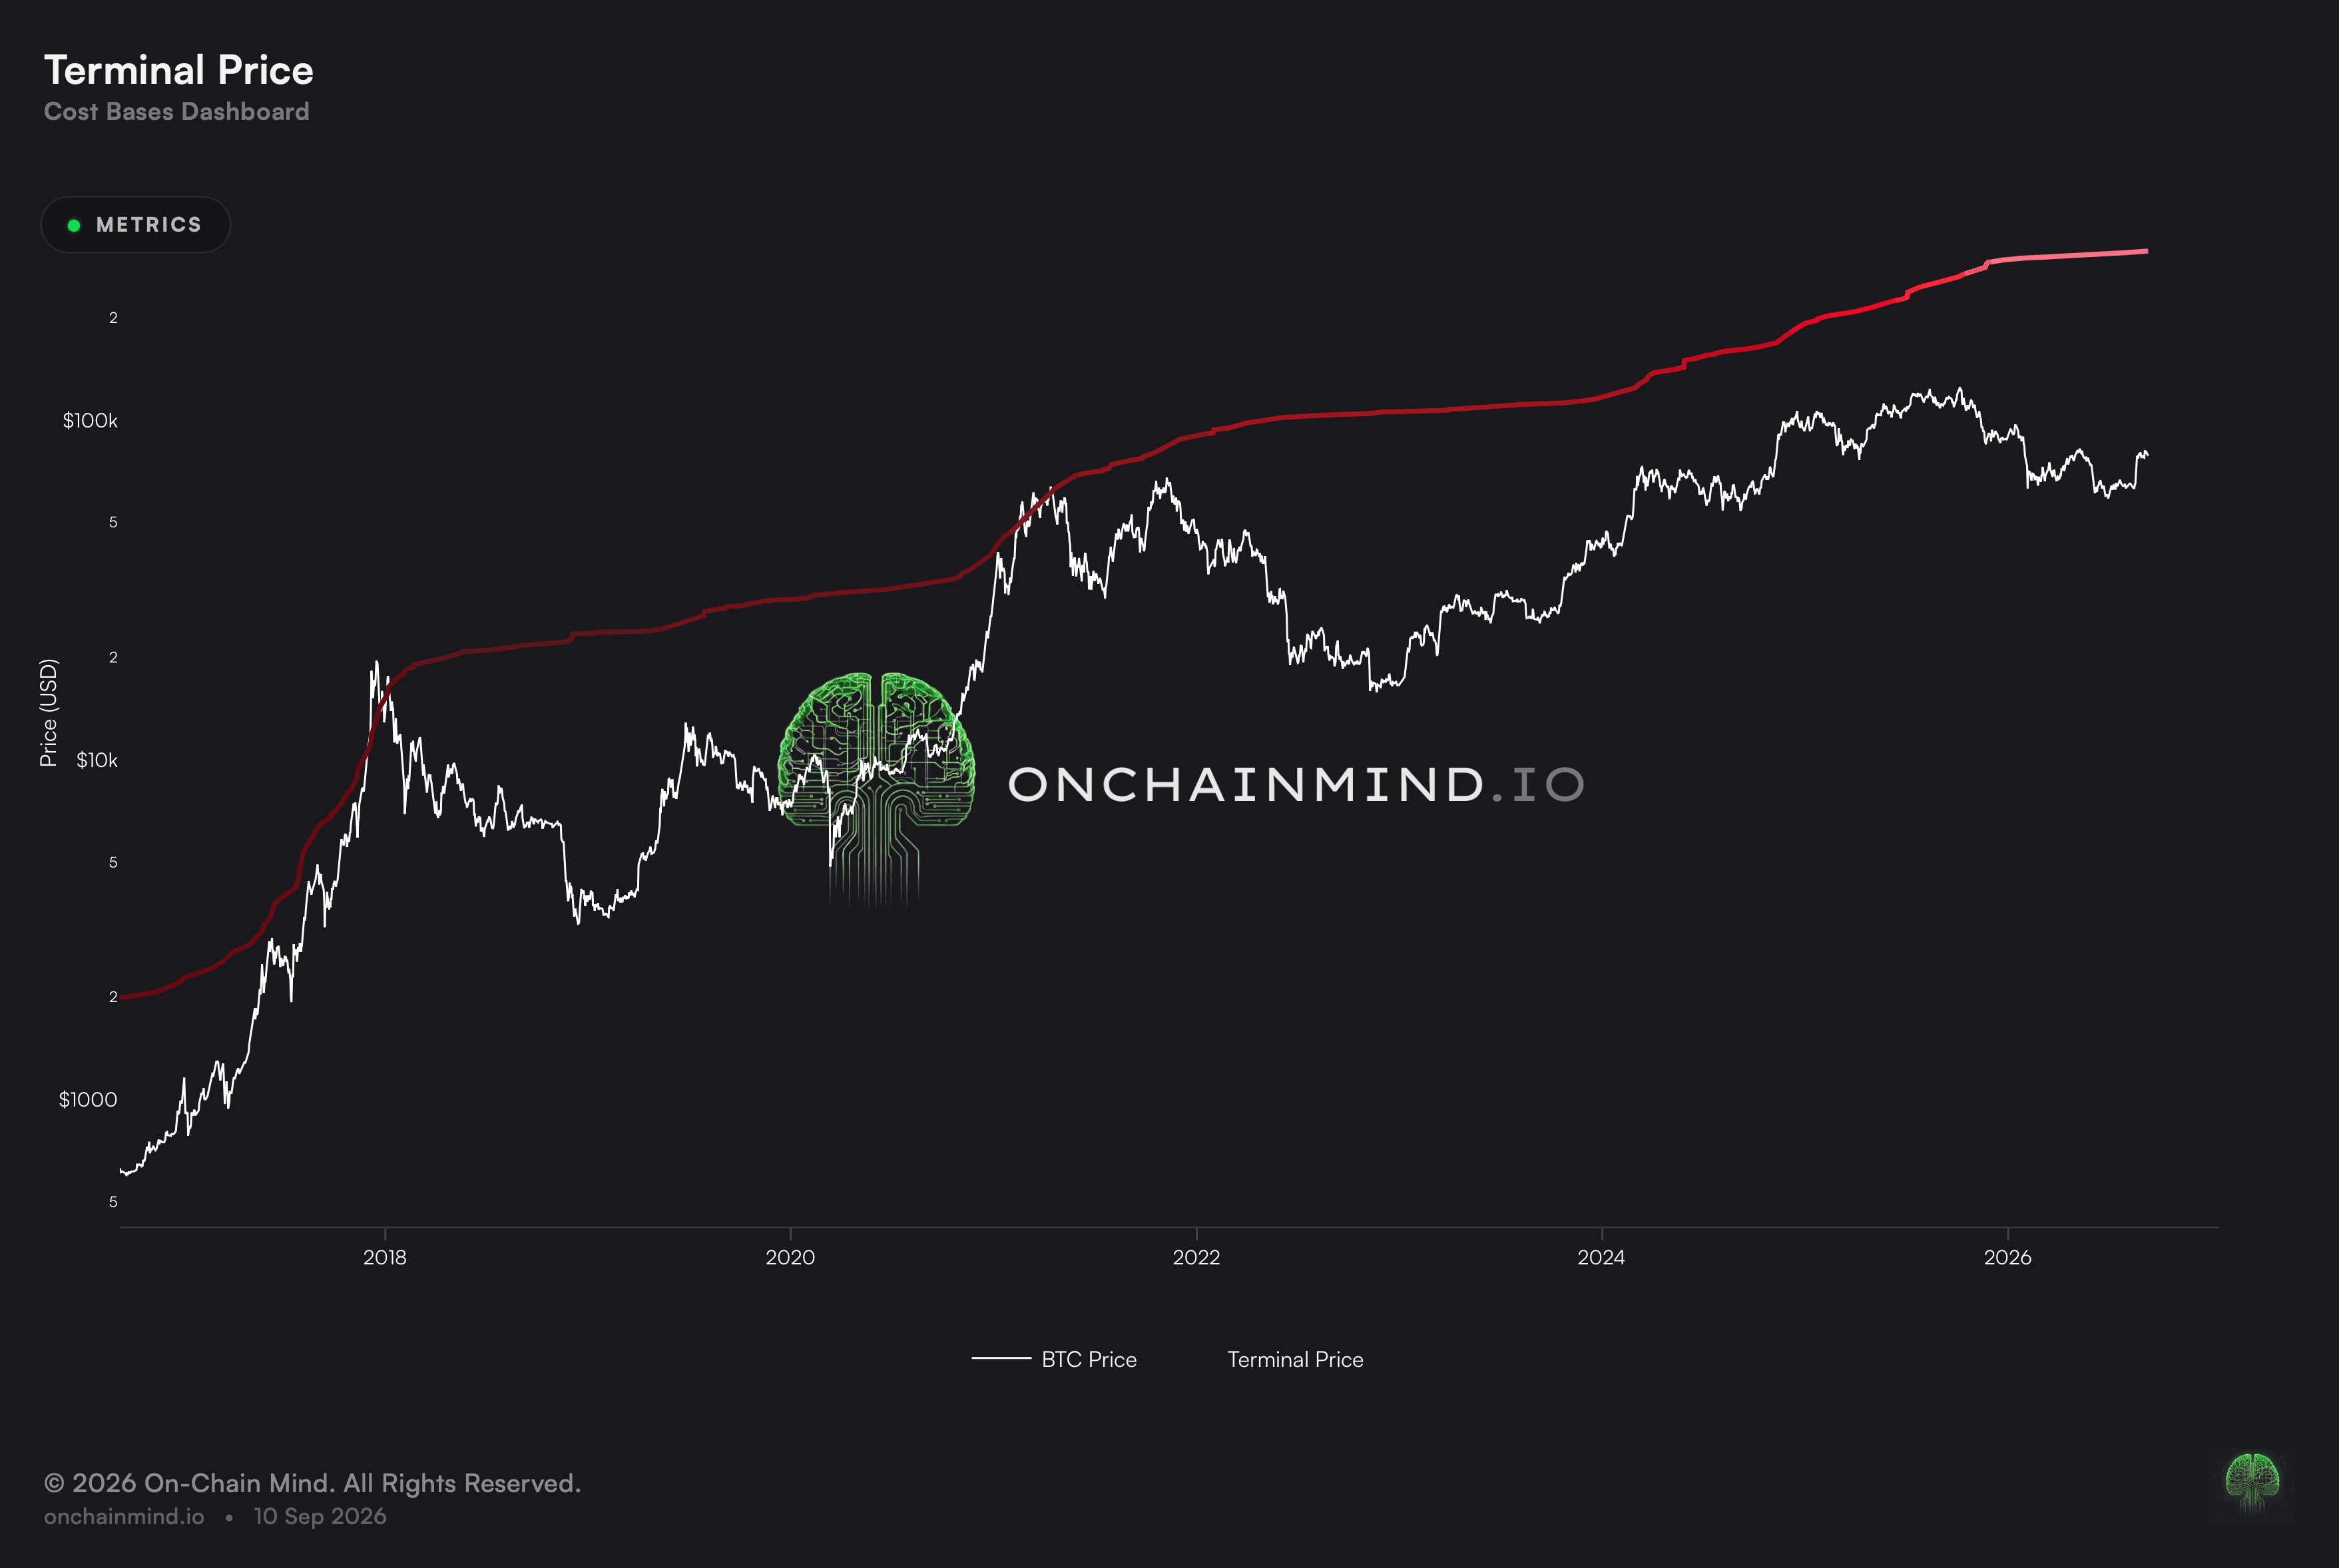
Terminal Price marks the upper end of the range. Climbs into it have arrived late, during the giddy closing stage of an advance, which makes it the mirror image of the floor models kept alongside it.
Price has only come near it at the top of a cycle. How far under it spot sits is a rough measure of how much room the model still allows, and that gap is the part worth reading.
What it actually measures
The model projects a ceiling from the network’s own activity rather than from chart shape. Because that activity keeps changing, the projection is a moving reference rather than a fixed level waiting to be hit.
Price beneath it is the ordinary condition of an advance. Price reaching it has coincided with the euphoric, distribution-prone phase that past cycles have ended in, which is rarely sustained for long.
It sits at the opposite end of the dashboard from the floor models, and it is worth noticing that the two ends are not symmetrical. Floors are levels the market falls to under pressure, while a ceiling is a level it has to be carried to by demand, and demand is the harder of the two to model.
The number today is not the number when price gets there
This is a projection, not a target. It moves as the network moves, so quoting a figure and waiting for price to arrive at it misunderstands what the line does. By the time price is anywhere near, the level will have changed.
The gap is the reading. How far beneath the projection price sits estimates the headroom the model still implies, and that estimate updates continuously. Anyone treating the current print as a destination is treating a moving reference as a fixed one.
Delta Top: a top model firing on its own has a poor record
The model marks a ceiling drawn from the network’s own valuation history rather than from price patterns. Price beneath it is the ordinary condition through most of a cycle, and the gap implies the upside the model still allows.
Individual top markers have called tops that did not arrive, and they have been reached well before the actual peak in cycles where they did. Any single one of them, acted on alone, has a record that would not survive scrutiny.
Convergence is what changes that. When several independent top references arrive in the same region at the same time, the signal is doing something no one of them does alone. Delta Top is built to be one input to that, and reading it in isolation throws away the part that works.
What it does not tell you
What it identifies is a neighbourhood, not a number. Earlier peaks formed somewhere around this line without landing on it, so exactness here is a trap, and the reading gets stronger when several upper markers gather in the same place.
The sample is also small and drawn from cycles with very different participants. Each prior top formed under a market structure that no longer exists, and a model fitted across a handful of them carries that fragility.
It also says nothing about time. A market can sit far beneath this level for years, and the headroom the model implies is not a statement that the headroom will be used.
How to read it
Far beneath Terminal Price. The gap is a rough gauge of the cycle headroom the model still implies.
Beneath Terminal Price. The ordinary condition through an advance.
Approaching Terminal Price. Price is entering the region past cycles have topped in.
At or through Terminal Price. A euphoric, distribution-risk condition that has rarely been sustained.
The Cost Bases dashboard draws Terminal Price alongside Delta Top, True Market Mean and Realised Price.
Common questions
What is Terminal Price for?
It marks the upper end of the range. Climbs into it have arrived late, during the giddy closing stage of an advance.
Can I treat it as a price target?
No. It is a projection that moves as the network does, so the figure today is not the figure when price arrives.
What should I read instead?
The gap. How far beneath it price sits estimates the headroom the model still implies, and that updates continuously.
How precise is it?
Not very, deliberately. Past peaks formed in its vicinity rather than at it, so it marks a region.
Why is Delta Top usually read with it?
Both mark the upper end. Terminal Price is the further and later of the two, Delta Top the nearer, and between them they fence off the ground earlier peaks were made on.
What is Delta Top?
The nearer of the two upper markers. Terminal Price sits further out, and the gap between them is the ground earlier peaks were made on.
Is the exact figure meaningful?
Not really. It marks a zone, and past peaks have formed either side of it.
ON-CHAIN METRIC
Terminal Price
A cycle-top reference that moves as the network does, so the number is never fixed.
Open the Cost Bases dashboard
Terminal Price marks the upper end of the range. Climbs into it have arrived late, during the giddy closing stage of an advance, which makes it the mirror image of the floor models kept alongside it.
Price has only come near it at the top of a cycle. How far under it spot sits is a rough measure of how much room the model still allows, and that gap is the part worth reading.
What it actually measures
The model projects a ceiling from the network’s own activity rather than from chart shape. Because that activity keeps changing, the projection is a moving reference rather than a fixed level waiting to be hit.
Price beneath it is the ordinary condition of an advance. Price reaching it has coincided with the euphoric, distribution-prone phase that past cycles have ended in, which is rarely sustained for long.
It sits at the opposite end of the dashboard from the floor models, and it is worth noticing that the two ends are not symmetrical. Floors are levels the market falls to under pressure, while a ceiling is a level it has to be carried to by demand, and demand is the harder of the two to model.
The number today is not the number when price gets there
This is a projection, not a target. It moves as the network moves, so quoting a figure and waiting for price to arrive at it misunderstands what the line does. By the time price is anywhere near, the level will have changed.
The gap is the reading. How far beneath the projection price sits estimates the headroom the model still implies, and that estimate updates continuously. Anyone treating the current print as a destination is treating a moving reference as a fixed one.
Delta Top: a top model firing on its own has a poor record
The model marks a ceiling drawn from the network’s own valuation history rather than from price patterns. Price beneath it is the ordinary condition through most of a cycle, and the gap implies the upside the model still allows.
Individual top markers have called tops that did not arrive, and they have been reached well before the actual peak in cycles where they did. Any single one of them, acted on alone, has a record that would not survive scrutiny.
Convergence is what changes that. When several independent top references arrive in the same region at the same time, the signal is doing something no one of them does alone. Delta Top is built to be one input to that, and reading it in isolation throws away the part that works.
What it does not tell you
What it identifies is a neighbourhood, not a number. Earlier peaks formed somewhere around this line without landing on it, so exactness here is a trap, and the reading gets stronger when several upper markers gather in the same place.
The sample is also small and drawn from cycles with very different participants. Each prior top formed under a market structure that no longer exists, and a model fitted across a handful of them carries that fragility.
It also says nothing about time. A market can sit far beneath this level for years, and the headroom the model implies is not a statement that the headroom will be used.
How to read it
Far beneath Terminal Price. The gap is a rough gauge of the cycle headroom the model still implies.
Beneath Terminal Price. The ordinary condition through an advance.
Approaching Terminal Price. Price is entering the region past cycles have topped in.
At or through Terminal Price. A euphoric, distribution-risk condition that has rarely been sustained.
The Cost Bases dashboard draws Terminal Price alongside Delta Top, True Market Mean and Realised Price.
Common questions
What is Terminal Price for?
It marks the upper end of the range. Climbs into it have arrived late, during the giddy closing stage of an advance.
Can I treat it as a price target?
No. It is a projection that moves as the network does, so the figure today is not the figure when price arrives.
What should I read instead?
The gap. How far beneath it price sits estimates the headroom the model still implies, and that updates continuously.
How precise is it?
Not very, deliberately. Past peaks formed in its vicinity rather than at it, so it marks a region.
Why is Delta Top usually read with it?
Both mark the upper end. Terminal Price is the further and later of the two, Delta Top the nearer, and between them they fence off the ground earlier peaks were made on.
What is Delta Top?
The nearer of the two upper markers. Terminal Price sits further out, and the gap between them is the ground earlier peaks were made on.
Is the exact figure meaningful?
Not really. It marks a zone, and past peaks have formed either side of it.