

ON-CHAIN METRIC
Velocity RSI
How persistent the pressure is, which is why it can stay pinned through a whole trend.
Open the Momentum dashboard
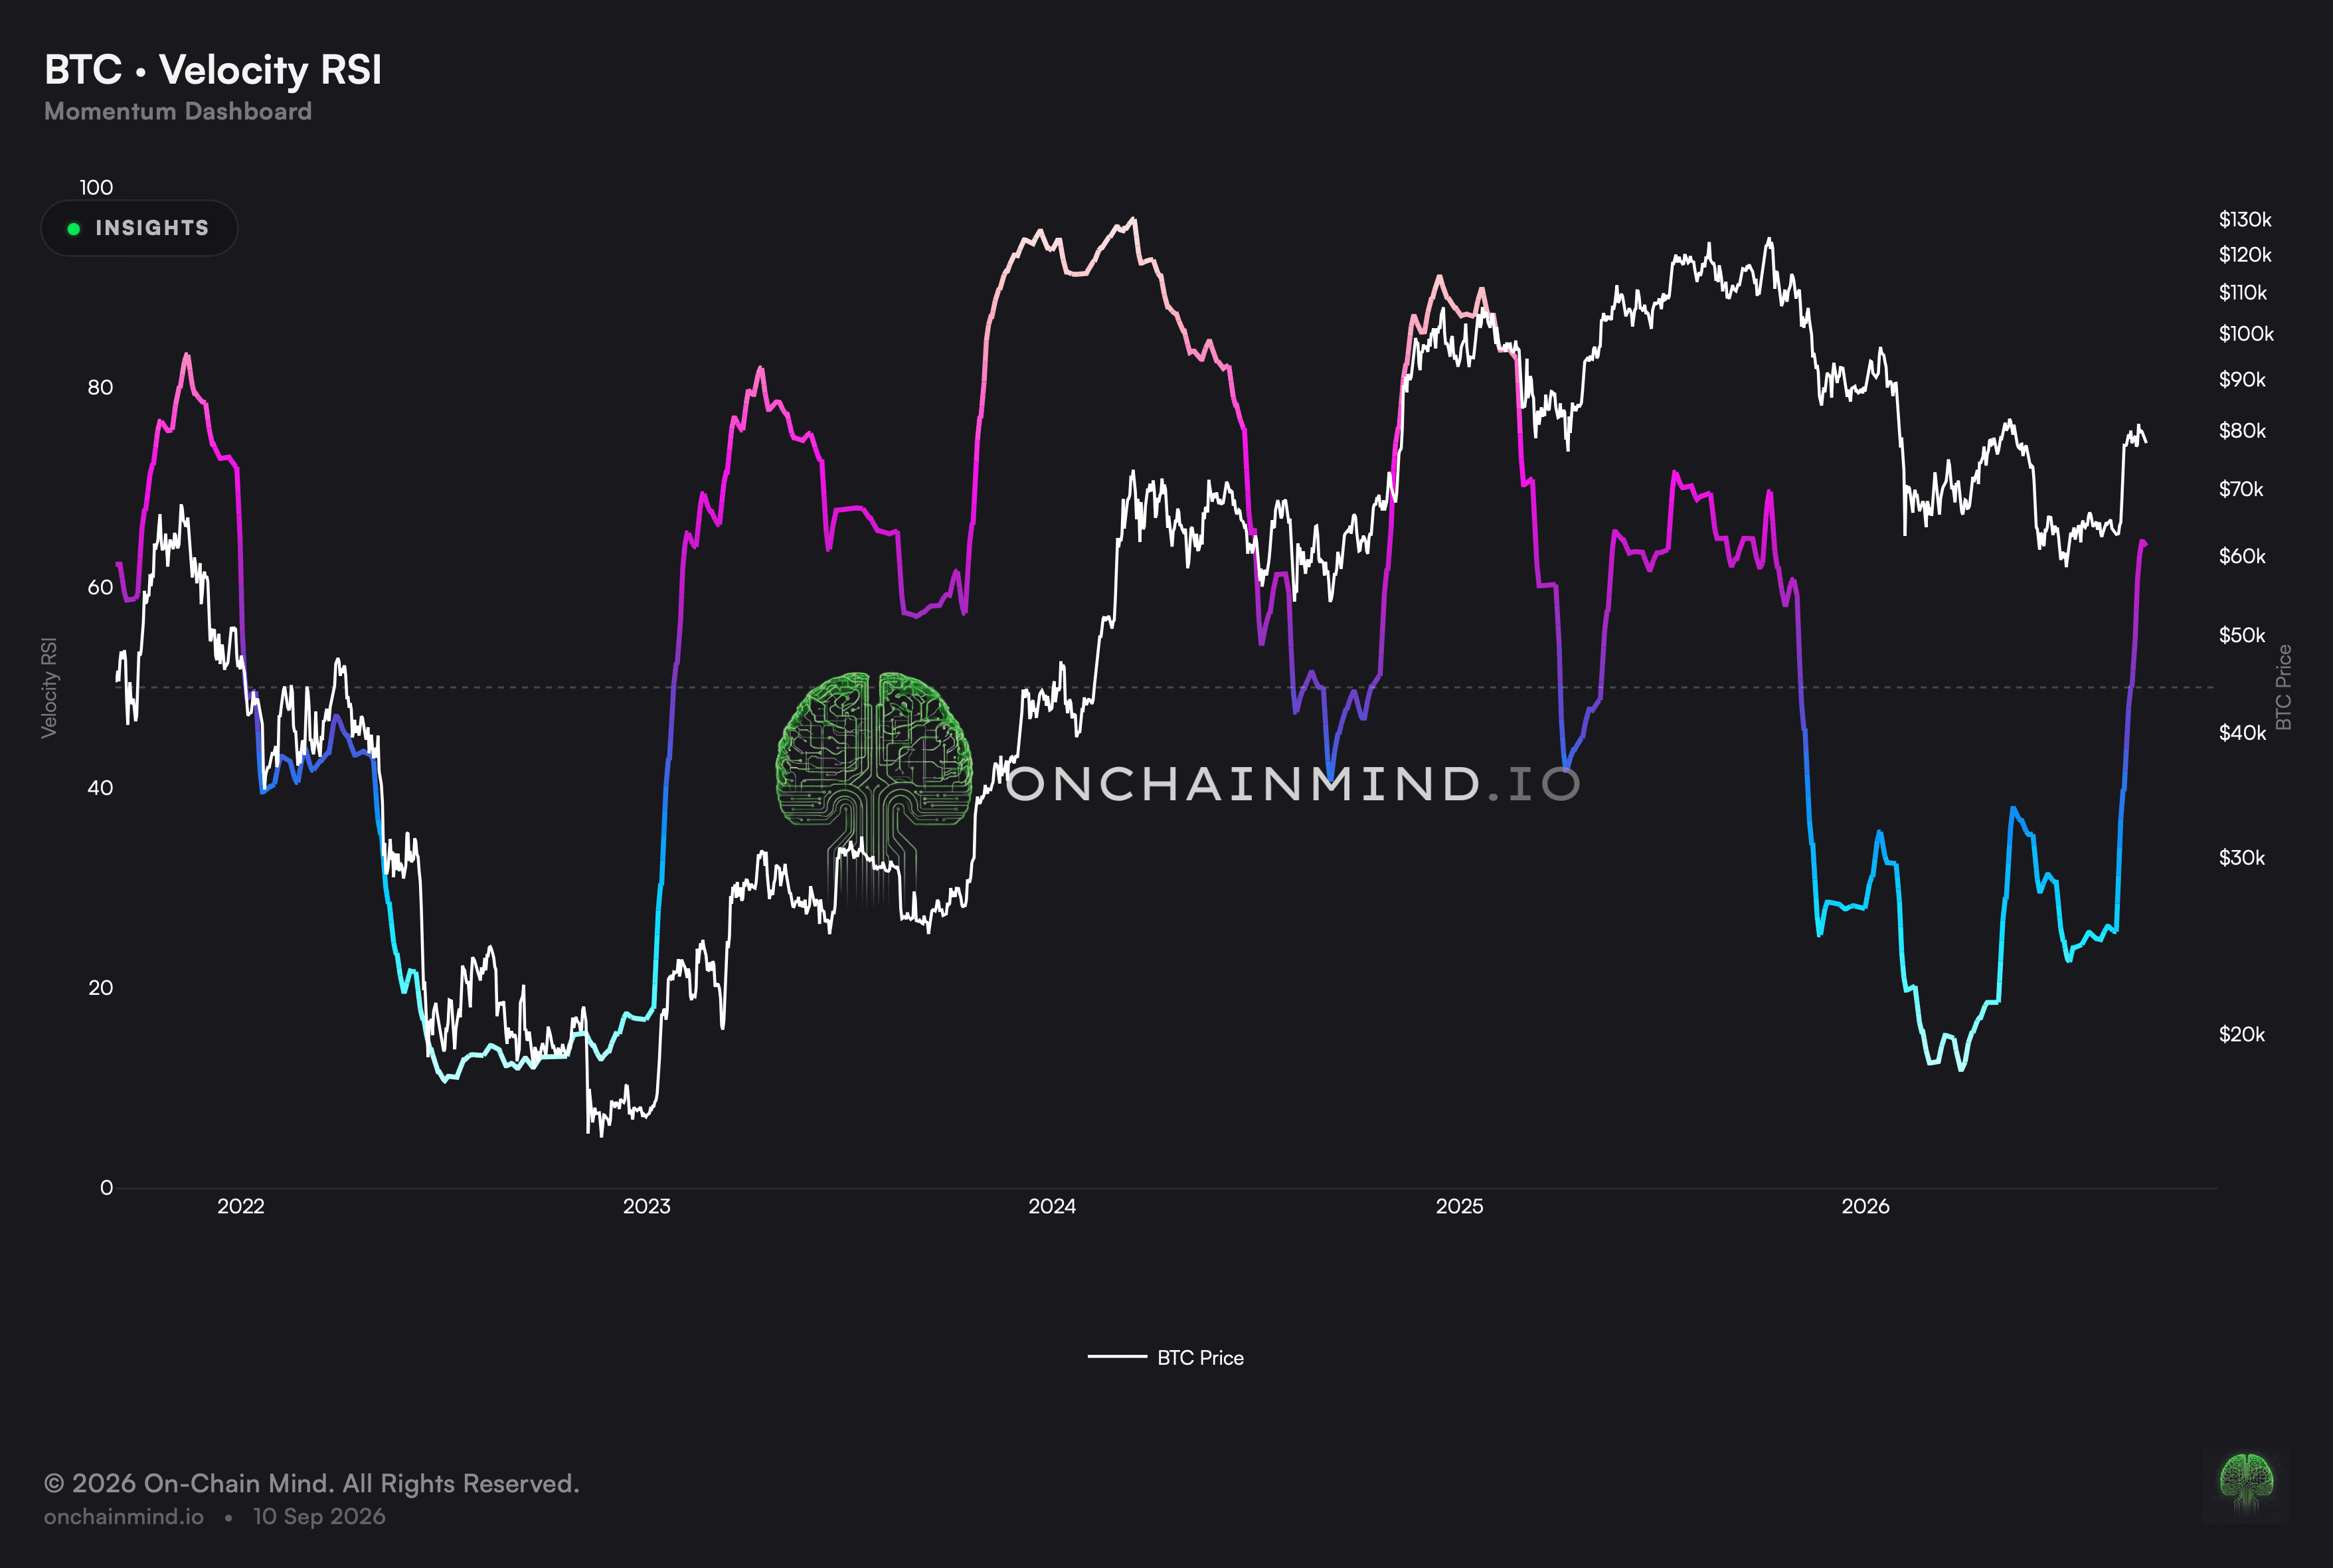
An ordinary relative strength index drifts back toward the middle as soon as price stretches, which makes it useless in a strong trend. This one reads how persistent the pressure behind the move is, so it can sit at an extreme for as long as the pressure lasts.
That changes what an extreme means. A pinned reading here is confirmation that the move has real force behind it, not a warning that it is about to end.
What it actually measures
The level is the least of it in ordinary conditions. Between the bands the reading is telling you very little, and the useful information is in what happens when it and price disagree.
A disagreement is price pushing to a fresh high or a fresh low that the reading refuses to match. That marks the pressure fading ahead of the price, which is the sequence worth catching.
The rank against the asset’s own record supplies the missing context. The same number describes a routine condition on one market and an unusual one on another, and only the ranking separates them.
An extreme that persists is telling you the opposite of exhaustion
The habit built on ordinary oscillators is to read an extreme as a warning. On this one, an extreme that holds is the signature of a trend with genuine pressure behind it, and selling into it has been an expensive reflex.
The warning comes from the reading refusing to follow price rather than from the reading being high. That distinction is the whole reason to keep a persistence measure alongside a stretch measure rather than treating them as versions of each other.
What it does not tell you
Disagreements resolve both ways. Pressure fading against a new high has preceded turns and has also simply resumed, and nothing at the time separates the two.
It needs a trend to be informative. In a range the reading crosses the middle repeatedly, and the disagreements it produces there are noise rather than warnings.
The measurement speed changes how many disagreements appear. A slower setting produces fewer and holds them longer; a faster one produces many, most of which mean nothing.
How to read it
Overbought. Sustained upward pressure. On this instrument that reads as confirmation more often than exhaustion.
Neutral. Ordinary pressure, where the disagreements matter more than the level.
Velocity Oversold. Downside pressure spent to an unusual degree, a state that has often come before sharp bounces.
Head for the Momentum dashboard, where Velocity RSI sits with Stochastic, Mean Reversion Oscillator and Coalescence.
Common questions
What makes this different from an ordinary strength index?
It asks how long the pressure lasts rather than how far price travelled, which is why it can hold at one end through an entire trend instead of drifting back the moment price stretches.
What is a disagreement worth watching?
Price setting a fresh high or low that this reading declines to match. It catches pressure draining away ahead of price, which is a sequence no price chart can display.
What does the ranking add?
Context that the raw number lacks. The same reading is routine on one market and remarkable on another, and ranking it against the asset’s own history is what separates those.
Is a pinned reading a warning?
Usually the reverse. Pressure that holds at an extreme is what a genuine trend looks like on this instrument, and the warning comes from the reading refusing to follow price.
What does changing the mode do?
It sets how quickly the underlying pressure is measured. A slower mode holds readings longer and suits the divergences this view exists for; a faster one produces more of them and most are noise.
ON-CHAIN METRIC
Velocity RSI
How persistent the pressure is, which is why it can stay pinned through a whole trend.
Open the Momentum dashboard
An ordinary relative strength index drifts back toward the middle as soon as price stretches, which makes it useless in a strong trend. This one reads how persistent the pressure behind the move is, so it can sit at an extreme for as long as the pressure lasts.
That changes what an extreme means. A pinned reading here is confirmation that the move has real force behind it, not a warning that it is about to end.
What it actually measures
The level is the least of it in ordinary conditions. Between the bands the reading is telling you very little, and the useful information is in what happens when it and price disagree.
A disagreement is price pushing to a fresh high or a fresh low that the reading refuses to match. That marks the pressure fading ahead of the price, which is the sequence worth catching.
The rank against the asset’s own record supplies the missing context. The same number describes a routine condition on one market and an unusual one on another, and only the ranking separates them.
An extreme that persists is telling you the opposite of exhaustion
The habit built on ordinary oscillators is to read an extreme as a warning. On this one, an extreme that holds is the signature of a trend with genuine pressure behind it, and selling into it has been an expensive reflex.
The warning comes from the reading refusing to follow price rather than from the reading being high. That distinction is the whole reason to keep a persistence measure alongside a stretch measure rather than treating them as versions of each other.
What it does not tell you
Disagreements resolve both ways. Pressure fading against a new high has preceded turns and has also simply resumed, and nothing at the time separates the two.
It needs a trend to be informative. In a range the reading crosses the middle repeatedly, and the disagreements it produces there are noise rather than warnings.
The measurement speed changes how many disagreements appear. A slower setting produces fewer and holds them longer; a faster one produces many, most of which mean nothing.
How to read it
Overbought. Sustained upward pressure. On this instrument that reads as confirmation more often than exhaustion.
Neutral. Ordinary pressure, where the disagreements matter more than the level.
Velocity Oversold. Downside pressure spent to an unusual degree, a state that has often come before sharp bounces.
Head for the Momentum dashboard, where Velocity RSI sits with Stochastic, Mean Reversion Oscillator and Coalescence.
Common questions
What makes this different from an ordinary strength index?
It asks how long the pressure lasts rather than how far price travelled, which is why it can hold at one end through an entire trend instead of drifting back the moment price stretches.
What is a disagreement worth watching?
Price setting a fresh high or low that this reading declines to match. It catches pressure draining away ahead of price, which is a sequence no price chart can display.
What does the ranking add?
Context that the raw number lacks. The same reading is routine on one market and remarkable on another, and ranking it against the asset’s own history is what separates those.
Is a pinned reading a warning?
Usually the reverse. Pressure that holds at an extreme is what a genuine trend looks like on this instrument, and the warning comes from the reading refusing to follow price.
What does changing the mode do?
It sets how quickly the underlying pressure is measured. A slower mode holds readings longer and suits the divergences this view exists for; a faster one produces more of them and most are noise.