

ON-CHAIN METRIC
Waterline
The price with as much supply sitting above it as below, split down the middle.
Open the Cost Bases dashboard
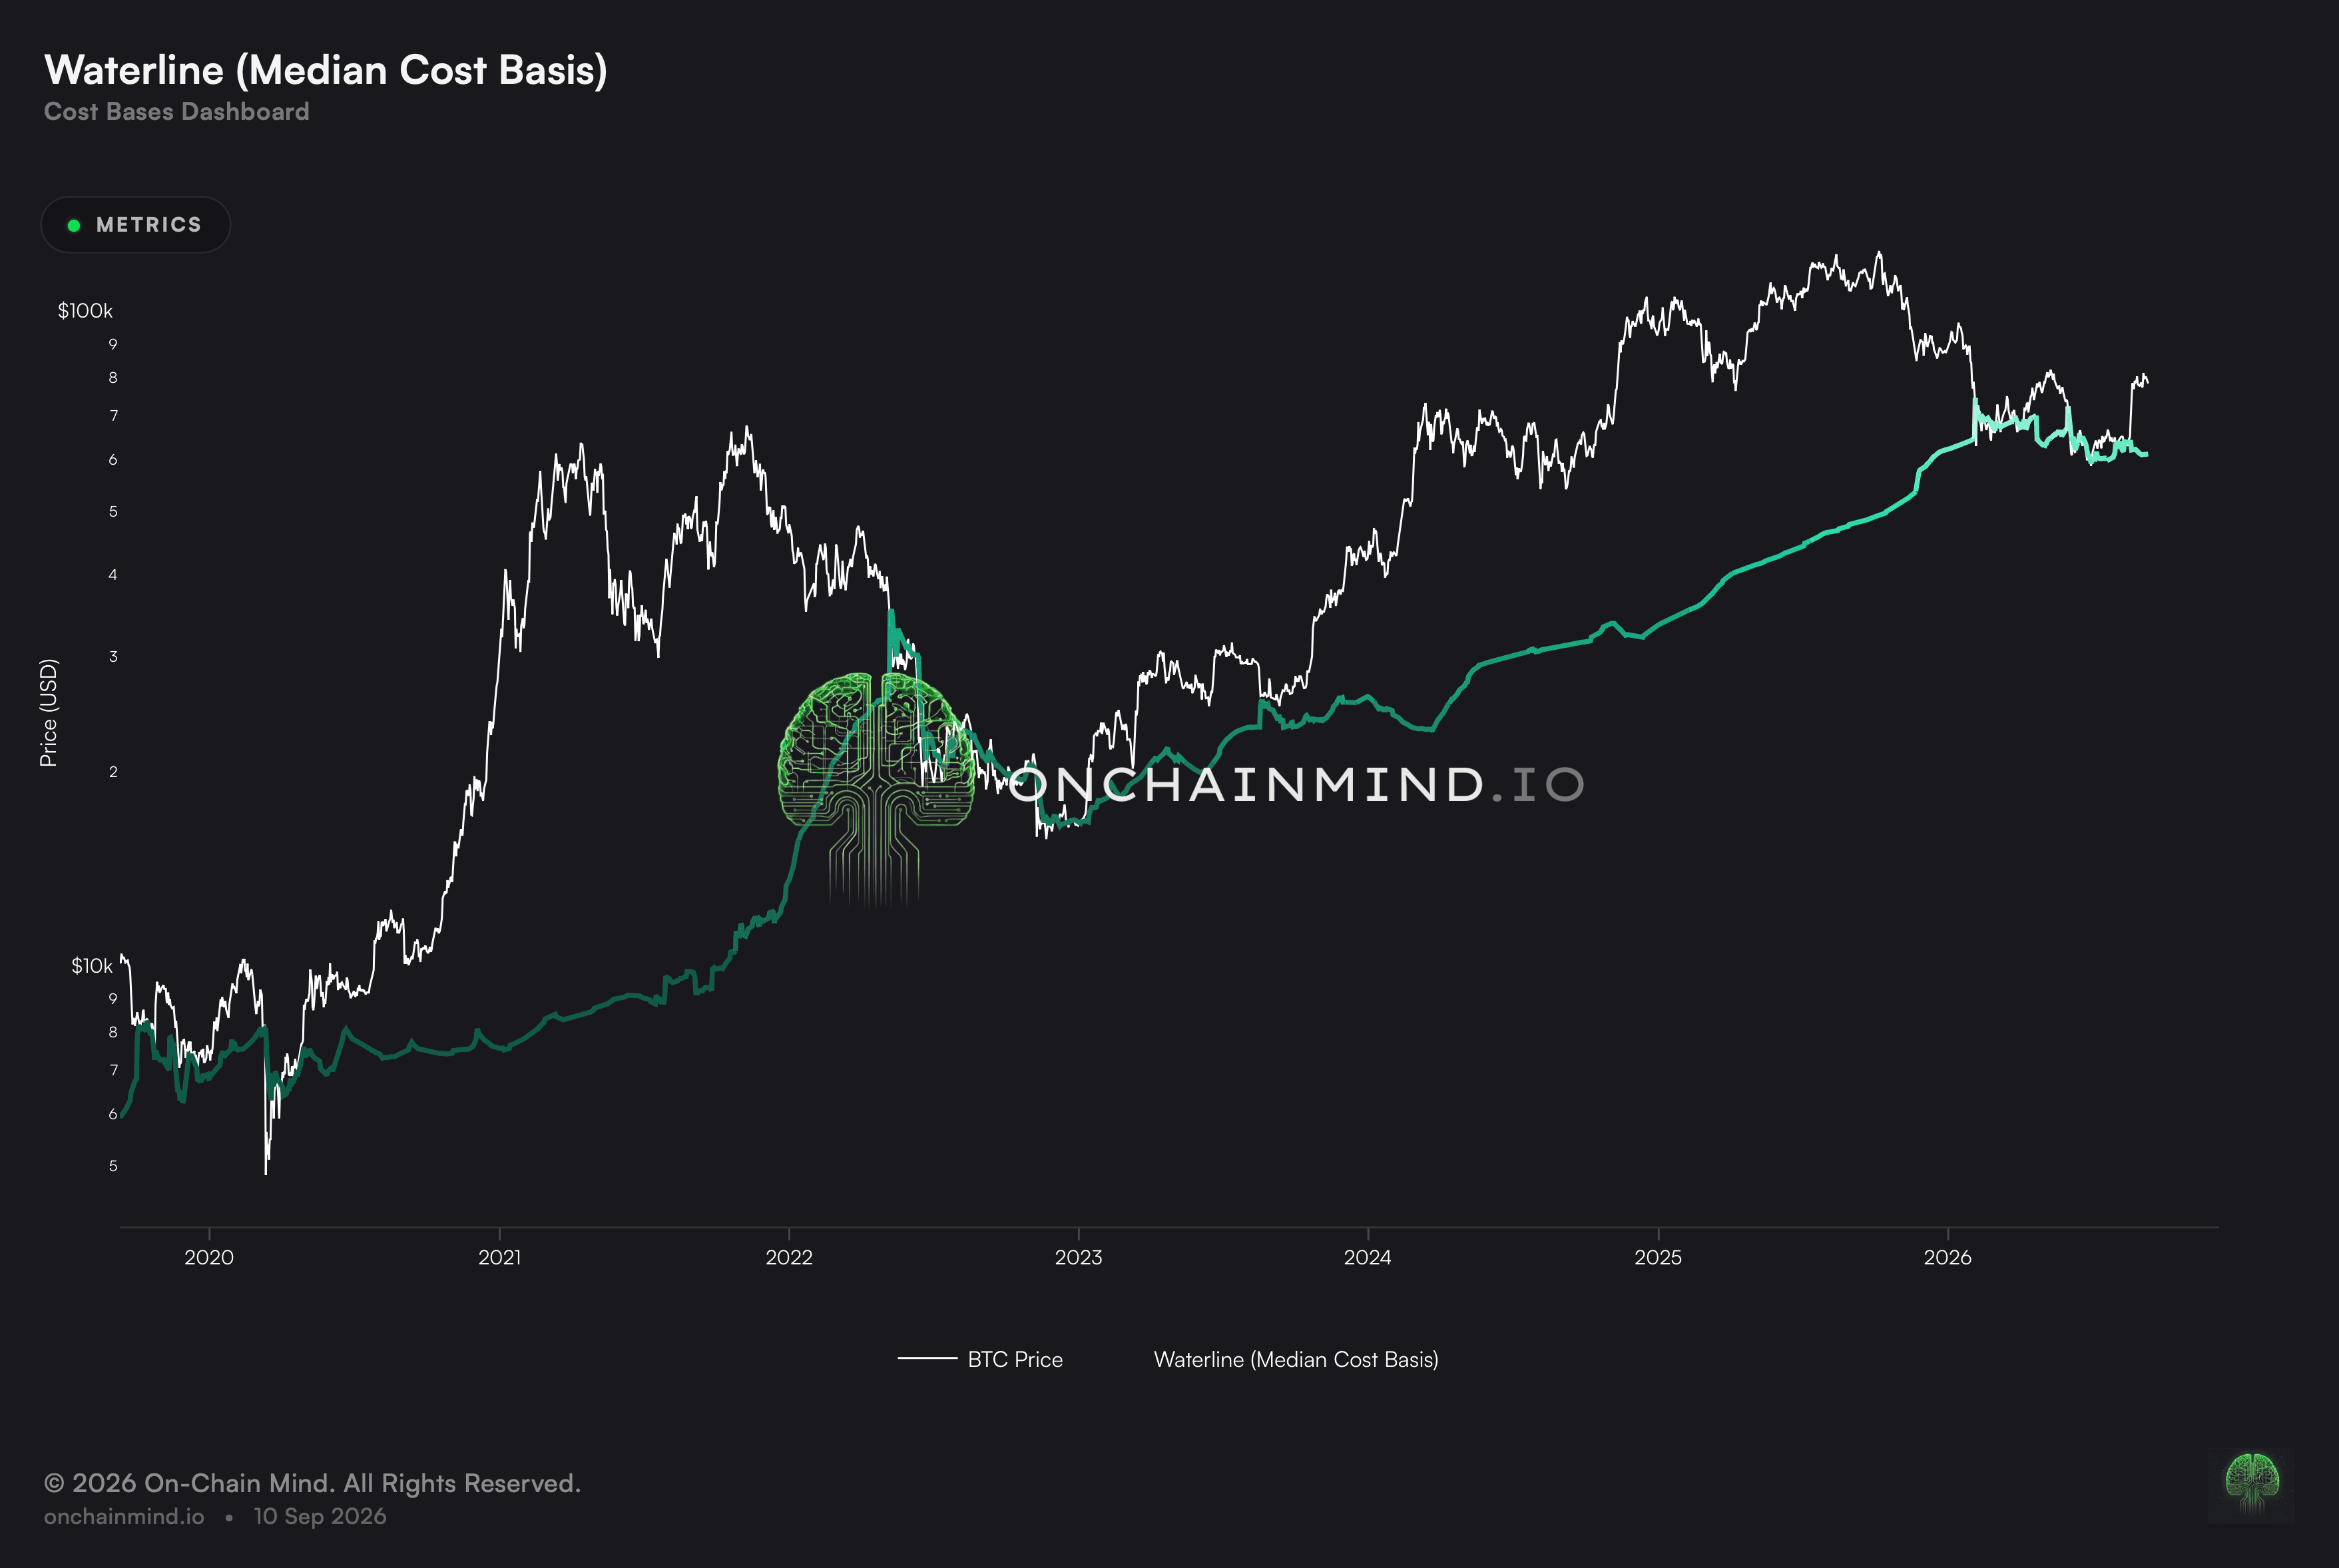
The Waterline picks out the price with as much supply above it as below, splitting the market down the middle on what was paid. As one-line answers to whether the market is winning or losing go, nothing is tidier.
Above it, most of the market is sitting on coins that cost less than spot does now, so the typical holder has a gain and nothing to cut. Below it, more than half paid more than spot, and the supply above becomes an overhang to work through.
What it actually measures
The level sorts the supply by what it paid and reports the middle. That makes it a statement about the typical coin rather than about the market’s total invested capital, and those are genuinely different things.
Because it answers a question with a yes or no shape, it reads more directly than most valuation levels. Either the typical holder is in profit or they are not, and the level says which without needing a range to be interpreted.
A median is not an average, and the gap between them is the point
A single vast block of old, cheap coins hauls the average a long way down while leaving the midpoint exactly where it was. The two levels can therefore sit far apart and both be correct, because they are answering different questions about the same supply.
That makes the Waterline the calmer reading whenever a considerable amount of very old supply is sitting in the background. When it and the aggregate cost basis disagree sharply, the disagreement is telling you how concentrated the cheap supply is, which neither level says on its own.
What it does not tell you
A median discards magnitude by design. It reports where the middle coin sits and says nothing about how far above or below the rest are, so a market clustered tightly around the level and one split between two extremes read identically here.
It also inherits every assumption in the underlying cost basis. Coins that moved for custody reasons carry a basis nobody chose, and they sit in the ordering exactly as deliberately bought coins do.
And it moves in steps rather than smoothly. Because the reading jumps to whatever the next coin in the ordering paid, a thin patch of supply near the middle can shift the level further than the underlying market has actually moved.
How to read it
Far above the Waterline. The typical holder sits on a comfortable gain and there is little cost-basis overhang immediately above.
Above the Waterline. More than half the supply is in profit, so the typical holder has no loss to realise.
Near the Waterline. The market is close to the point where half the supply flips between profit and loss.
Beneath the Waterline. More than half the supply paid more than spot, and that supply sits above as overhang.
Look for The Waterline on the Cost Bases dashboard, beside Realised Price, Conviction Price and Overhead Price.
Common questions
What does the Waterline measure?
The price with as much supply sitting above it as below, splitting the market down the middle on what was paid.
Why use a median instead of an average?
Because one large cluster of old cheap coins pulls an average down without moving the median. The median answers where the typical coin sits.
What does a wide gap from the aggregate cost basis mean?
That the cheap supply is concentrated. The size of the disagreement is itself a reading on how the supply is distributed.
Does it say how underwater the market is?
No. It reports which side of the line the middle coin sits on, not how far anything is from it.
Is crossing it a signal?
It is a change of state rather than a trigger. The typical holder flipping between profit and loss matters, and the crossing gives no view on what follows.
ON-CHAIN METRIC
Waterline
The price with as much supply sitting above it as below, split down the middle.
Open the Cost Bases dashboard
The Waterline picks out the price with as much supply above it as below, splitting the market down the middle on what was paid. As one-line answers to whether the market is winning or losing go, nothing is tidier.
Above it, most of the market is sitting on coins that cost less than spot does now, so the typical holder has a gain and nothing to cut. Below it, more than half paid more than spot, and the supply above becomes an overhang to work through.
What it actually measures
The level sorts the supply by what it paid and reports the middle. That makes it a statement about the typical coin rather than about the market’s total invested capital, and those are genuinely different things.
Because it answers a question with a yes or no shape, it reads more directly than most valuation levels. Either the typical holder is in profit or they are not, and the level says which without needing a range to be interpreted.
A median is not an average, and the gap between them is the point
A single vast block of old, cheap coins hauls the average a long way down while leaving the midpoint exactly where it was. The two levels can therefore sit far apart and both be correct, because they are answering different questions about the same supply.
That makes the Waterline the calmer reading whenever a considerable amount of very old supply is sitting in the background. When it and the aggregate cost basis disagree sharply, the disagreement is telling you how concentrated the cheap supply is, which neither level says on its own.
What it does not tell you
A median discards magnitude by design. It reports where the middle coin sits and says nothing about how far above or below the rest are, so a market clustered tightly around the level and one split between two extremes read identically here.
It also inherits every assumption in the underlying cost basis. Coins that moved for custody reasons carry a basis nobody chose, and they sit in the ordering exactly as deliberately bought coins do.
And it moves in steps rather than smoothly. Because the reading jumps to whatever the next coin in the ordering paid, a thin patch of supply near the middle can shift the level further than the underlying market has actually moved.
How to read it
Far above the Waterline. The typical holder sits on a comfortable gain and there is little cost-basis overhang immediately above.
Above the Waterline. More than half the supply is in profit, so the typical holder has no loss to realise.
Near the Waterline. The market is close to the point where half the supply flips between profit and loss.
Beneath the Waterline. More than half the supply paid more than spot, and that supply sits above as overhang.
Look for The Waterline on the Cost Bases dashboard, beside Realised Price, Conviction Price and Overhead Price.
Common questions
What does the Waterline measure?
The price with as much supply sitting above it as below, splitting the market down the middle on what was paid.
Why use a median instead of an average?
Because one large cluster of old cheap coins pulls an average down without moving the median. The median answers where the typical coin sits.
What does a wide gap from the aggregate cost basis mean?
That the cheap supply is concentrated. The size of the disagreement is itself a reading on how the supply is distributed.
Does it say how underwater the market is?
No. It reports which side of the line the middle coin sits on, not how far anything is from it.
Is crossing it a signal?
It is a change of state rather than a trigger. The typical holder flipping between profit and loss matters, and the crossing gives no view on what follows.