
Almost every major decision in Bitcoin ultimately comes down to two numbers: profit and loss.
And right now, Bitcoin is sitting in one of the most consequential P&L zones we have seen in years. A little over 62% of the supply is in profit, the MVRV is still stuck well below its yearly trend, and on-chain losses are still outpacing profits.
The real question is not whether pain exists. That much is obvious. It is whether this is the kind of pain that marks a generational bottom, or the kind that still has further to run.
Let’s get into it.
Key insights
Most Holders Are Still in Profit: Around 62% of Bitcoin supply remains profitable, but historically that is already unusually low.
The Pain Is Concentrated in Recent Buyers: Short-Term Holders are deeply underwater, while Long-Term Holders remain relatively resilient.
MVRV Suggests Bitcoin Is Still Cheap: Current readings sit in the 32nd percentile, indicating significant historical undervaluation for Bitcoin.
Capitulation Is Happening, But Slowly: Loss-taking is rotating from 1-3 month holders up into the 6-12 month cohort, a classic mid-to-late-stage pattern.
The Incentive (Unrealised Profit and Loss)
To understand where Bitcoin is going, we must first understand the psychological state of those who hold it.
At any given moment, every single Satoshi in existence is sitting in one of two states: profit or loss. This is not just a binary accounting metric; it is the primary incentive structure that dictates market all liquidity.
Firstly, there are two flavours of profit and loss worth separating. “Unrealised” P&L is the paper position: what every holder would realise if they sold right now. It is the incentive layer, the psychological pressure sitting on top of the market.
“Realised” P&L is what has actually been locked in on-chain. One is temptation, the other is action.
Right now, roughly 62% of total Bitcoin supply is in profit. That is about 12.5 million coins above their cost basis, with the remaining 7.5 million sitting underwater. At first glance that might look healthy. If two thirds of the network is still in profit, surely we cannot be deep in a bear market?
But 62% is lower than it sounds. Historically, proper bear market bottoms have tended to occur when only 50-55% of supply is in profit.
And here is the context that really matters: Bitcoin spends roughly 93% of all trading days above the 50% threshold. When readings push anywhere near that zone, they are genuinely rare, and those rare moments have historically coincided with some of the best entry opportunities of an entire cycle.

View live in OCM Studio: Total Unrealised P&L
Splitting the network between Short-Term Holders (under 155 days) and Long-Term Holders (beyond that) sharpens the picture. Around 62% of Short-Term Holders are in a loss, against just 28% of Long-Term Holders.
That concentration is expected: the recent buyers near the top are absorbing almost all of the pain.
Here is the subtle point though. Short-Term Holders are not the group to watch most closely. They slide in and out of profit and loss throughout almost every bear market, and their behaviour is emotional. The more important signal is what the Long-Term Holders do. When they begin moving into loss in meaningful size, that is when the market is usually edging towards true capitulation.
At 28%, we are not yet there. Historical bottoming zones have seen closer to 40% of LTHs in a loss. That suggests one of two paths:
Either price falls further and pushes more long-term holders underwater, or
We grind sideways long enough that today’s underwater buyers graduate into the Long-Term Holder cohort and lift the loss percentage naturally.
I lean more heavily towards the second path.
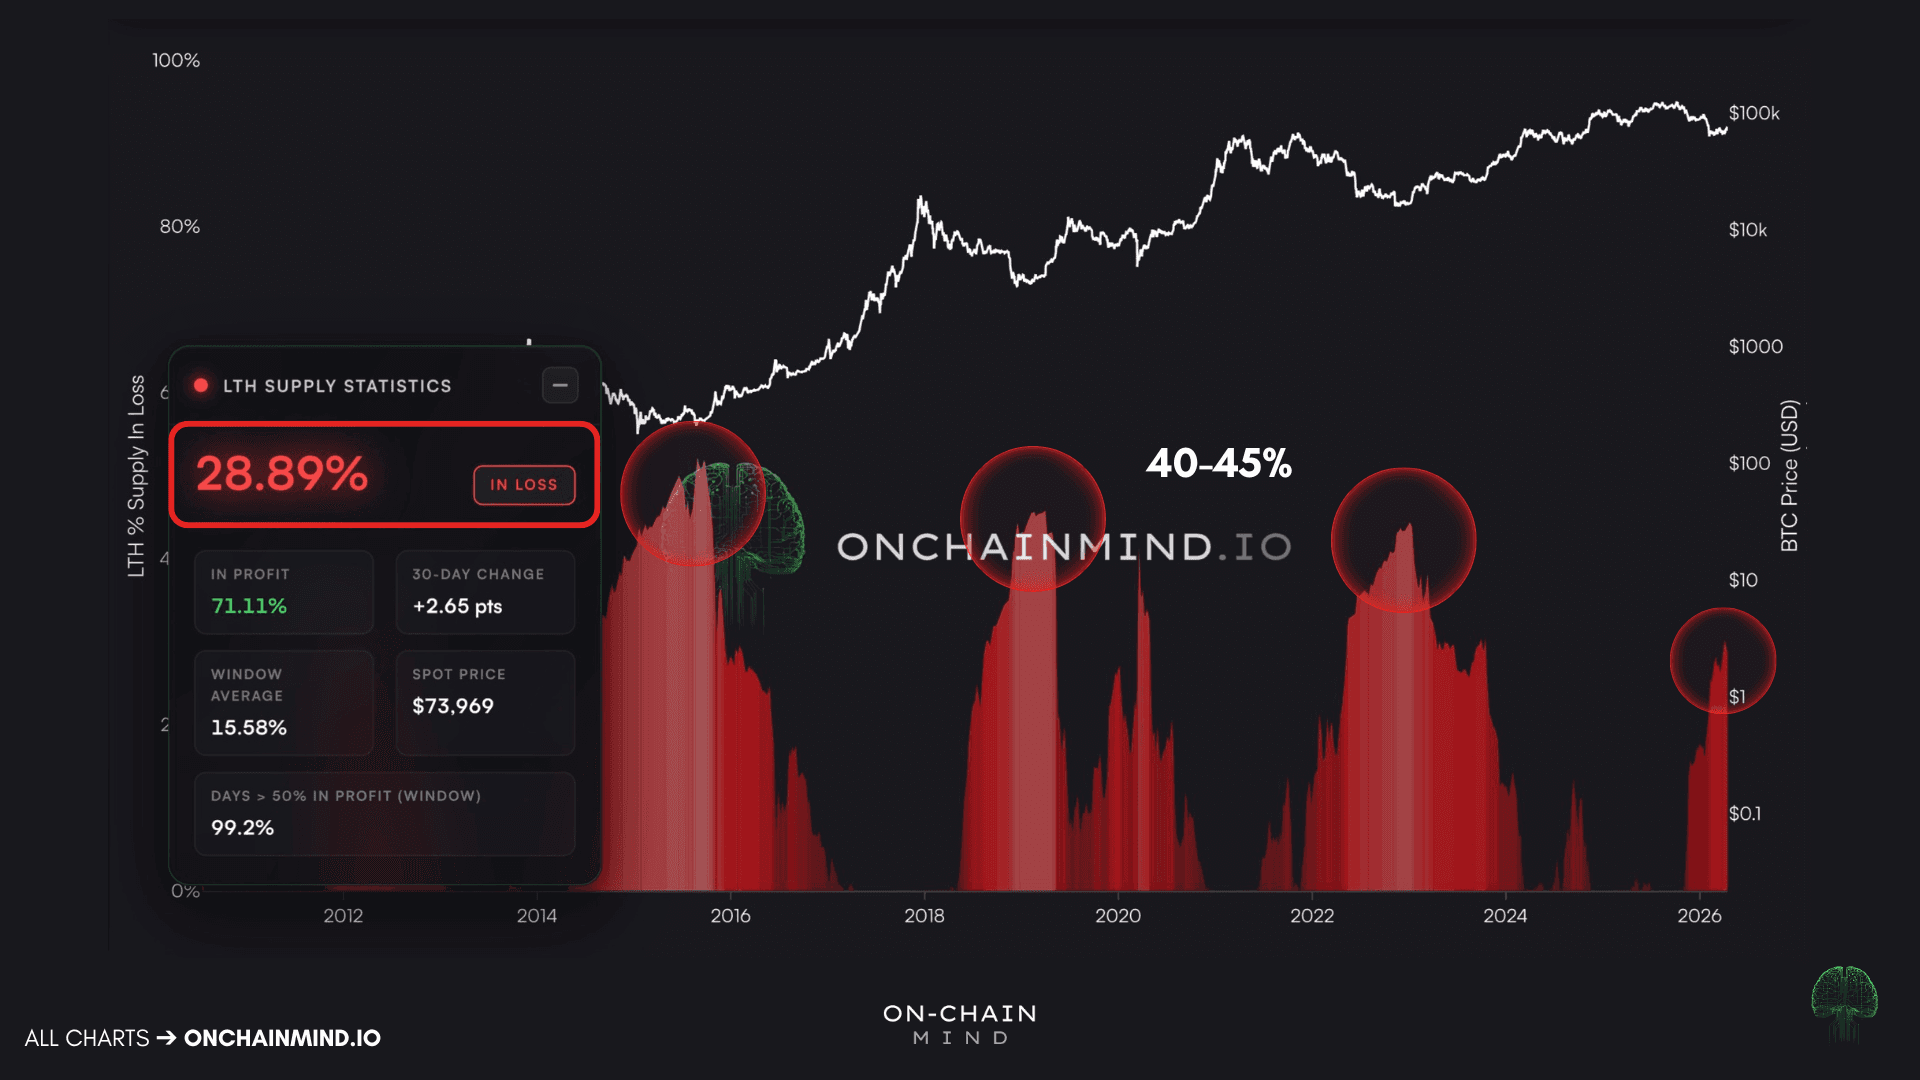
View live in OCM Studio: LTH Unrealised Loss
Another tool in the unrealised camp, and arguably the most famous in all of on-chain analytics, is the MVRV ratio.
The ratio effectively tells you how much aggregate unrealised profit or loss sits across the entire network. High MVRV means holders are sitting on large gains, and the market is vulnerable to profit-taking. Low MVRV means profits are thin or absent, which historically marks attractive value.
Right now MVRV is 1.37, meaning the market value of the network is only about 37% higher than its realised value.
That may sound substantial, but it is subdued in historical terms, sitting in the 32nd percentile of all days, meaning 68% of all trading days in history has shown more aggregate unrealised profit than today. These readings tend to cluster around poor sentiment and low confidence.
The most interesting use of MVRV is not the raw reading though. It is the relationship between MVRV and its own one-year moving average. When MVRV crosses back above its yearly average, it has been one of the cleanest signals that a bull market is genuinely returning. We saw it in 2012, 2015, 2019, and 2023. Each crossover followed a painful reset and marked a durable turn.
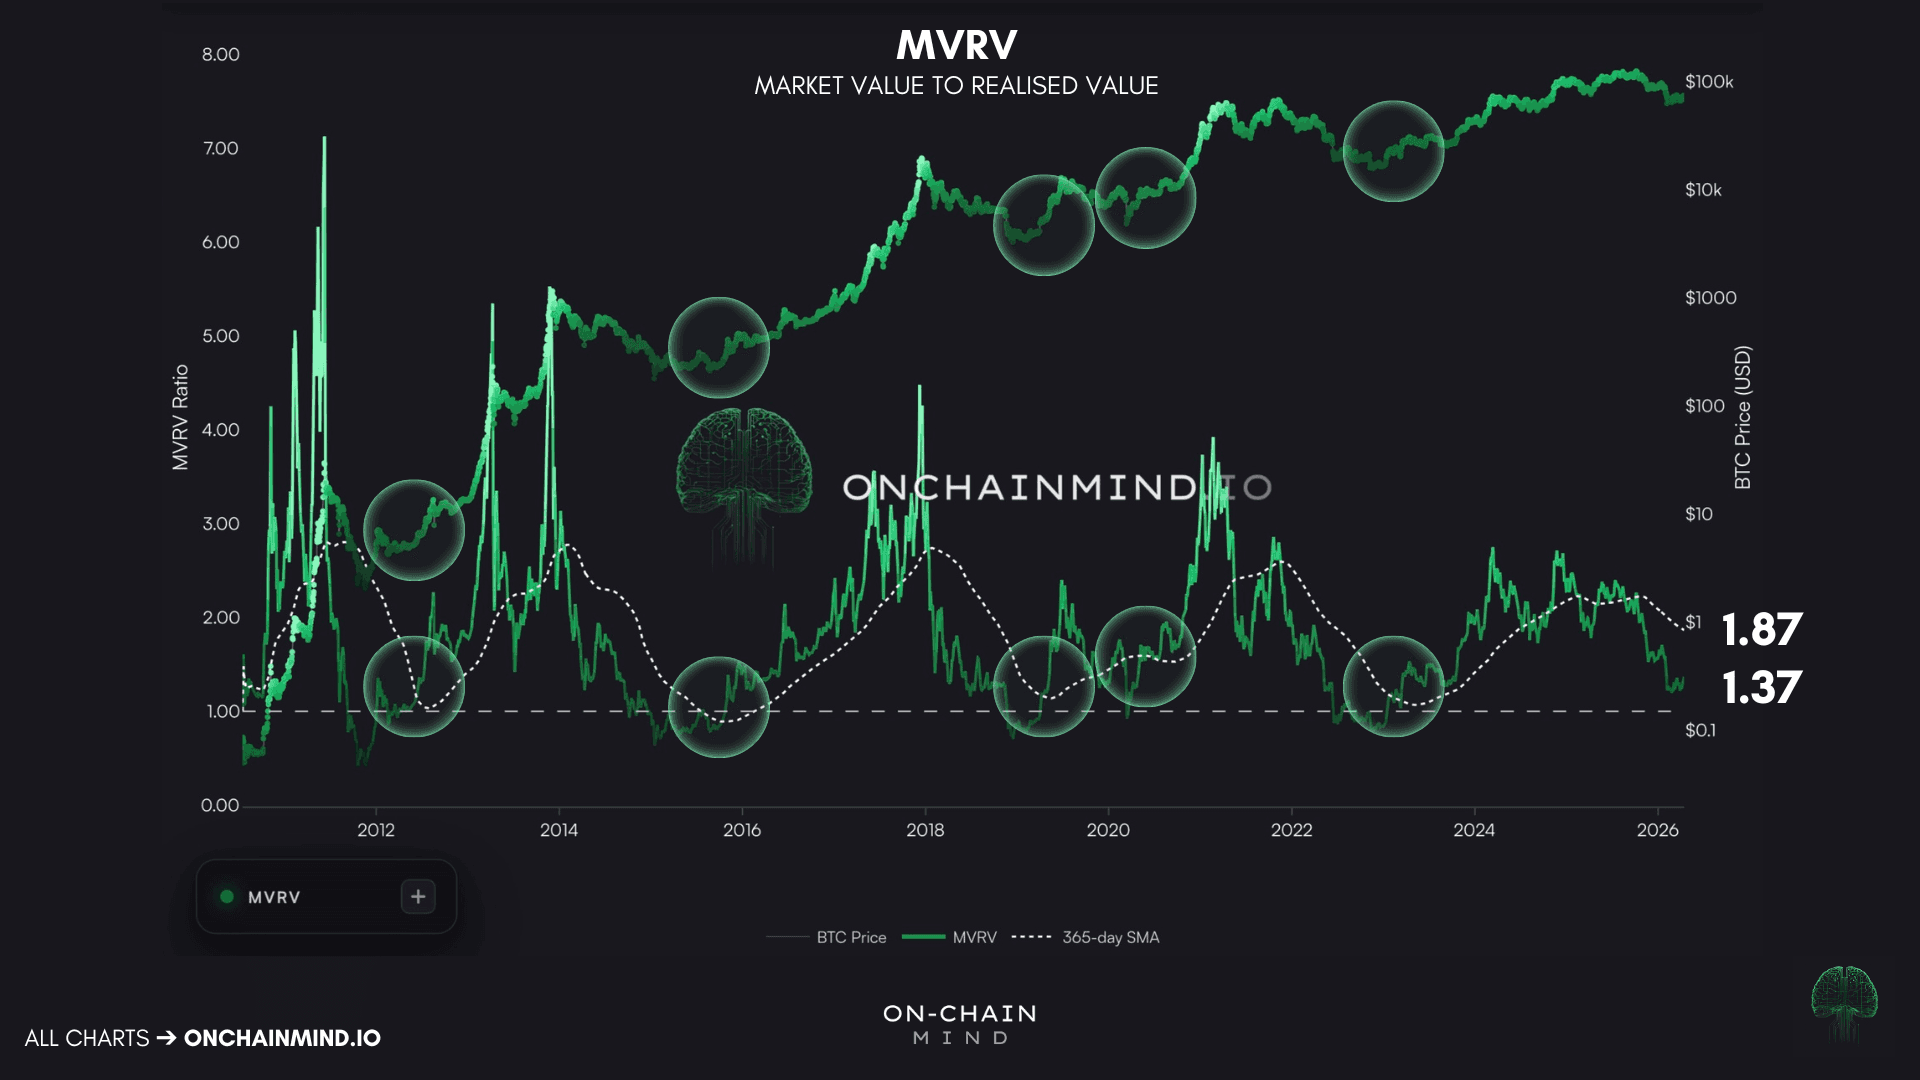
View live in OCM Studio: MVRV vs. 365D MA
Today, we are still below. The yearly average sits around 1.87, while spot MVRV is at 1.37. For that gap to close, one of two things has to happen:
Either Bitcoin rallies hard enough to pull MVRV back above the average, or
Bitcoin consolidates long enough that the moving average drifts lower to meet the current reading.
Again, as I said before, I lean towards the second scenario. Even though that is the boring take, a longer sideways grind feels more likely than a sharp vertical rally from here.
The Action (Realised Profit and Loss)
If unrealised P&L is the incentive, then realised P&L is what happens when that incentive tips people over the edge.
It is one thing to sit on a paper loss, but it is quite another to press sell and lock it in. When holders do that at scale, it tells us something meaningful.
The metric to focus on here is the Net Realised Profit and Loss: the daily net of all profit-taking minus all loss-taking on-chain.
What is remarkable about this cycle is that in dollar terms, we have just lived through the largest net realised losses in Bitcoin’s history. Around February, the network was printing close to $1 billion dollars per day of net realised losses. A truly monumental washout event.
But here is where on-chain analysis gets nuanced. Dollar-denominated losses inevitably look larger in each new cycle, because the network itself is larger. Bitcoin today is a completely different beast to Bitcoin in 2018. A cleaner lens is to measure realised losses in BTC terms. That strips out the distortion of Bitcoin’s own growth.
When we do that, the picture shifts. Yes, there was a major realised loss event, and at its worst the network realised more than 13,000 BTC per day. Still a large number. But in previous bear markets, spikes of 30,000-40,000 BTC per day were common at floors.
So in BTC terms, this cycle’s capitulation is nowhere near as extreme as history suggests on the surface.
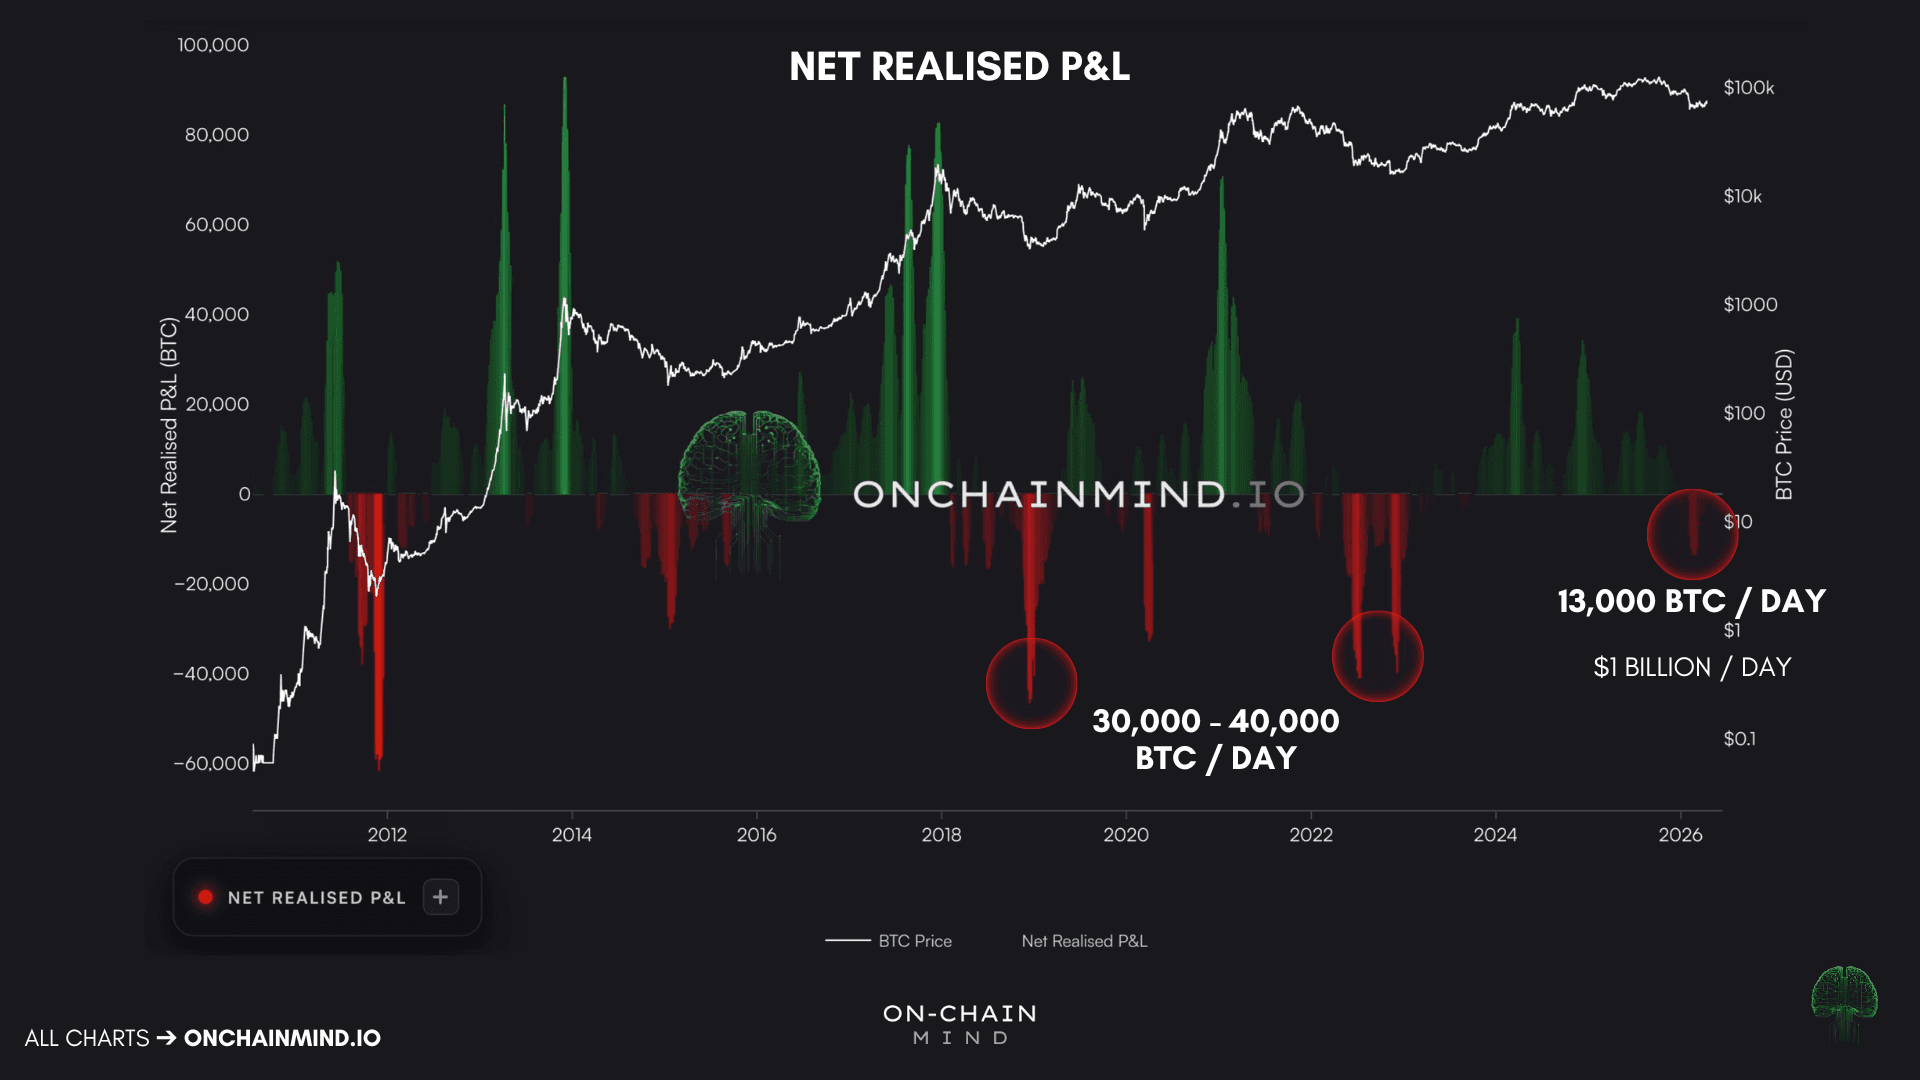
View live in OCM Studio: Net Realised P&L (BTC)
That raises a few philosophical questions:
Is there more pain still to come?
Is the Bitcoin holder base becoming smarter and more resilient?
More institutions, more cycle-aware retail, fewer people willing to sell at a loss. Nobody has a clean answer, and anyone who claims otherwise is overreaching. But it’s still worth sitting with.
At the moment, the 30-day average still shows a net realised loss of around 2,300 BTC per day. The intensity has faded, but the regime is still loss-dominated.
Isolating realised losses specifically, around 7,000 BTC per day are being sold at a loss on a monthly basis. Through most of this bear market, the 3-6 month holders have led that selling, followed by the 1-3 month holders.
Newer, less experienced hands, behaving exactly as you would expect. People buy late, convinced price can only go higher. Price falls. They tell themselves they will hold. Price falls more. They panic near the lows.
But the cohort composition is shifting. The group realising the most losses now is the 6-month to 1-year cohort. Holders who have already sat through several months of drawdown are capitulating too.
On the surface, that might sound ominous. But actually, it is often exactly what you want to see near a bottom. Capitulation spreading from the newest buyers outwards into slightly more experienced cohorts is a classic signature of mid-to-late-stage bear markets.

View live in OCM Studio: Realised Loss by Cohort
The Waiting Room
Taken together, the profit and loss picture tells a reasonably coherent story, and it is worth being honest about what it actually implies rather than spinning it either way.
Bitcoin is clearly in a pain phase. Most recent buyers are underwater. Aggregate unrealised profits are subdued. MVRV remains below its yearly trend. Realised losses are still outpacing profits. All of that is consistent with a market in the middle-to-late stages of a broader reset, but not necessarily at the terminal low.
My honest view is that time, not additional price pain, is the more probable path from here.
Bitcoin probably needs to grind sideways for longer. Long enough for the yearly MVRV average to drift down to meet spot. Long enough for today’s underwater Short-Term Holders to age into Long-Term Holder status and push that cohort’s loss percentage up. Long enough for the remaining weak hands to flush out without a waterfall lower.
I have always believed that Bitcoin is more of a psychological experiment than a financial one. It is a system designed to transfer wealth from the impatient to the patient. Right now, the market is in a "waiting room" phase. We are seeing the slow, grinding work of foundation building.
That is the less dramatic outcome, but it is how durable foundations are built in Bitcoin. Cycles are not really about single capitulation candles or magic bottom prints. They are about slow, grinding redistribution, coins moving from hands that do not understand what they own into hands that do. That process is clearly underway. It is simply not finished yet.
The market cap of Bitcoin has reached a level of maturity where the volatility is naturally dampening. But the most dangerous thing you can do right now is mistake a lack of volatility for a lack of progress.
The foundation is being poured; you just have to wait for the concrete to dry.