
There is a level on the Bitcoin chart that has separated recovery from rejection in every single cycle.
Bitcoin just reclaimed it. But the reclaim itself is the least interesting part of the story.
What’s actually compelling is the behaviour underneath, because the on-chain footprint of this rally looks nothing like a typical bear market bounce, and the derivatives market is positioned in a way that historically fuels further upside rather than caps it.
Whether that translates into a genuine regime shift or just another painful tease depends almost entirely on what happens at one specific price zone over the next few weeks.
Let’s get into it.
Key insights
The Cost Basis Reclaim: Bitcoin has reclaimed the key on-chain zone that often separates bearish rejection from structural recovery.
Realised Losses Are Fading: Net realised profit and loss has flipped positive for the first time in over 5 months.
Holders Are Not Rushing To Sell: Profit-taking is muted, long-term holders aren’t distributing, and weak hands are being absorbed.
Futures Traders Got Trapped: Negative funding and heavy short liquidations suggest the rally moved directly against bearish positioning.
The Zone That Decides The Regime
The market is full of arbitrary levels. Round numbers, swing highs, fibs drawn after the fact. Most of it is noise. The $78,000-$79,000 zone is one of the few that has actual structural meaning, because two of the most important on-chain cost basis levels are sitting on top of each other right there.
The first is the Short-Term Holder Realised Price, the average cost basis of coins moved within the last 155 days. This cohort is the market's pressure gauge. Highest cost basis, lowest pain tolerance, shortest time horizon.
When price falls below their average, the entire cohort is underwater simultaneously and every bounce becomes an exit. When price reclaims it, that pressure releases all at once. Sellers-into-strength flip into hodlers-of-coins, and that single behavioural change is often what separates a failed rally from a real recovery.
The second is the True Market Mean, and this one is criminally underused. The standard Realised Price gives you the average cost basis of the entire Bitcoin supply. The problem is that not all supply is economically meaningful. Lost coins, dormant Satoshi-era wallets, addresses that haven't moved in over a decade. The True Market Mean strips out the dead weight and gives you the cost basis of coins that actually participate in the market.
When both levels converge, as they have now, the zone becomes one of the most important regions on the chart. Bitcoin has now broken back above it. That's exactly what you want to see. But a reclaim is not confirmation.
The real test is the retest, because resistance only becomes support once it's been challenged from above and held.
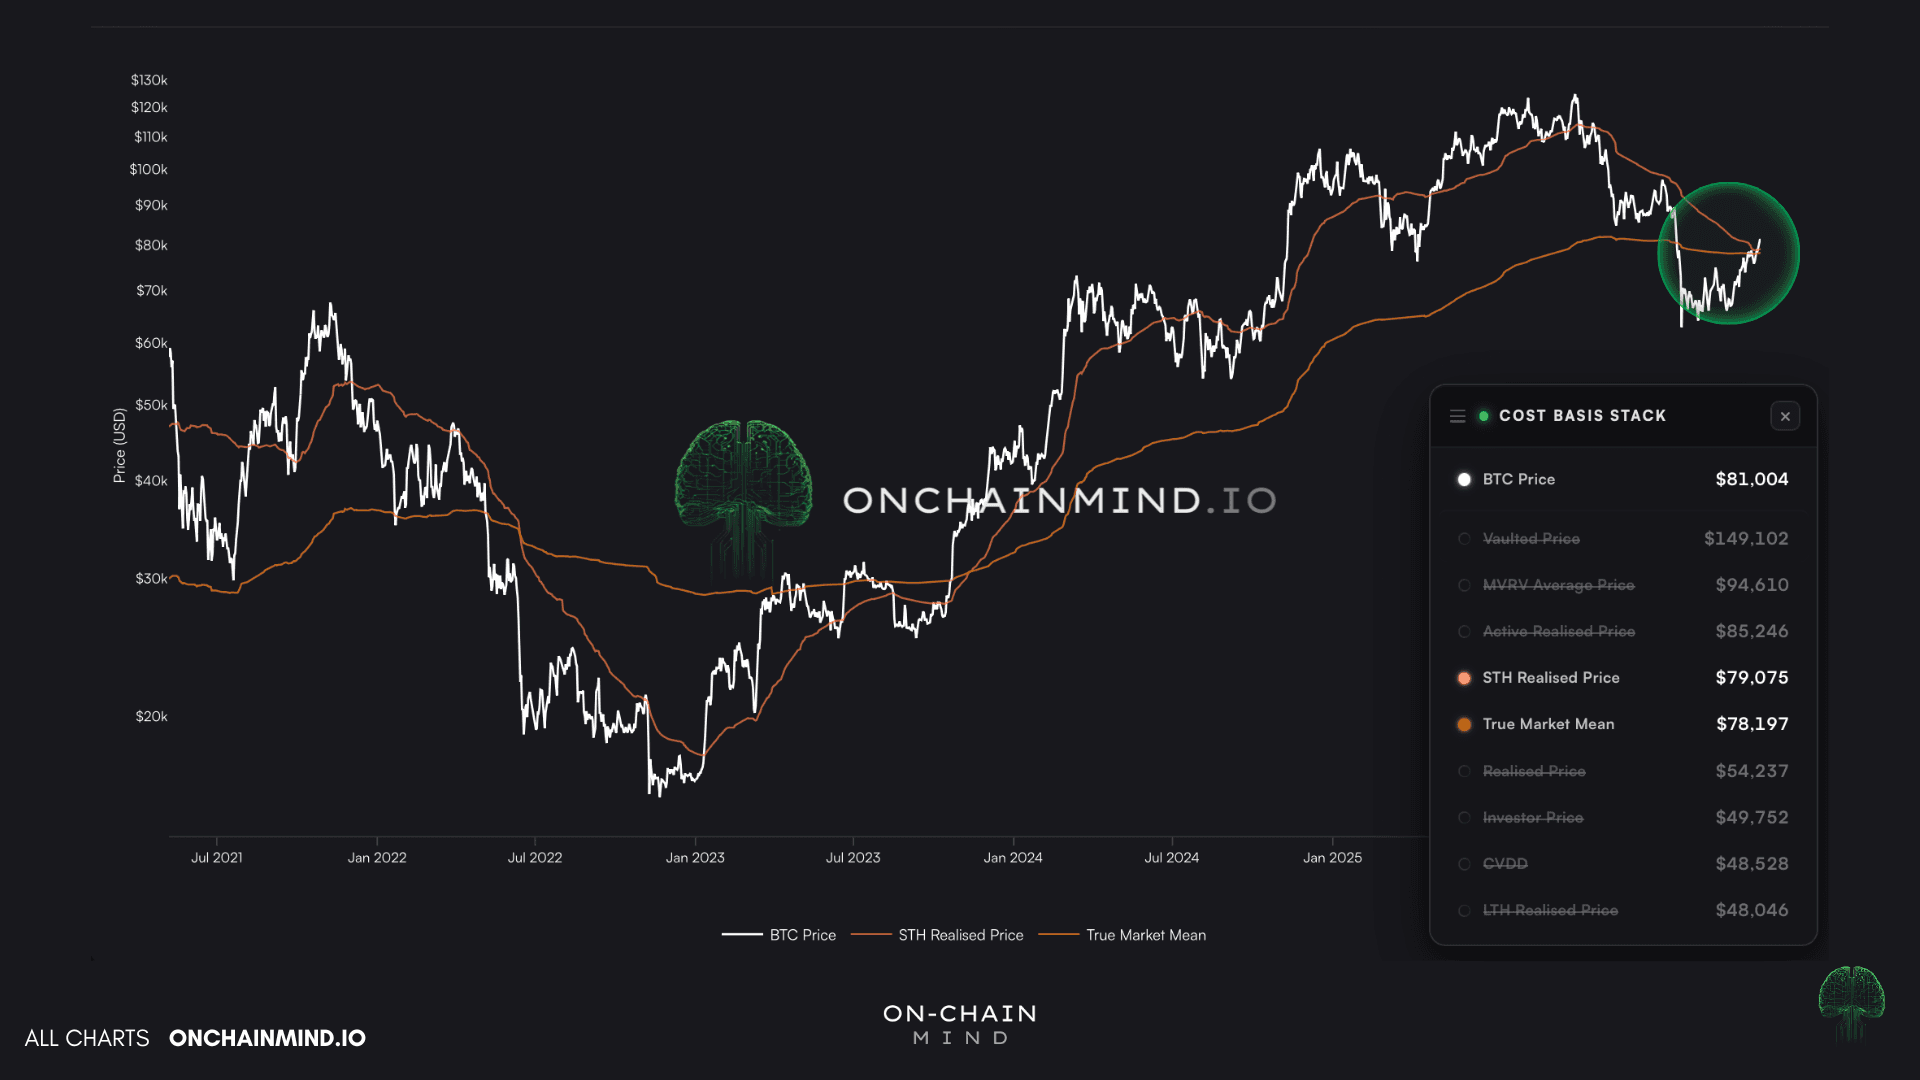
View live in OCM Studio: STH Realised Price & True Market Mean
The Flip That Marks the Turn
If I could only watch one on-chain metric to identify regime shifts, it would probably be the Net Realised Profit and Loss. And most people misunderstand this metric, so it’s worth being precise about what it actually measures.
This isn't paper gains or sentiment. It's the actual, on-chain, executed difference between the price a coin was last acquired at and the price it just spent at. It's the truest measure of investor behaviour we have, because it captures decisions that have already happened rather than positions that might be unwound.
Since December, Bitcoin has been in an unbroken net realised loss regime, which is the textbook fingerprint of a bear market. Investors who bought higher gradually capitulate, the thesis decays, the pain wins, and coins transfer from impatient hands to patient ones at progressively lower prices.
What's just happened is that this has flipped positive for the first time in over 5 months.
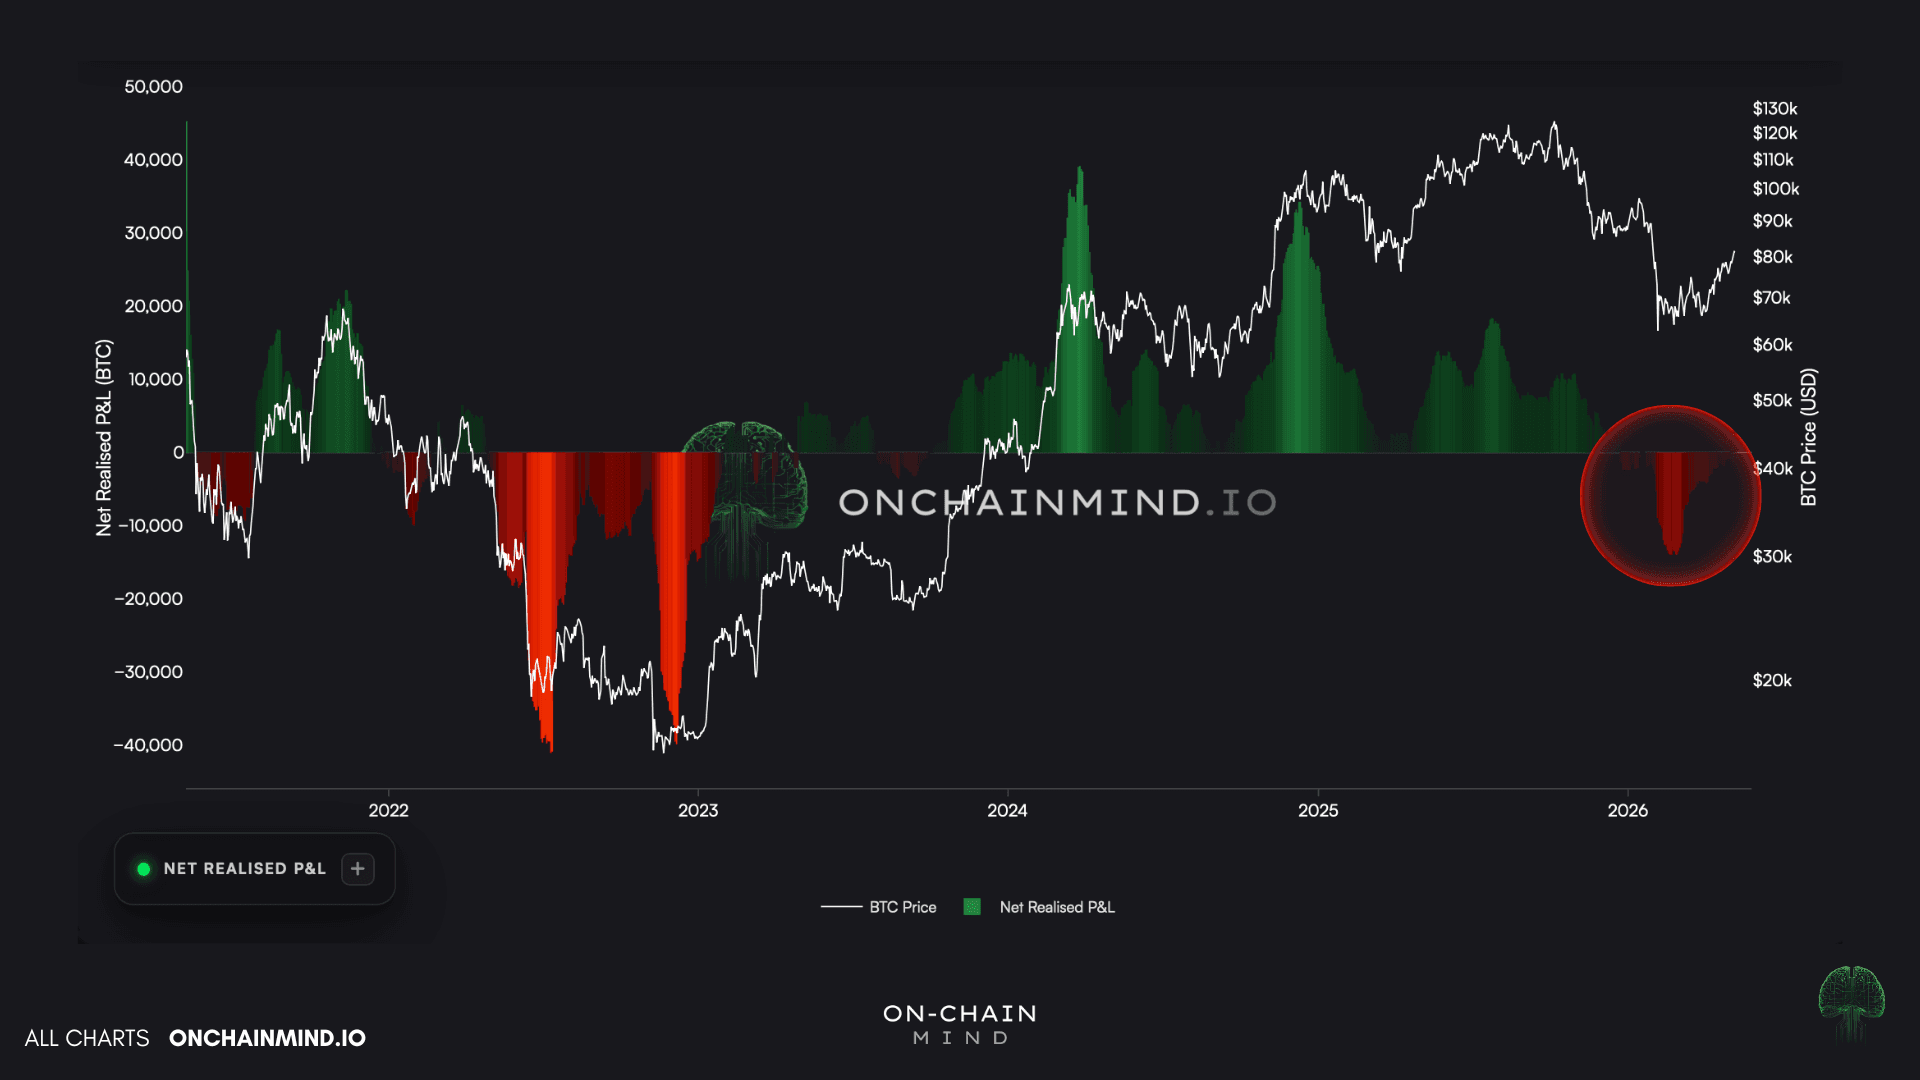
View live in OCM Studio: Net Realised Profit & Loss
That's a genuinely significant behavioural change, because it tells you forced selling has slowed, the cohort underwater has shrunk, and the market has recovered enough that participants can exit in green rather than red.
Historically, this exact flip has marked the recovery phase of every previous bear market in Bitcoin's history. It doesn't guarantee a new high, but it tells you the structural behaviour has potentially changed.
One nuance worth flagging that often gets overlooked. In dollar terms, this was the largest loss-taking bear market in Bitcoin's history. But measured in BTC terms, it was one of the most subdued capitulations on record.
The reason is mechanical rather than mysterious: Bitcoin has matured. The market cap is larger, the holder base is broader, and the institutional float is meaningfully bigger than in any previous cycle. The same percentage drawdown produces much larger dollar losses but proportionally smaller coin movement.
If you only ever look at USD-denominated metrics, you will consistently overstate the severity of bearish phases in mature cycles.
Always check both.
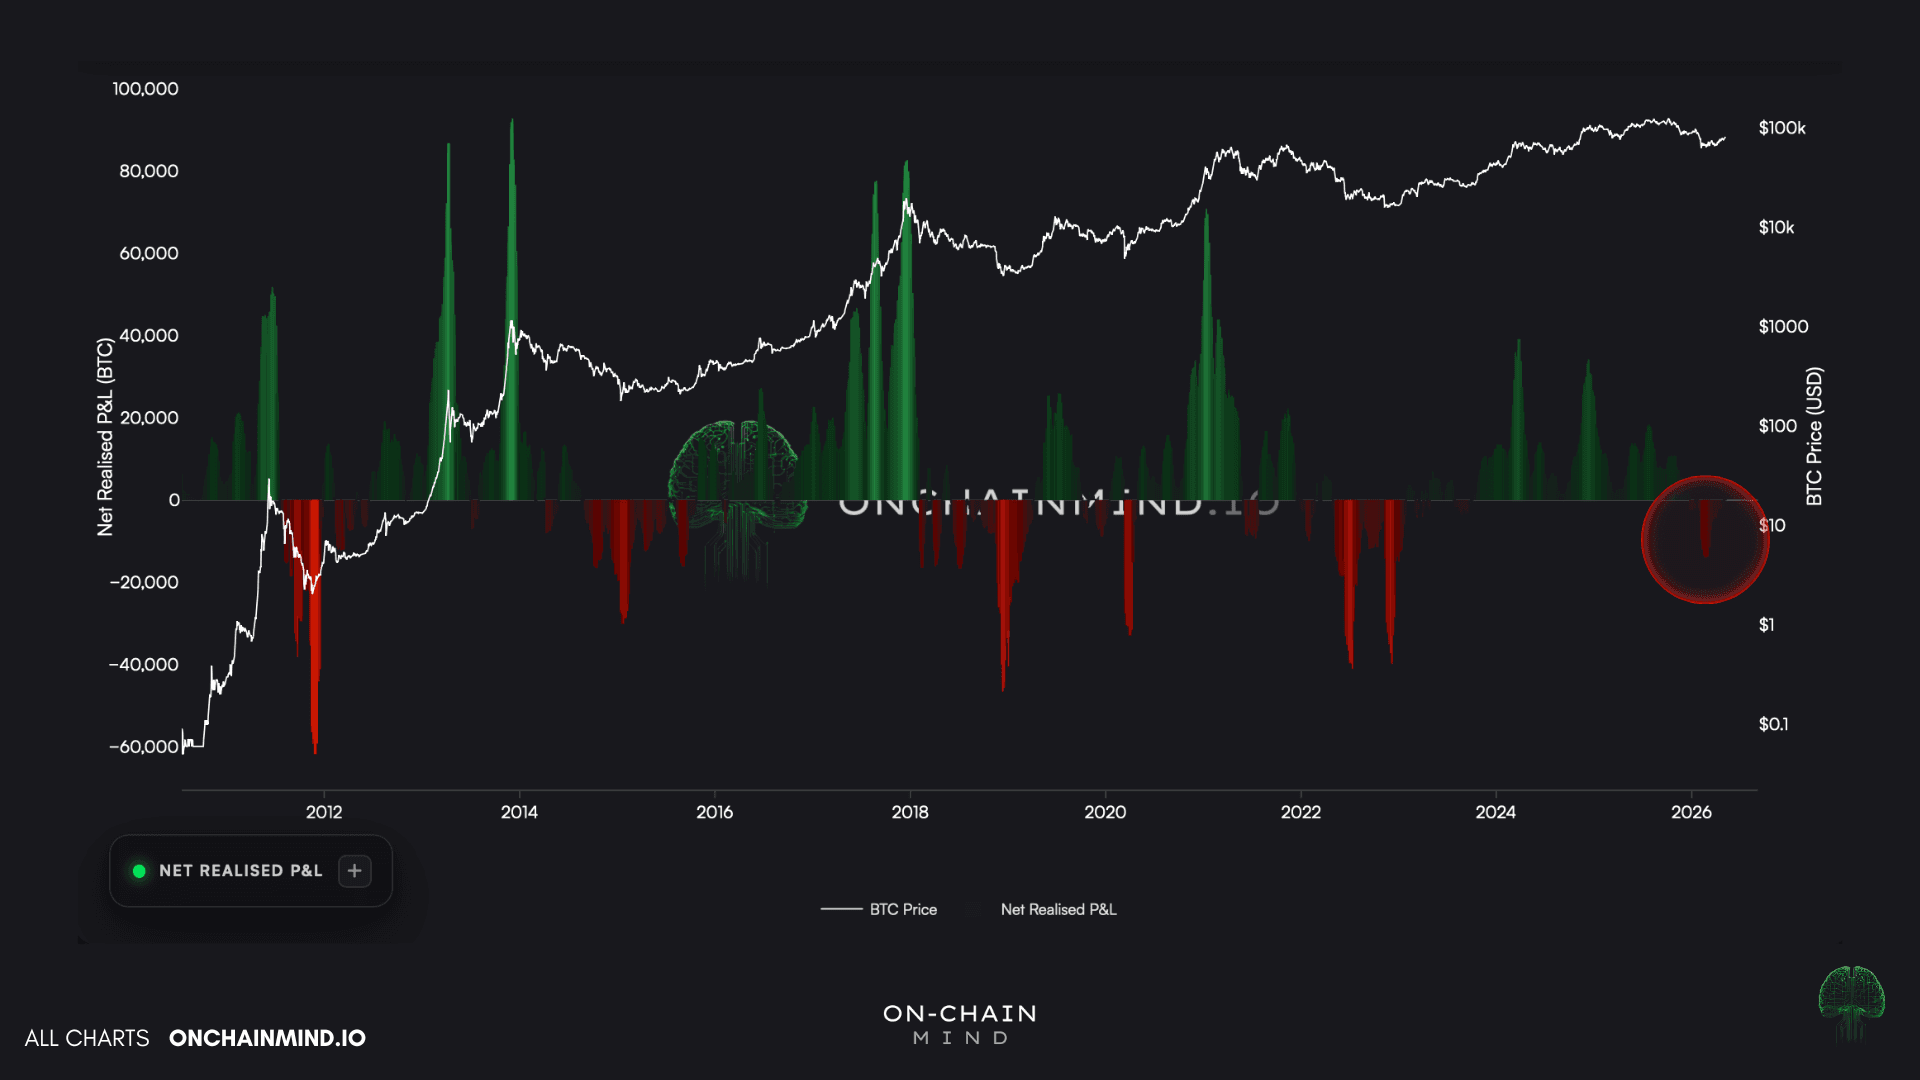
View live in OCM Studio: BTC Denominated NRPL
What the Cohorts Are Actually Doing
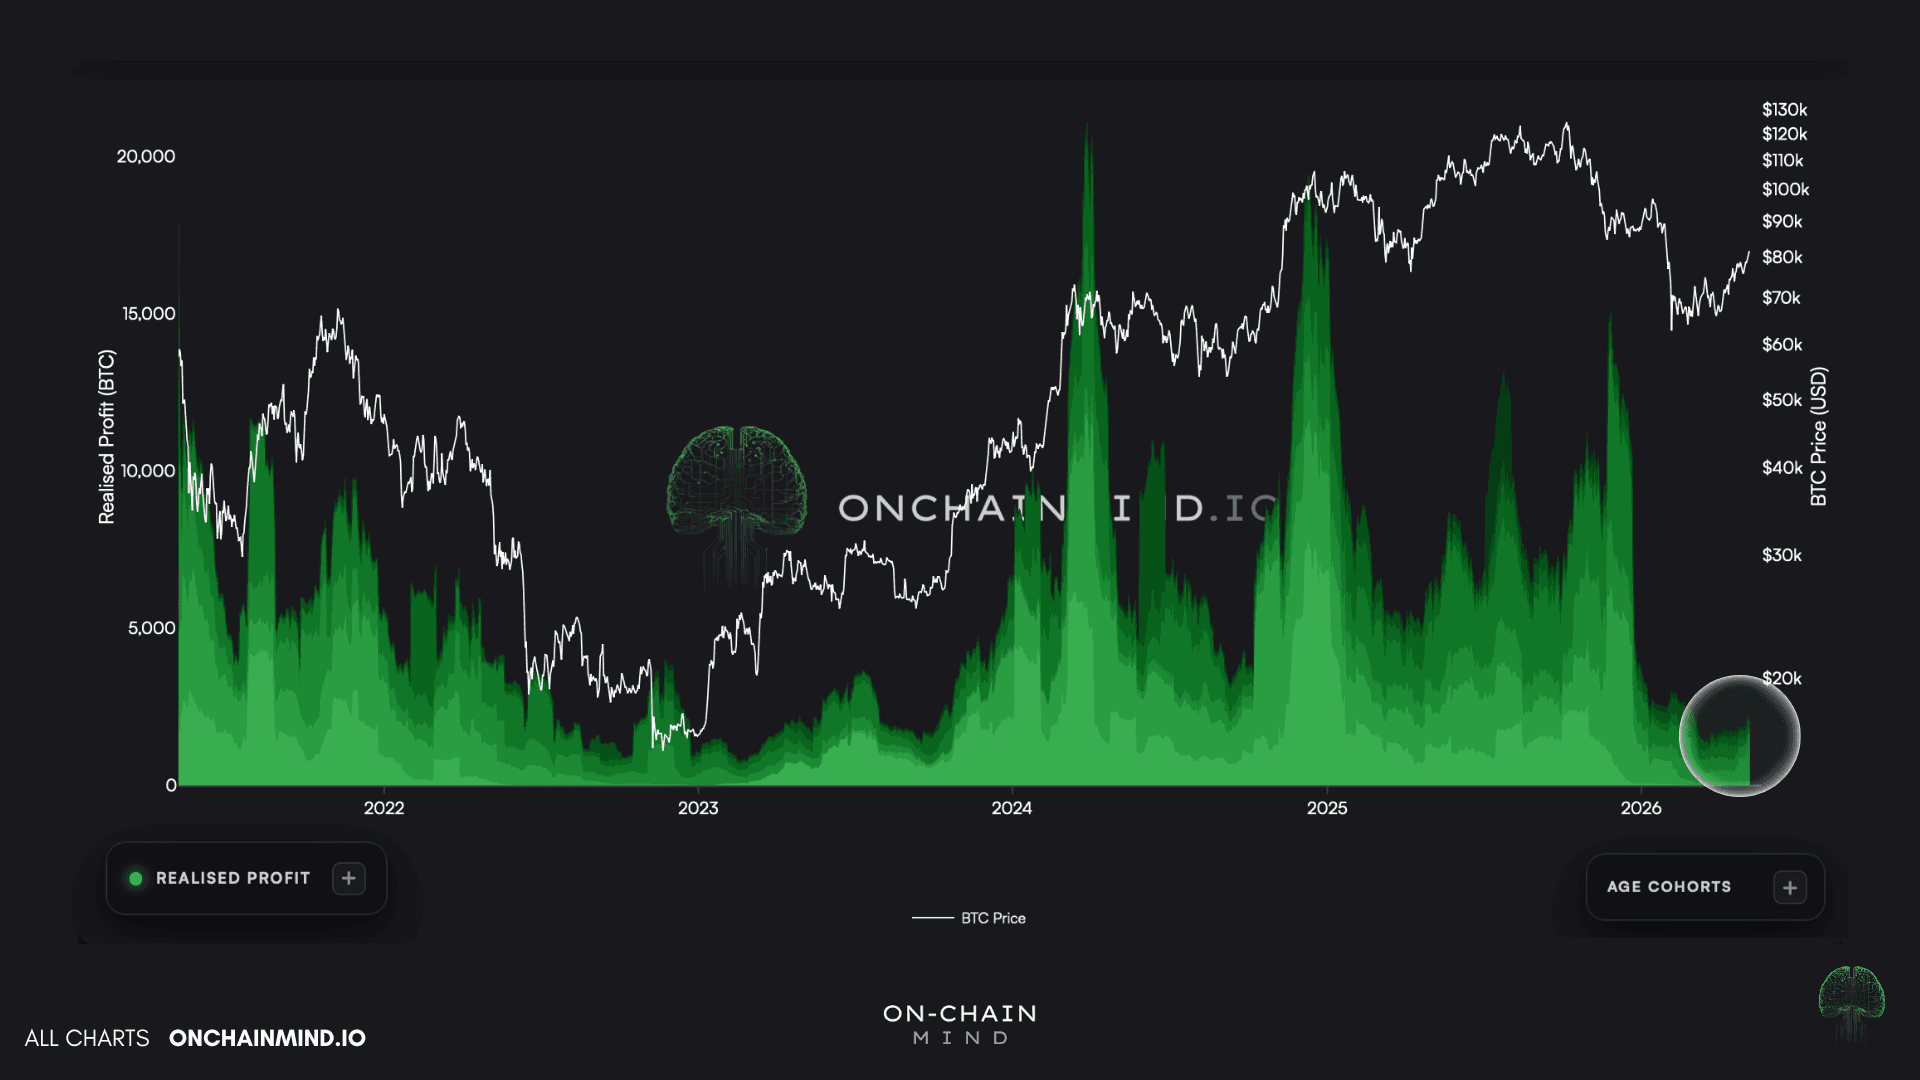
When Bitcoin rallies hard, profit-taking should surge. People sell into strength, older coins move, supply eventually overwhelms demand.
That mechanism is conspicuously absent here. Despite a strong rally, profit-taking has been minimal, and when you isolate who is actually selling, it's almost entirely coins 1 week to 1 month old. Recent buyers booking quick gains.
Even within that cohort, the absolute volume is a fraction of what we typically see during major rallies. Price moves up, the market absorbs it cleanly, holders sit on their hands. That is the supply structure of an early recovery.
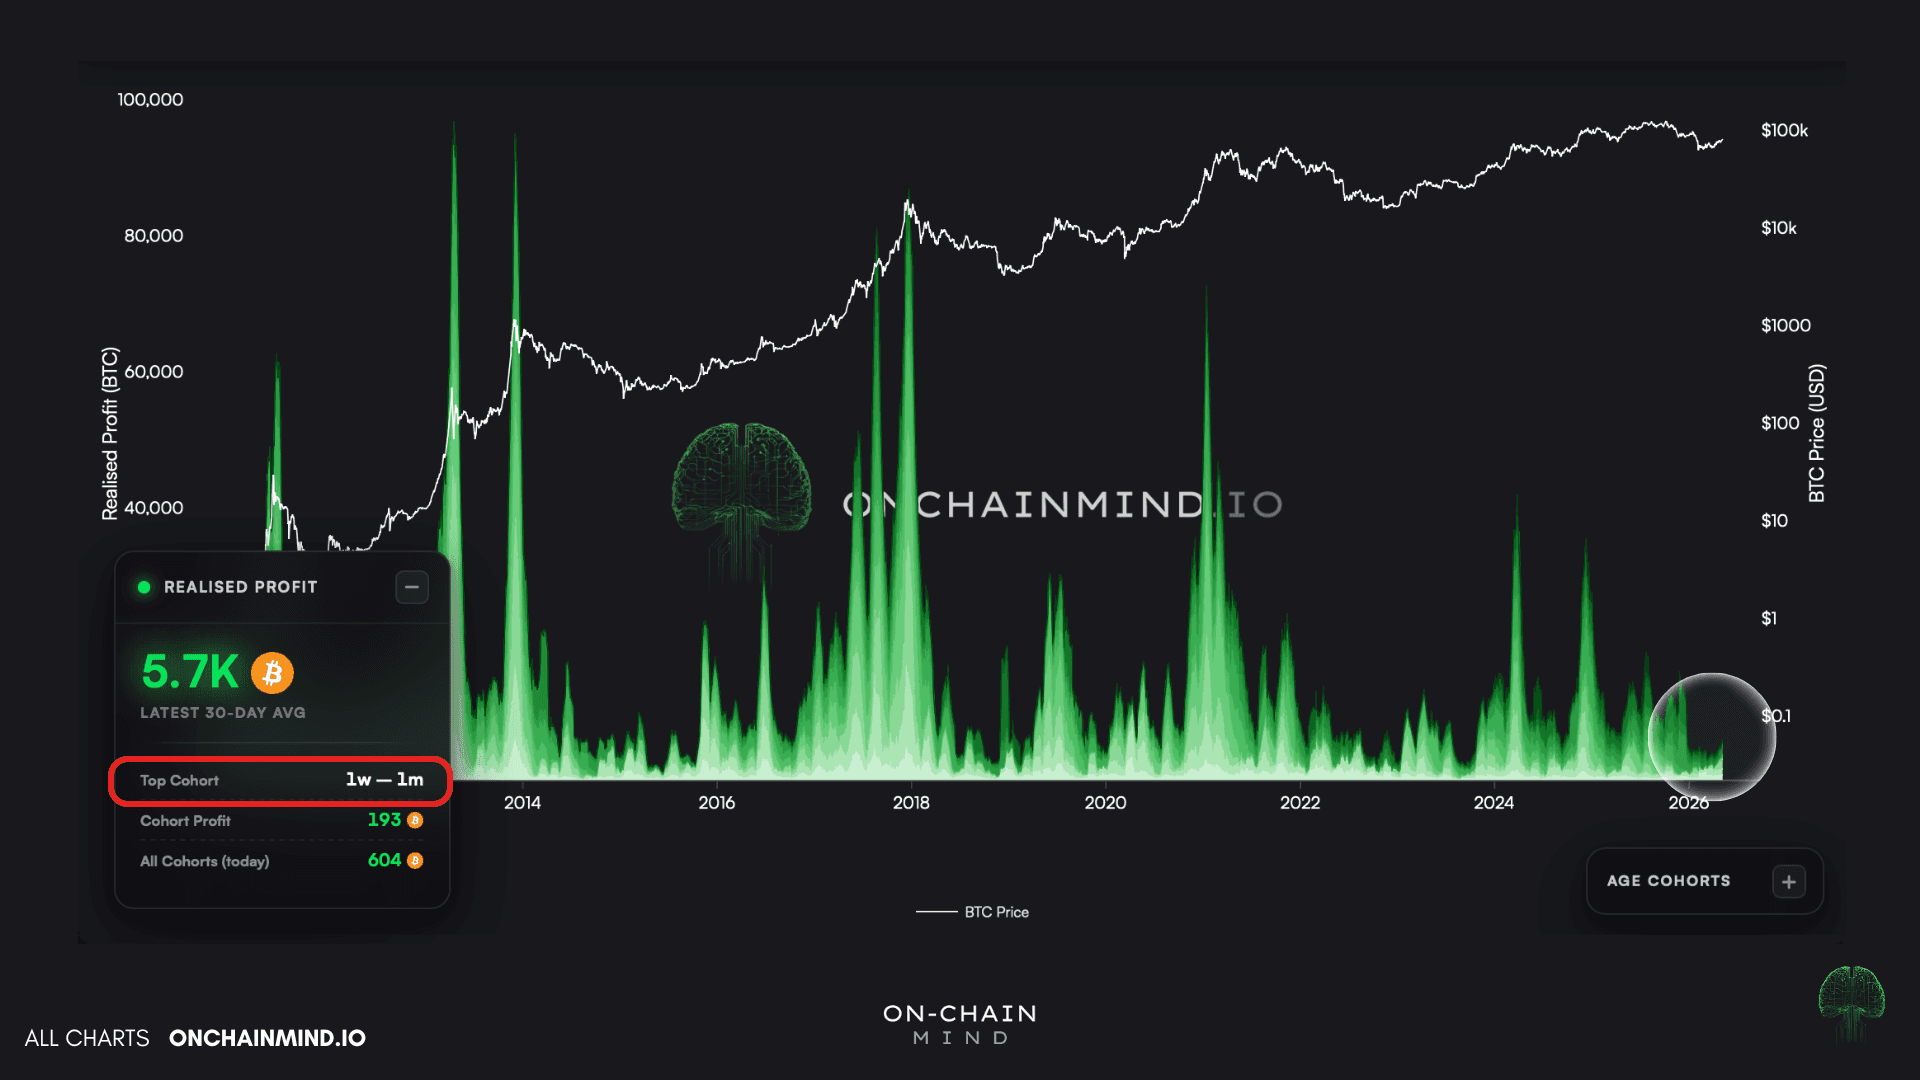
View live in OCM Studio: Realised Profit (total)
The bigger question is always long-term holders, because this is the cohort that marks cycle turns. They accumulate during weakness, sit through volatility, and distribute into euphoria, transferring supply to newer, more emotional buyers near tops.
This cycle, that distribution arrived in three distinct waves rather than one sustained push. The April 2024 rally to $70k, the November 2024 push toward $100k, and just after the October 2025 $126k peak.
What's encouraging now is that LTH profit realisation has stayed subdued throughout this entire move. If the strongest hands were dumping into the rally, I'd be far more cautious. They're not. They're patient.
View live in OCM Studio: Realised Profit (LTH)
The Futures Trap
The most underdiscussed element of this rally lives in the futures market, specifically funding rates.
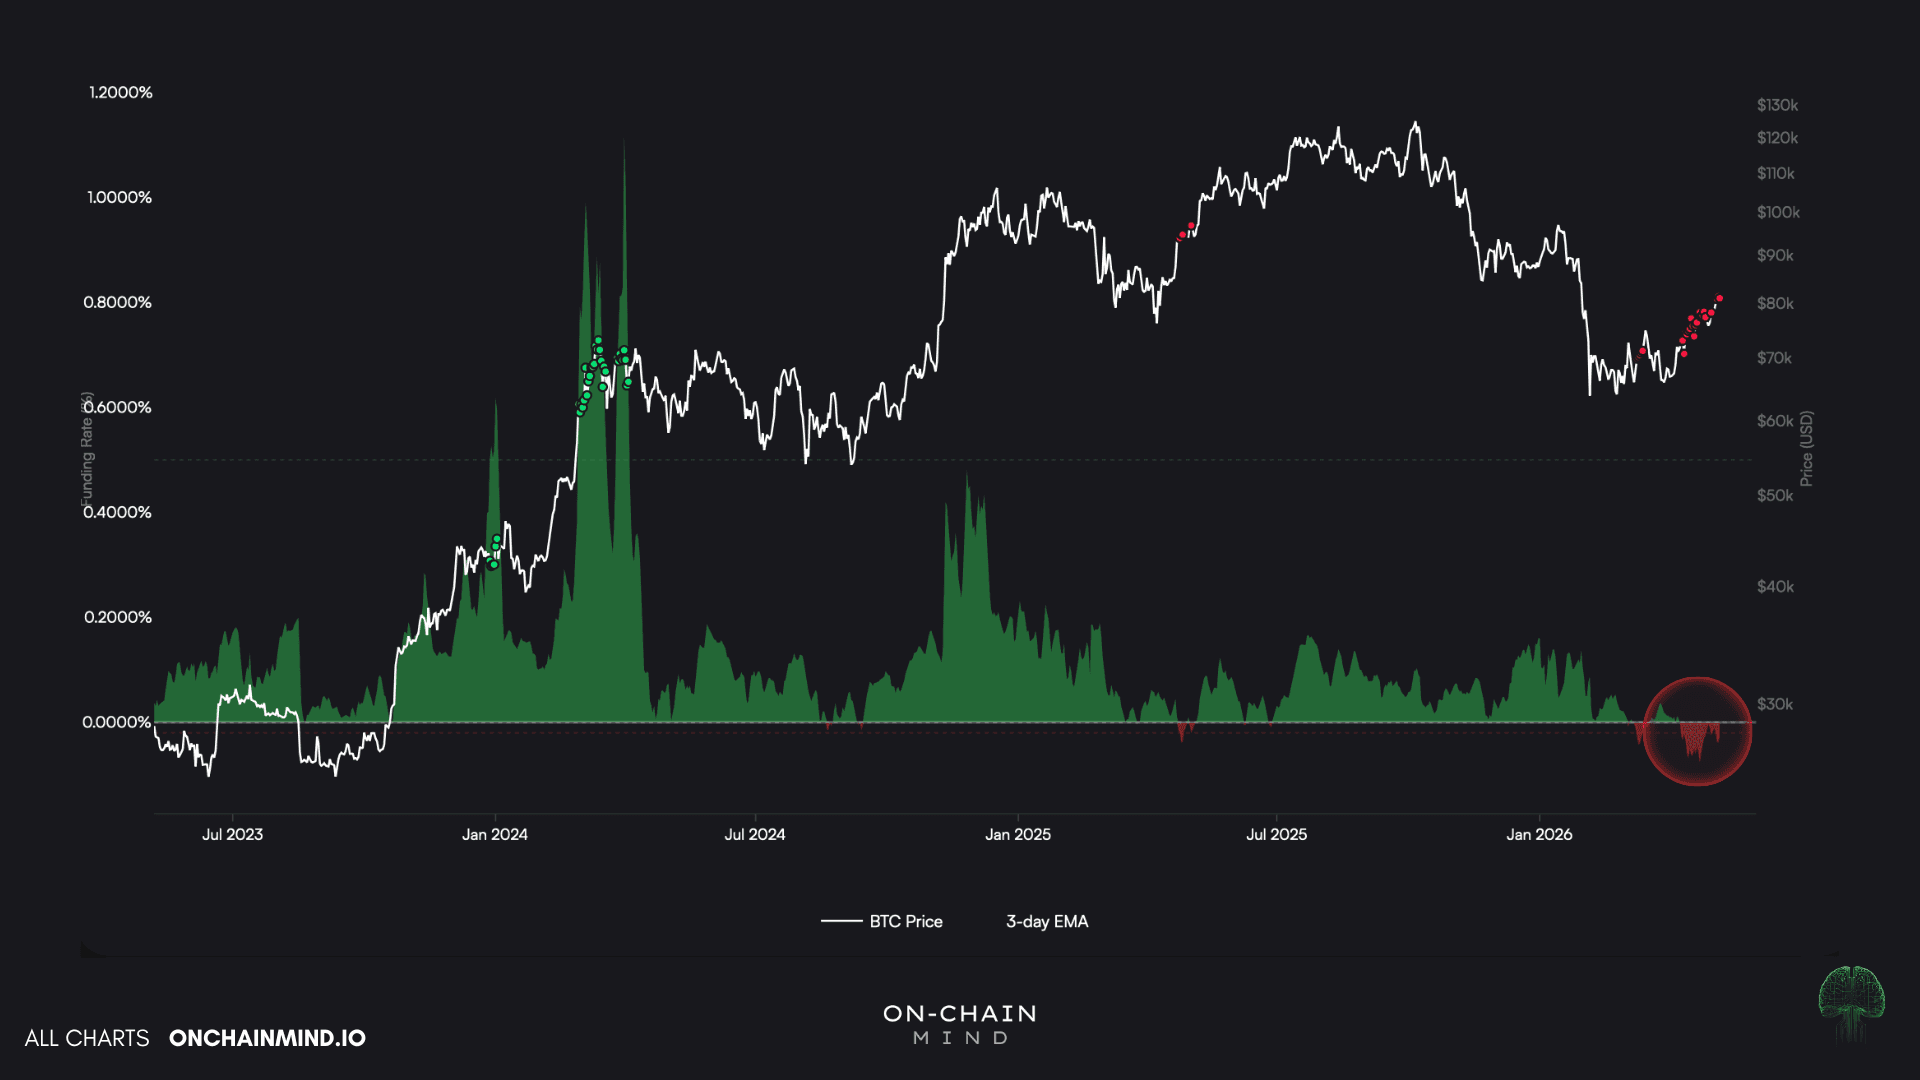
For anyone unfamiliar, funding rates are the periodic payments that perpetual futures traders make to each other to keep the contract pegged to spot. Positive funding means longs are paying shorts, which signals bullish positioning. Negative funding means shorts are paying longs, which signals bearish positioning, and is genuinely rare.
What’s just happened is that funding has turned negative during a rising market for the first time in roughly a year.
This is structurally significant because it means traders are paying for the privilege of being short while price moves against them. The futures market is, quite literally, betting against a rally that is already happening.
This matters because funding has always functioned as one of the cleanest contrarian signals in Bitcoin.
View live in OCM Studio: Futures Funding Rates
The mechanism is reflexive rather than mystical. When funding gets euphorically positive, leverage is concentrated long, and any meaningful pullback cascades through liquidations. When funding gets fearfully negative during an uptrend, the opposite dynamic builds. Shorts are trapped, and any continuation forces them to cover, which means buying futures, which transmits pressure into spot via arbitrage and momentum.
Rallies don’t accelerate because everyone suddenly turns bullish. They accelerate because bearish positioning is forcibly unwound.
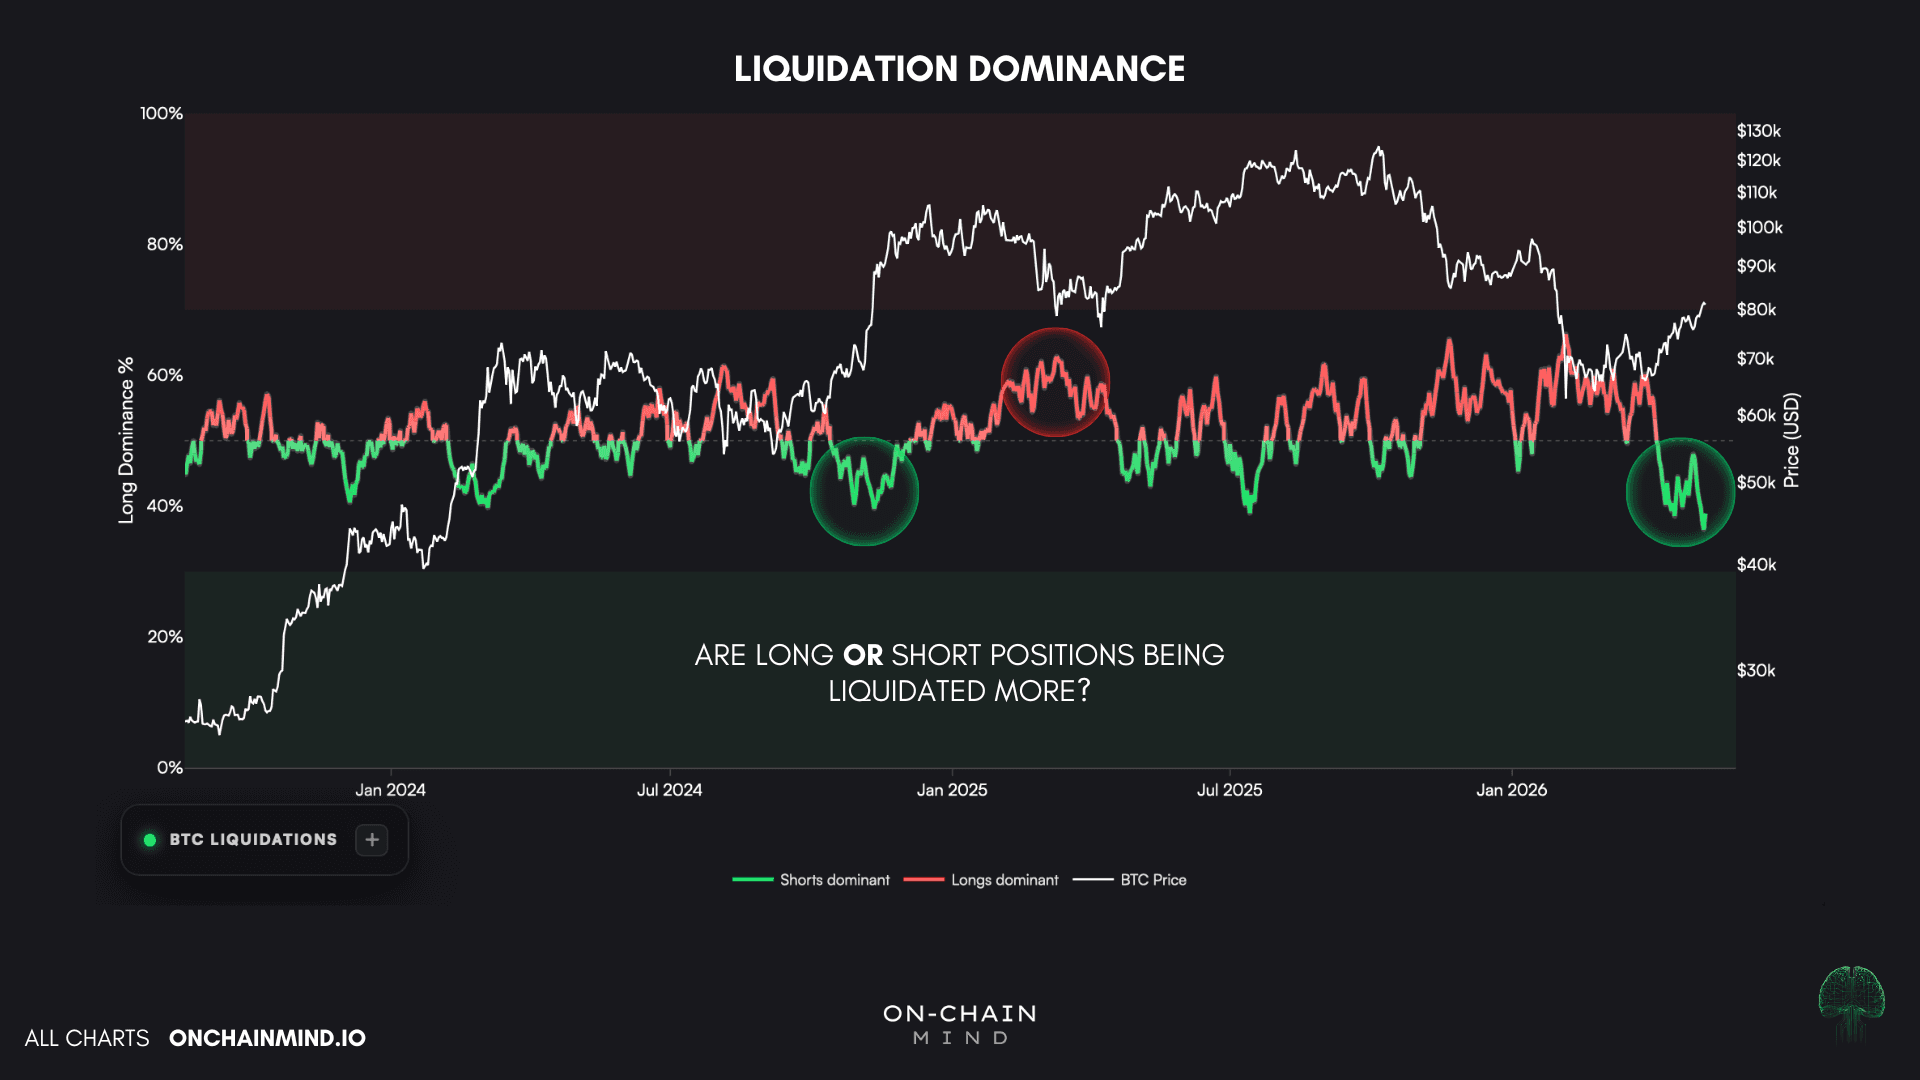
We are watching exactly this dynamic play out. Liquidation data confirms it, with the largest concentration of short liquidations since the start of the last bull market. That is a meaningful tell, but it cuts both ways.
It confirms the squeeze is happening, which is constructive, but it also means a portion of the immediate fuel has already been consumed. Strong rallies often begin with exactly this disbelief and forced unwinding, but they need fresh spot demand to continue once the trapped shorts have been flushed.
Expect consolidation or a retest before the next leg, even if the broader structure stays bullish.
View live in OCM Studio: Liquidation Dominance
The Opening Move
The setup is the most constructive I’ve seen since last summer. Every independent signal is pointing in a similar direction:
Key cost basis levels reclaimed.
Realised P&L flipped positive after 5 months of red.
Major profit-taking absent despite the move.
Long-term holders patient.
Funding negative during a rising market.
Short liquidations confirming forced unwinding rather than enthusiastic chasing.
You don’t usually get this many boxes ticked simultaneously at the start of a failed rally.
But conviction without confirmation is just hope, and the market still has to prove itself. The mistake people make is treating the reclaim as the conclusion. It isn’t. The reclaim is the opening move.
The actual confirmation is whether Bitcoin holds the $78,000-$79,000 zone on the retest, because that is where every reflexive on-chain signal will either solidify or unwind.
Hold that level with continued realised P&L improvement, subdued profit-taking, and patient LTH behaviour, and this stops looking like a bear market rally and starts looking like the early architecture of a proper recovery. Lose it, and the whole thesis weakens immediately.
For me personally, the bias has shifted. I went into this move sceptical, partly because every counter-trend rally in a bear market feels convincing in the moment, and partly because I’ve been wrong enough times to know not to trust price action in isolation.
What’s changed is that the on-chain structure is doing things it does not typically do during bear market rallies. The derivatives market is positioned in a way that fuels rather than caps further upside. And cohort behaviour is constructive across every meaningful breakdown.
That doesn’t mean I’m betting the farm, and my Premium subscribers know exactly what my playbook is for now. But what it does means is I’m watching the retest with significantly more interest than I have been watching anything for months. Because if Bitcoin holds, this is the turn. And if it doesn’t, we’ll have a far cleaner read on how much further this market has left to bleed.
The reclaim has happened. The structure is improving. The crowd is leaning the wrong way. Now Bitcoin just needs to do the one thing that matters most.
It needs to hold.