
BTC just ripped 15% off its $80,000 low in a matter of days. Violent, emotional, and classic Bitcoin.
But before we declare a full-on rebound, there’s a crucial question to ask: is this the start of a sustainable recovery, or just another bounce before heading lower?
In this article, I’m focusing on volume, order flow, and market structure, which are the metrics that actually reveal who’s in control of the market and whether this rally has real legs.
Key insights
Volatility Envelope Extreme: The fastest volatility expansion of the bull market has now fully retraced into the expected 1σ band. A classic mean-reversion setup.
Volume Impact Exhaustion: Extreme seller-driven spikes were followed by calm, modest green absorption. Another textbook sign of healthy demand stepping in.
Largest Hidden Buying Spike of the Cycle: Order-flow divergence oscillator just printed its biggest positive extreme, which shows hidden accumulation at scale.
σ Channel Structure: Price is oscillating exactly as it should after breaching the lower boundary; $93,000 fair-value reclaim is the current line in the sand.
Measuring How “Stretched” the Market Really Is
The first step in analysing Bitcoin’s bounce is understanding volatility. Most people think about volatility as simple ATR or Bollinger Band width. Useful, but crude. Because not all price moves are created equal. Some occur smoothly, while others happen with violent spikes that signal underlying market stress.
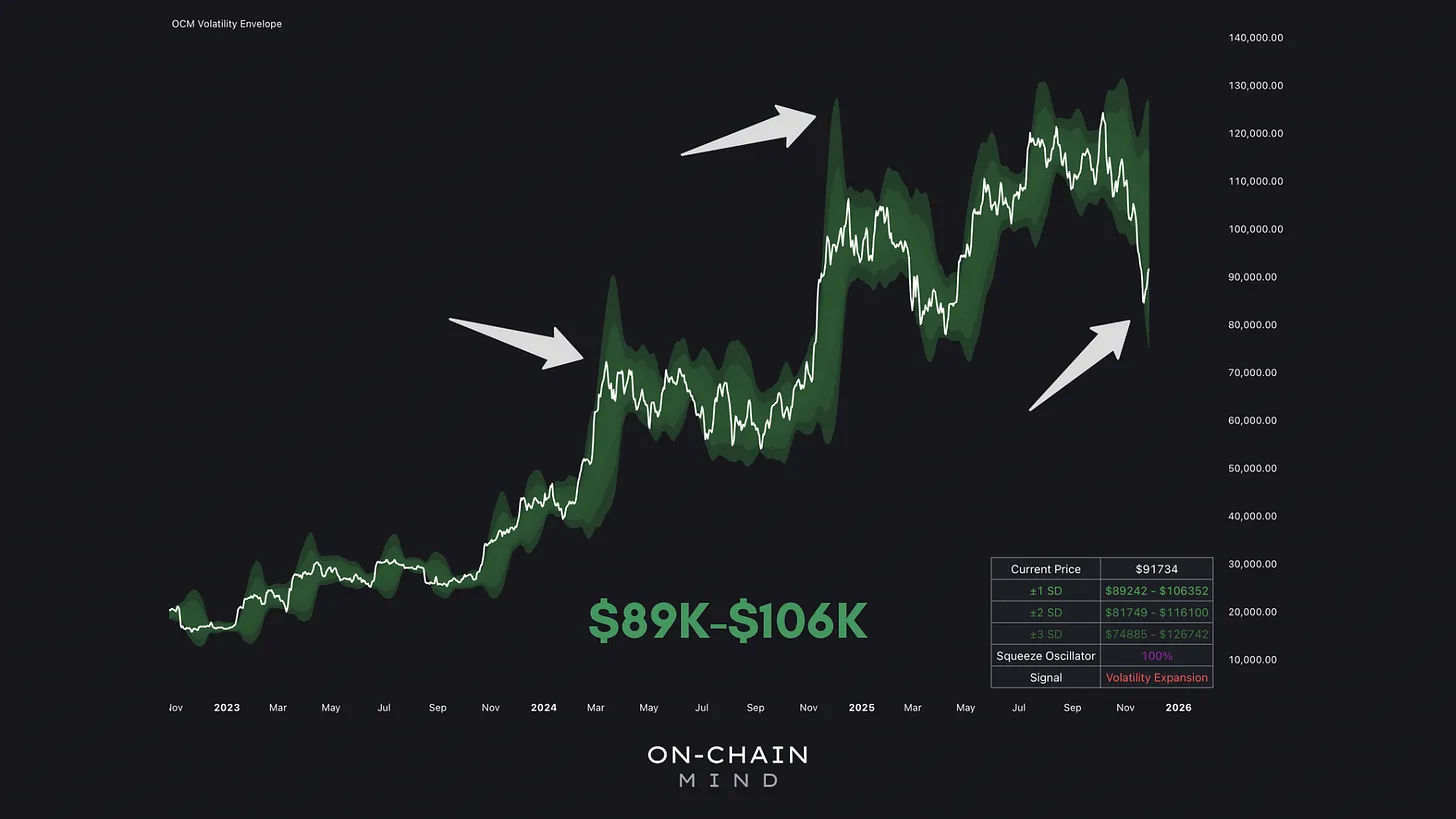
The Volatility Envelope is a tool that measures just that. By anchoring the price to a statistical basis and wrapping it in multiple standard deviation bands, it shows when the market is stretched or compressed relative to its own historical behaviour.
When the bands explode outward, like they did during this recent price plunge, it tells us volatility expanded far faster than the market’s own distribution can sustain.
Historically, the fastest 30-40% band expansions in this cycle have always been followed by sharp mean-reversion moves. We just witnessed the largest downside expansion since early 2023. And now price is sitting near the lower edge of the post-expansion 1σ envelope ($89,000-$106,000).
Translation: the market has already priced in almost the entire “panic” tail. We are no longer in an outlier regime. From a pure statistical perspective, the path of least resistance is now towards the middle-to-upper half of that envelope, roughly $98,000-$102,000, before any fresh directional volatility can credibly re-emerge.
I’ve watched this indicator for years. When price hugs the lower 1σ band after a massive expansion, it almost always marks the transition from “capitulation” to “controlled rebound”.
We appear to be there.
Not All Volume Is Created Equal
Next, we need to address a common confusion in market analysis: volume interpretation. Many traders glance at volume spikes and assume that a surge equals market conviction. But the reality is more nuanced.
This will upset those volume traders amongst us, but: raw volume bars are mostly useless.
A giant green candle on 2× average volume can still be weak if all the buying happened on the wick while the close was at the low. Conversely, a modest green candle on slightly above average volume can be incredibly strong if the entire move was buyer-driven at the highs.
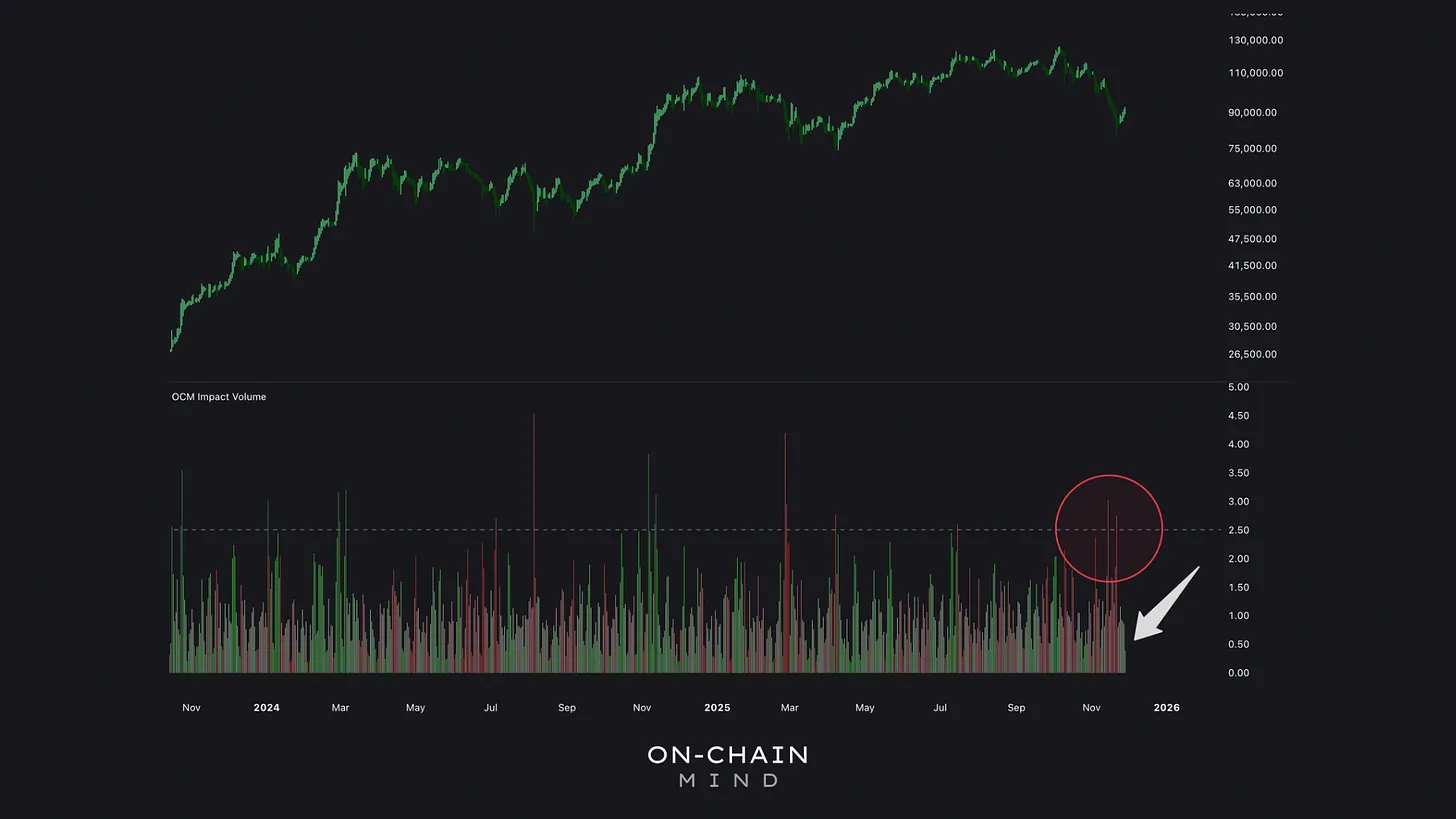
The Impact Volume indicator fixes this. It weights each bar’s volume by where the real price acceptance occurred inside the candle, ignoring wicks, focusing only on the “body pressure”. Then it normalises everything so we can compare apples-to-apples compare conviction across time.
What did we see at the lows? A cluster of the most extreme negative (red) readings of the entire bull market. These aren’t just “high volume down days”, these are days where sellers were aggressively hitting bids right through the meat of the range. Pure displacement.
Such spikes are almost never sustainable. They’re one of the most obvious signs of over-extension. And now the reversal bars have produced only modest positive green readings. That’s actually bullish.
When buyers come in with restrained, high-quality green volume immediately after seller exhaustion, it shows absorption rather than FOMO. The big money is lifting offers quietly, but they’re not panicked, they’re patient. That’s how structural reversals begin.
The violent “V-bottom” blow-off green spikes you see in bear-market rallies tend to fail quickly. This quiet control is the opposite, and far more reliable.
The Pressure Beneath the Surface
If Impact Volume is good, the Hidden Order-Flow Divergence oscillator is elite.
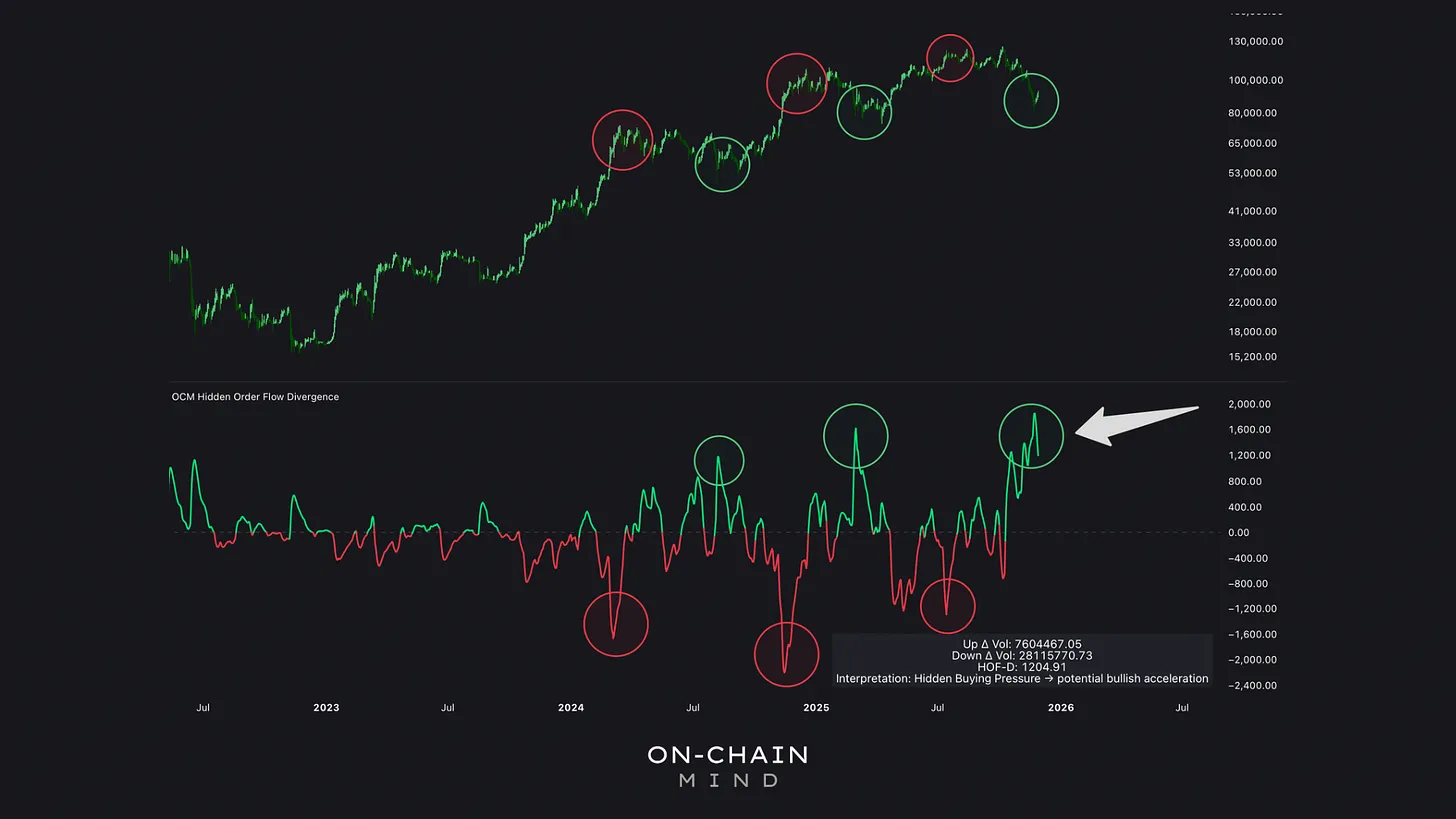
It measures the delta between actual aggressive buying/selling (market orders eating liquidity) and the resulting price displacement:
When price falls but aggressive selling is drying up → hidden buying.
When price rises but aggressive buying is absent → hidden distribution.
At the $80,000–$82,000 zone we saw moderate downside price movement accompanied by sharply declining aggressive selling, which is the classic positive divergence that precedes short squeezes.
Then, as we bounced, the oscillator exploded upward even more and just printed the single largest positive spike of this entire cycle.
This isn’t just a small correction; it represents overwhelming hidden buying pressure, suggesting that the market isn’t just bouncing, it’s potentially beginning a meaningful reversal.
In essence, order flow divergence shows whether price action is driven by real commitment or drifting on weak conviction. And the fact the spike is this extreme, with price only recovering to the low $90,000s, tells me buyers are quietly establishing dominance.
Keeping the Bearish Structure in Context
Now, let’s pour some cold water before we get too excited.
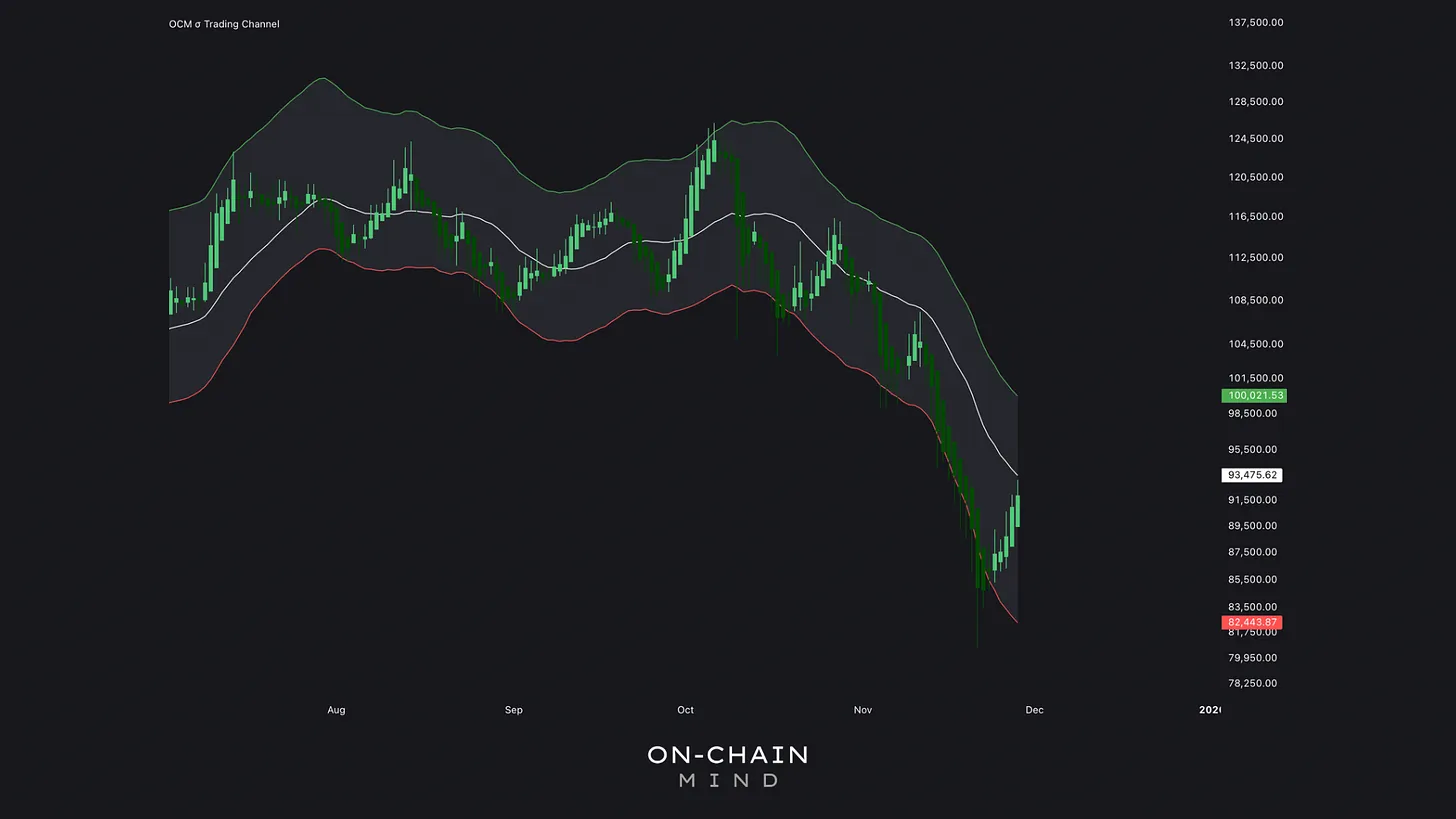
While volume and order flow give us insight into pressure, we also need to consider price structure. The higher-timeframe trend is still clearly down. We broke the lower boundary of the σ Trading Channel in dramatic fashion, which is a technically bearish event. The “fair value” midline of that channel sits at approximately $93,000 right now.
Until we reclaim and close above that level on convincing volume, the macro trend remains bearish. Full stop.
What we’re seeing instead is textbook channel behaviour after a lower-boundary breach: a reflexive snap-back toward the midline. Bitcoin has done this repeatedly since its inception: overshoot the lower boundary → violent rally to the midline → either (a) reclaim and resume uptrend or (b) reject and retest the lower boundary.
We are squarely in that oscillation phase. The volume and order-flow metrics I showed earlier strongly favour outcome (a), but it is not confirmed until $93,000 is flipped into support.
Exactly How I’m Trading This
When you look back at how every single major low forms, I can tell you this one has all the hallmarks of the real thing:
Watch the video walkthrough on YouTube
Continue reading with OCM Premium
You have been reading the free preview of this article. The rest of it (about 250 more words) is for OCM Premium members. See OCM Premium plans.