
Bitcoin’s supply structure is undergoing one of the most significant transformations of the entire cycle, and barely anyone is talking about it properly.
Long-term holders now control more than 81% of all circulating Bitcoin. The oldest coins on the network, the ones that have sat untouched for the better part of a decade, have suddenly gone silent. And speculative capital has been drained from the system to levels we typically only witness at the depths of bear markets.
In this article, I want to walk you through 3 of the most powerful on-chain charts I use to track what the smart money is actually doing, and why, taken together, they paint a picture that looks far more structurally constructive than the current price action suggests.
Let’s get into it.
Key insights
The Long-Term Holder Illusion: Rising LTH supply isn’t always fresh accumulation, it’s often old coins ageing into the cohort after every cycle peak.
Revived Supply Has Collapsed: The oldest, most experienced wallets have stopped selling, mirroring the silence we see at deep bear market floors.
Speculative Capital Is Nearly Gone: Short-term holder dollar value has cratered, signalling the hot money has already been flushed from the market.
Time-Based Capitulation, Not Price-Based: The structural reset is happening through ageing of coins, not through one final brutal price flush downward.
LTH Supply Is Rising, But Context Matters
Long-term holders are, without question, the dominant force on the Bitcoin network. They presently hold ~81% of the entire circulating supply, and that figure has pretty much never dropped below 50% in Bitcoin’s history.
Even at the most aggressive distribution phases at cycle peaks, this cohort still controls the majority of coins. That alone should tell you something about the asymmetric conviction baked into Bitcoin’s holder base.
What’s caught my eye recently is the velocity of the increase. Since the start of the year, LTH supply has rocketed from around 14 million BTC to over 16.2 million BTC. The 60-day rate of change is showing one of the largest jumps on record, with roughly 1.5 million coins shifting into long-term holder territory in just 2 months.
Now here’s where the analysis goes off the rails for most people, and I’m watching this misinterpretation spread across Twitter daily. Commentators are confidently declaring that long-term holders are “aggressively accumulating” at these levels. That framing fundamentally misunderstands what the metric actually measures.
A coin earns long-term holder status once it has remained unmoved for more than 155 days, or roughly 5 months. This means the chart isn’t necessarily showing buying behaviour happening today. More often, particularly after major cycle peaks, it’s showing coins that were purchased months ago simply ageing into the cohort.
Once you zoom out, the pattern becomes glaringly obvious: roughly 5 months after every major Bitcoin peak in history, we see a massive spike in long-term holder supply.
The people who bought the top didn’t sell. They held through the drawdown, endured the pain, and eventually graduated into the long-term cohort by default.
The lower portion of this chart, where LTH supply is falling, is the easier half to read. When this cohort is shedding coins, they are distributing, full stop. And historically those zones have marked cycle peaks with eerie precision.
The upper portion is where the nuance lives. Rising LTH supply isn’t automatically bullish in the short term, but structurally it does indicate that float is being removed from the active market. Coins are landing in wallets belonging to people who don’t react to every wiggle on the chart.
That is still important.
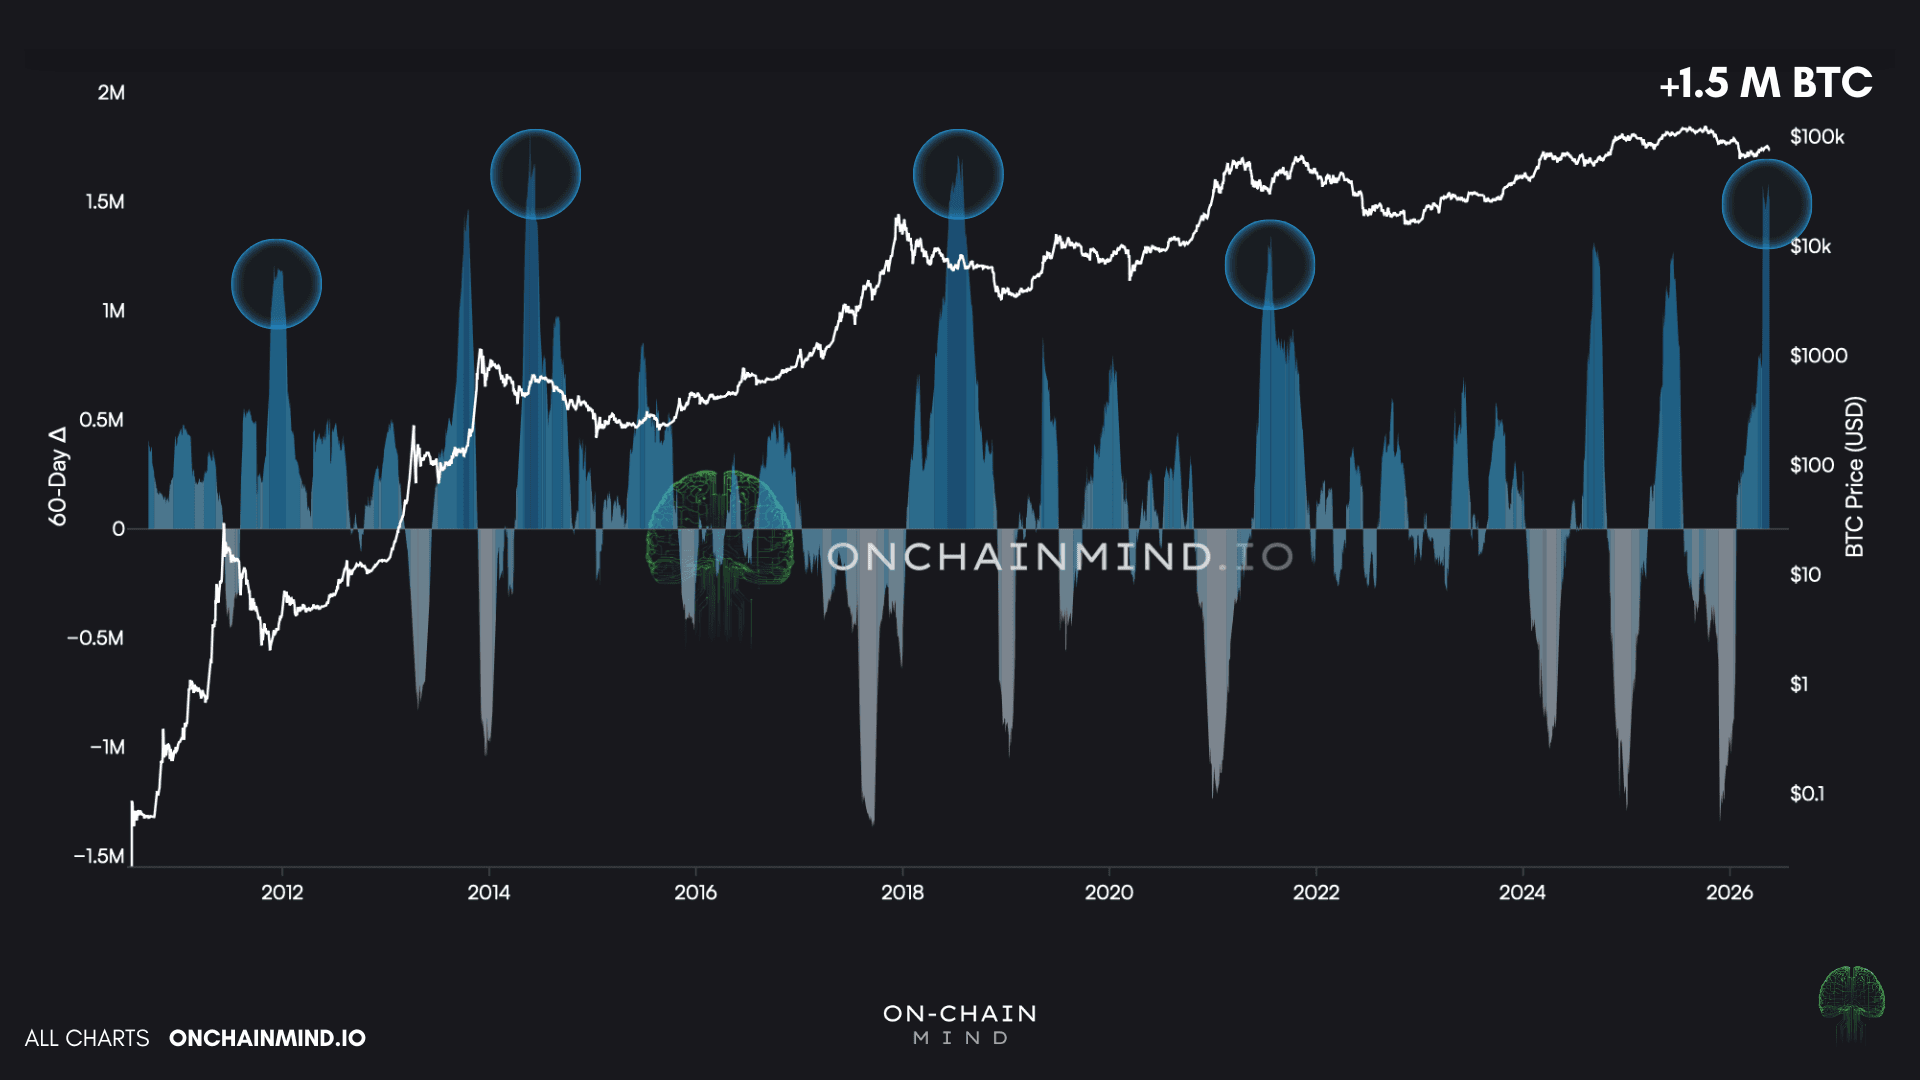
View live in OCM Studio: LTH 60-Day Supply Change
The Oldest Coins Have Stopped Selling
The second chart we’re looking at today is something called the Revived Supply, and I’d argue it’s one of the most underrated metrics in on-chain analysis.
Think of it as the “awakening of dormant Bitcoin”. It tracks coins that have sat completely untouched for extended periods and then suddenly move on-chain.
When the metric spikes, especially in the bands representing 5, 7, or even 10+ year old supply, it means high-conviction holders are stirring. These aren’t tourists or weekend traders. These are the most experienced wallets on the entire network.
Broadly speaking, old coins wake up for one of two reasons:
They’re locking in profits during periods of extreme market strength, or
They’re capitulating during a particularly brutal bear market flush.
What’s been fascinating about this cycle is how persistent the revived supply was from early 2024 through the end of 2025. Historically, we tend to see one large spike near the peak, followed by a quiet bear market.
This time, the selling from old hands was more sustained.
The introduction of spot ETFs may have prompted some legacy holders to migrate their exposure into a more convenient vehicle, the psychological draw of six-figure Bitcoin prices likely triggered profit-taking from those sitting on life-changing gains, or the old supply simply recognised that the market had entered a structural distribution zone.
Whatever the cause, the most important takeaway is what’s happened since. Revived supply has fallen off a cliff. We are now sitting at levels we typically only observe near the deepest stages of bear markets.
The oldest, most informed participants in the network have effectively gone quiet, and that silence is loud.
This is the chart you want pinned to your monitor going forward. Any fresh spike here will tell you that the most convicted portion of the supply is moving with intent. If that spike coincides with a major rally, treat it as a significant warning that smart money is distributing into strength. If it coincides with a deep drawdown, it often marks forced capitulation and one of the cleanest buying opportunities you’ll get in a cycle.
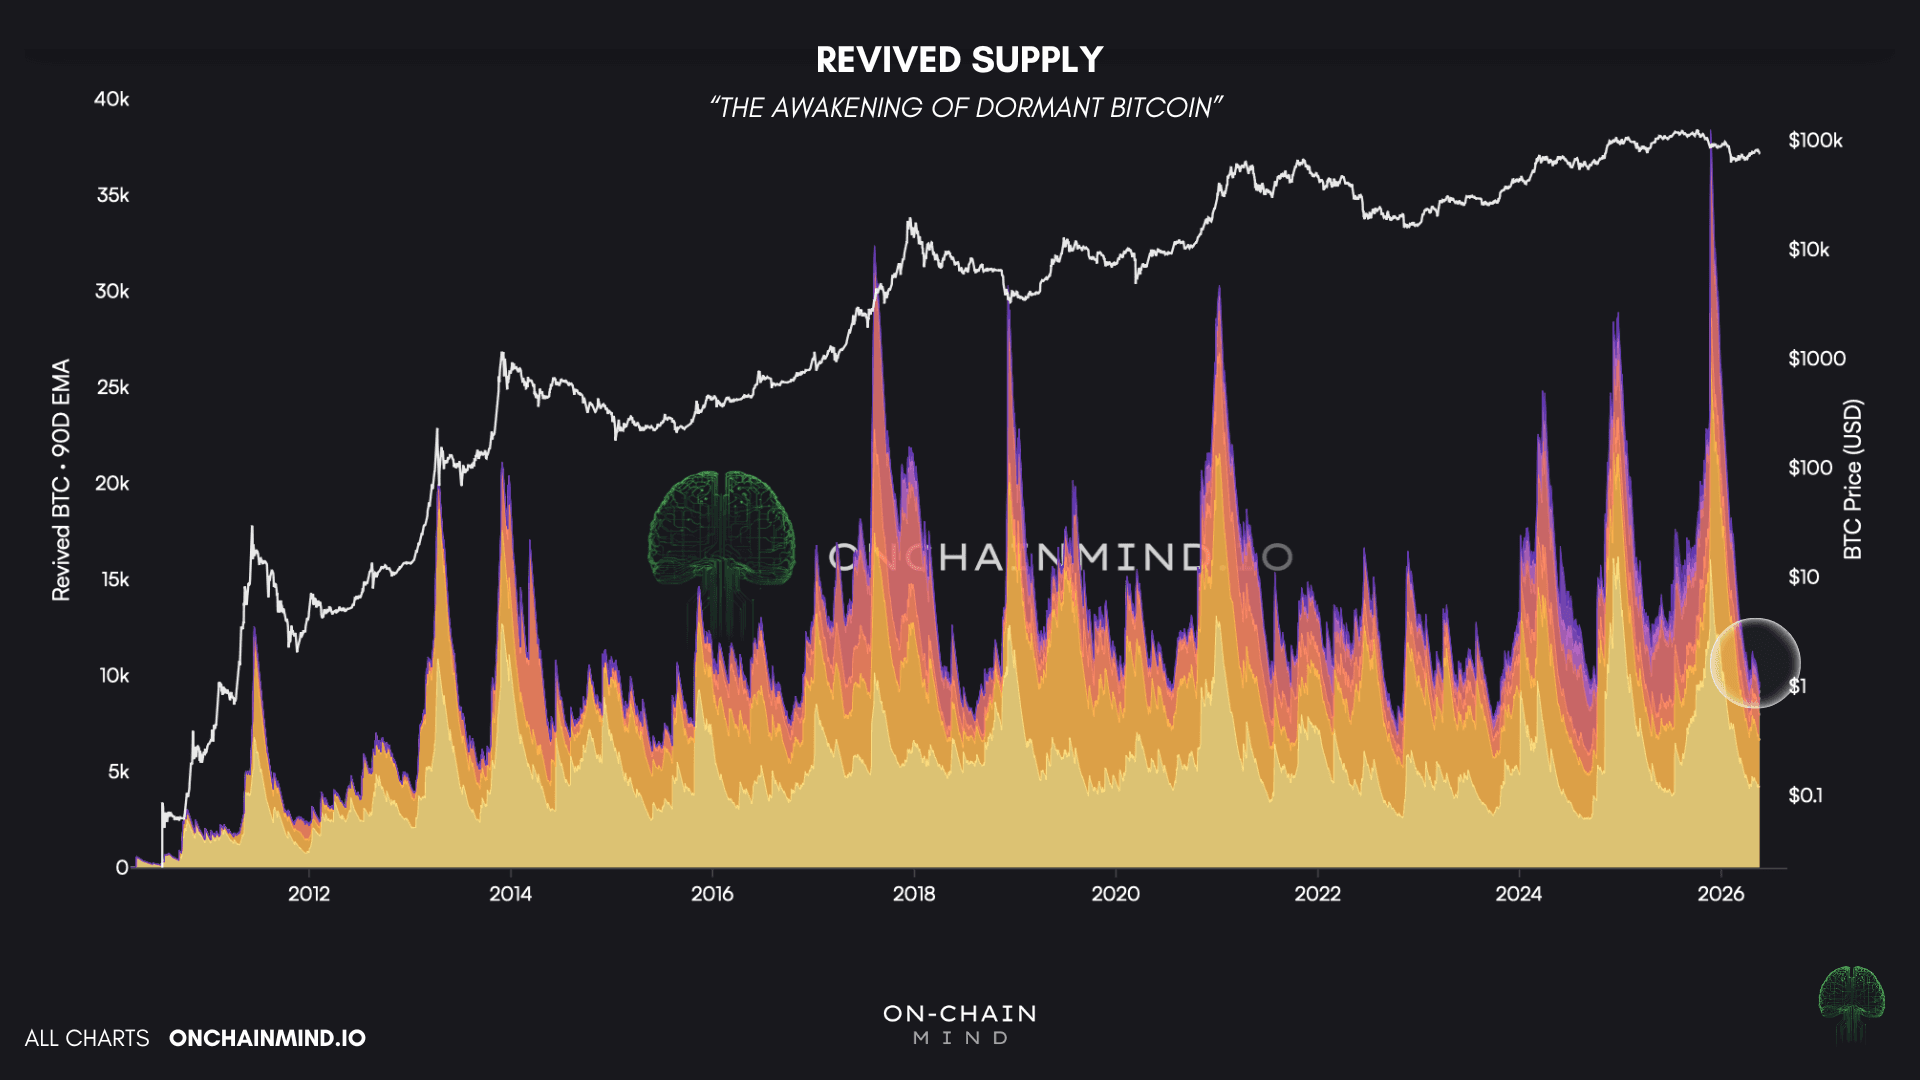
View live in OCM Studio: Revived Supply
Speculation Has Been Flushed
The third chart adds a different layer of insight. The popular HODL Waves chart show what percentage of supply is held by coins of different ages. The Realised Cap version weights each age band by the price at which those coins last moved. In effect, it shows where the actual US dollar value sits on the blockchain rather than just the raw coin count.
When you isolate the short-term holders specifically, the coins aged from under 24 hours up to 6 months, you’re essentially looking at Bitcoin’s retail thermometer.
During roaring bull phases, this band spikes into towering peaks. Fresh capital floods in, coins move at elevated prices, and the short-term realised cap explodes upward. Historically, those towers have marked the top of every major cycle with remarkable consistency.
The inverse is just as informative. Whenever the short-term holder share of realised cap drops into the 20-30% range, it has historically represented a generational buying window.
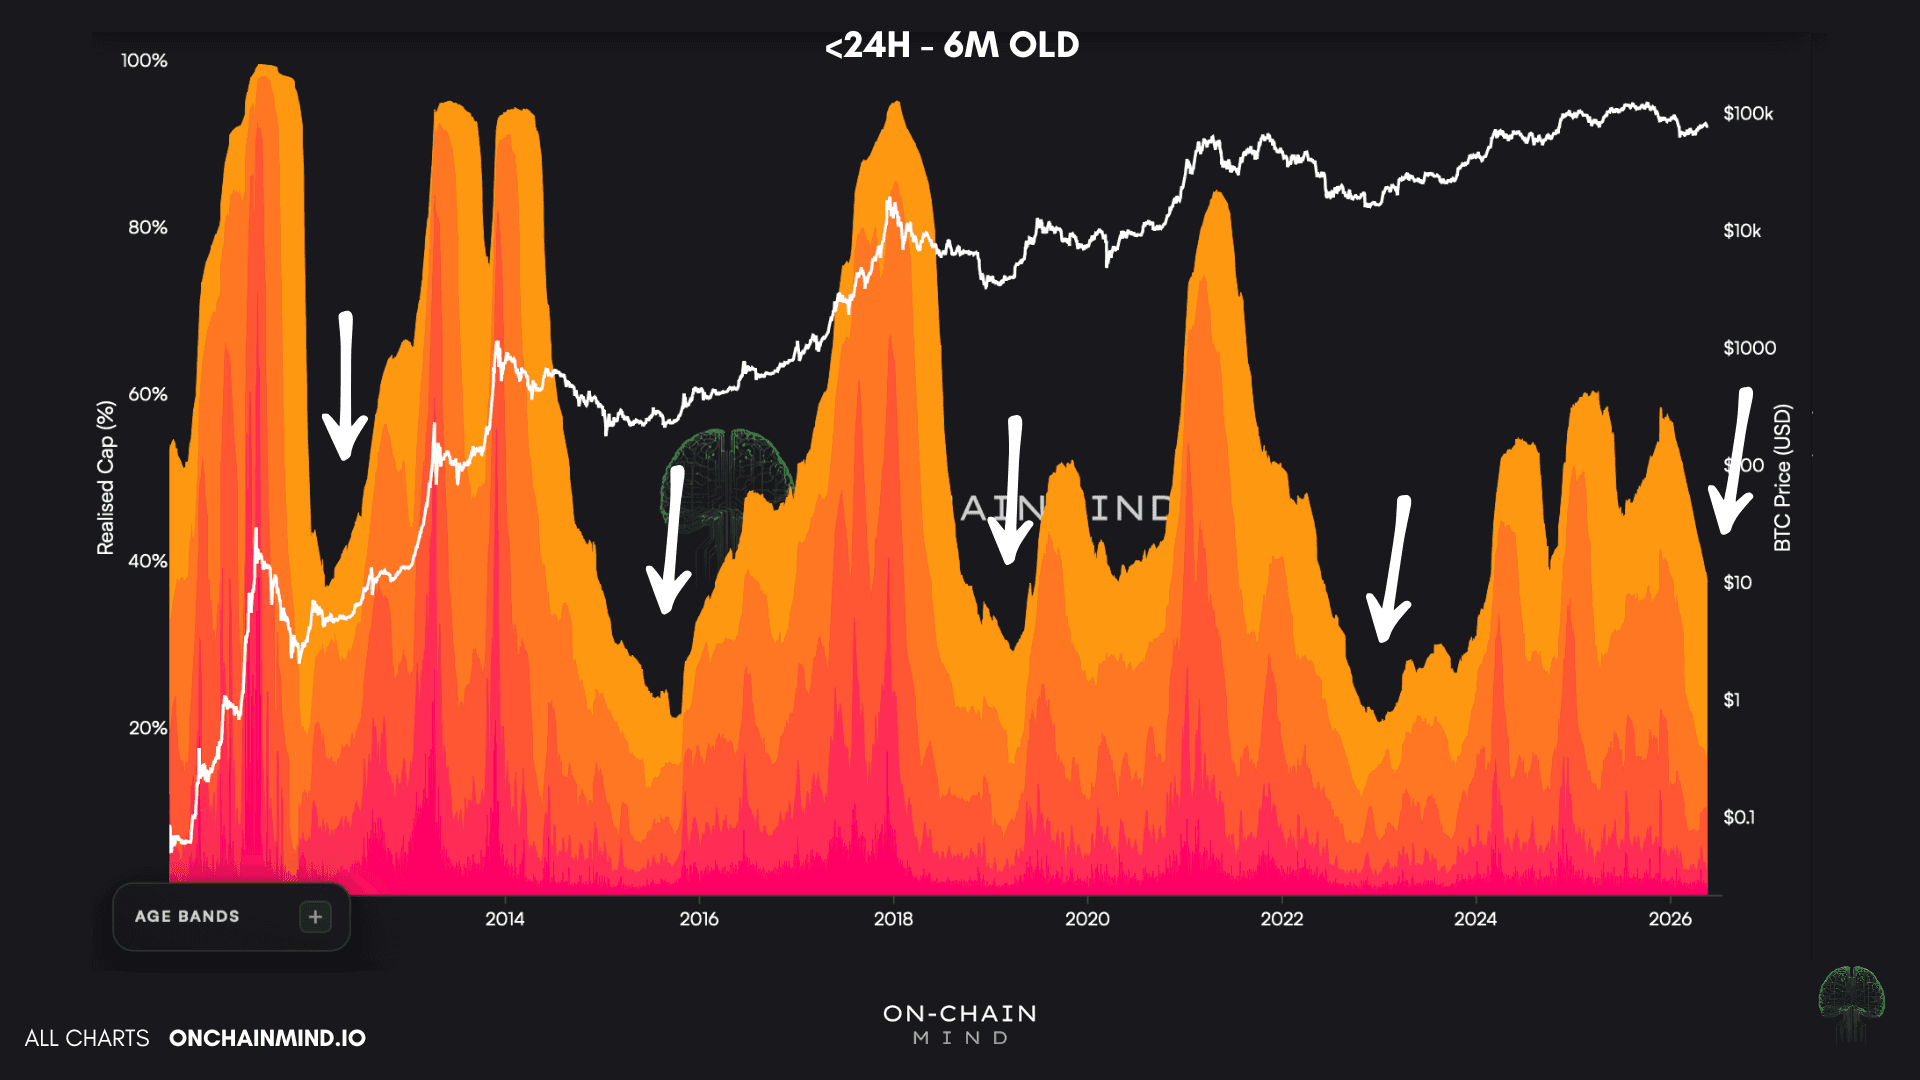
View live in OCM Studio: STH Realised Cap HODL Waves upto 6 months
Here’s the technical point I want you to internalise, because it’s the most important conceptual takeaway in this entire piece. If short-term holders only represent around, say, 20% of realised cap, that means only a small fraction of the dollar value on the network is being held by weak hands.
At that stage, the market becomes structurally very difficult to dump further. There simply isn’t enough willing seller-side supply at depressed prices to push the market meaningfully lower. This is why those “Bitcoin going to $20k” narratives fall apart under any rigorous structural analysis.
Currently, the short-term HODL waves have collapsed dramatically, and even despite the recent price rally, they’ve continued shrinking. If price is rising whilst speculative capital is contracting, the move isn’t being driven by a classic retail chase.
Digging deeper, the 3-6 month cohort is dominating the short-term holder realised cap, accounting for around 21% of a total of roughly 37%. The vast majority of this short-term capital isn’t fresh chasers, it’s investors who entered a few months ago and are sitting tight.
Strip out this band and look only at coins 3 months old or younger, and we’re already at bear market floor levels.
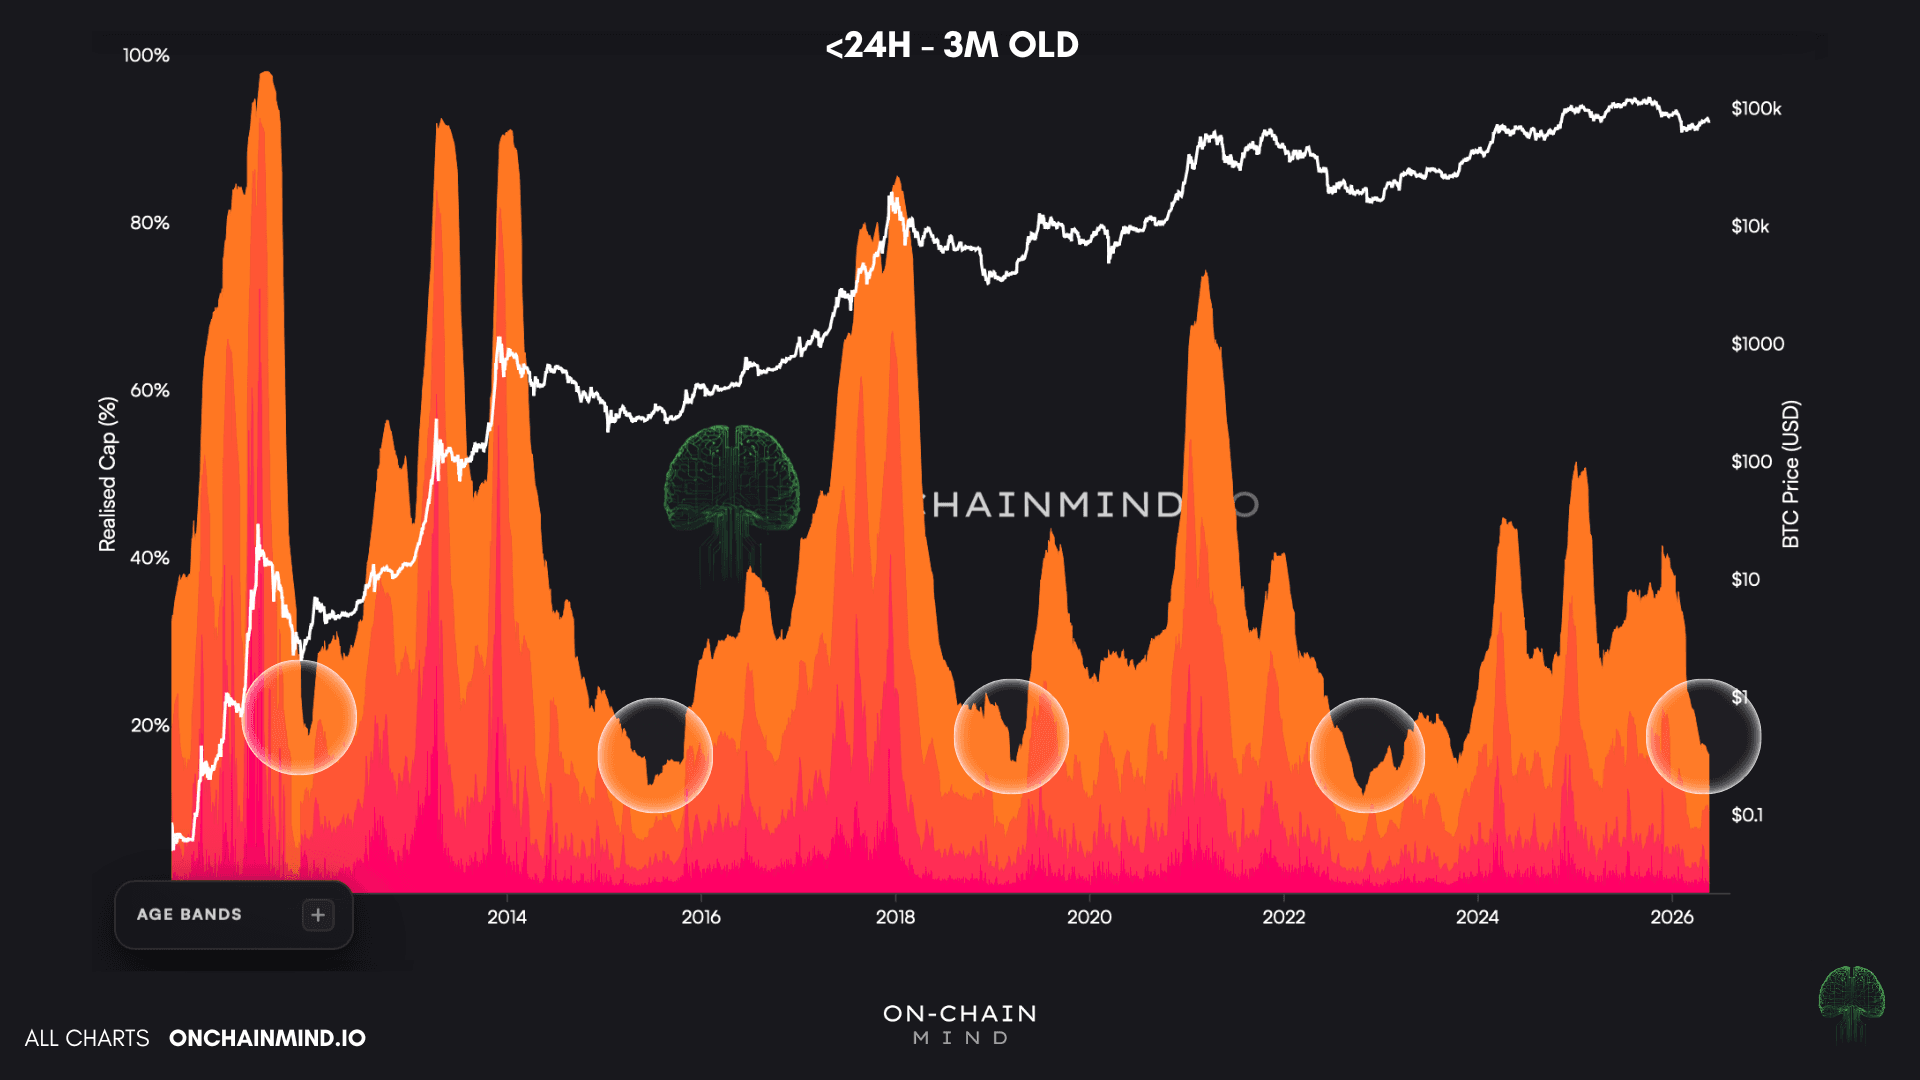
View live in OCM Studio: STH Realised Cap HODL Waves upto 3 months
What this points to is something I’d call “delayed maturity”.
The capital that arrived months ago hasn’t panicked, but it also hasn’t yet aged into long-term holder status. If those holders simply continue to do nothing, the chart will continue dropping into cycle-low territory without requiring any further price capitulation.
This is time doing the work that price would otherwise have to do.
The Part I Think Most People Are Missing
When I pull these three charts together and stare at them long enough, my conviction in what I’ve been arguing for months only gets stronger. We are not sitting on the precipice of some terminal collapse. We’re in the late stages of a structural reset, and the on-chain footprint is pretty much screaming this.
The long-term holder cohort is swelling, but the honest interpretation is that previous cycle-top buyers are graduating in. The exit of speculative hot money, combined with the complete silence from old-school whales, points toward a market that is utterly exhausted of sellers. And what remains of the short-term capital is increasingly composed of holders simply waiting to age out of the cohort.
None of this guarantees Bitcoin can’t trade lower. On-chain analysis isn’t a price oracle. But in my view, we simply do not need a violent, price-based capitulation to finish this cycle. What we are experiencing right now is a time-based capitulation, a grinding phase designed to test patience rather than risk tolerance.
The market has already absorbed an enormous flush of speculative capital. What it needs now is for the remaining young coins to age, for the old coins to keep sleeping, and for sentiment to remain miserable enough for long enough that the structure tightens completely.
Once that happens, it really doesn’t take much. A small shift in demand, a marginal change in sentiment, and the same market everyone has written off starts moving in a direction that catches the majority entirely off guard.
That’s how Bitcoin cycles work, every single time.