
The last time Bitcoin reached this level of statistical downside pressure, it was trading at $16,000. Sentiment was bleak, and the “crypto is dead” narrative had become the default across every major outlet.
Sound familiar?
What followed wasn’t a slow recovery. It was a 150% expansion that carried Bitcoin back to $42,000 within a year. And now, whether it feels like it or not, we’re back at a remarkably similar crossroads.
So let’s break down the 3 separate ways you can actually position around this.
Key insights
The Mean as Gravity: Bitcoin price oscillates around a dynamic average, eventually snapping back from extreme statistical overextensions.
The 92% Edge: Historical data shows that entering at current downside levels leads to profit within 12 months.
Probability vs. Velocity: Deep red entries offer 97% certainty, but early green trend-following generates the highest 12-month historical returns.
Two Games, Two Strategies: Short-term success relies on momentum, while long-term wealth is built by fading extreme market sentiment.
The Market Isn’t Emotional — You Are
Most investors interpret Bitcoin through emotion. Price drops feel like risk. Price rises feel like safety. But this is backwards.
Markets don’t reward how something feels. They reward positioning relative to probability. That’s the shift here. Instead of asking whether Bitcoin is “cheap” or “expensive”, the better question is:
How far is price stretched from its historical norm, and what usually happens next when we reach this level?
This is where statistical frameworks like Z-Score Probability Waves become incredibly powerful.
At a basic level, it measures how far Bitcoin’s price has deviated from its long-term average, expressed in standard deviations. It removes noise. It normalises volatility. And most importantly, it allows you to compare today’s market conditions against the entire historical dataset on a like-for-like basis.
What this reveals is something far more useful than price alone: it shows you when Bitcoin is behaving abnormally.
Right now, Bitcoin sits around -1.5 standard deviations below its long-term mean. That might not sound dramatic, but in statistical terms, it’s meaningful. It tells you that price is not just below average; it’s meaningfully below average relative to its own history.
So at the current level of in the low $70,000s, the model suggests that while the price might feel high compared to the $16,000 lows of 2023, it is actually still sitting in a zone of significant historical value.
One of the most powerful realisations this model provides is the ability to quantify "worst-case scenarios" without asking your favourite bear on Twitter.
Currently, the most extreme downside deviation sits in the low $50,000s. A more typical "bad" scenario, within standard deviation ranges, is closer to $68,000. When you compare these figures to the mean reversion gravitational centre, which currently sits at $97,000, the asymmetry becomes glaringly obvious.
The majority of the downside risk has likely already been expressed, while the path of least resistance leads toward that $97,000 equilibrium.
View live in OCM Studio: Z-Score Probability Waves
The Performance Paradox
If we acknowledge that we are in a high-probability zone, the next logical question is: how should one actually position themselves? This is where the data reveals a fascinating paradox.
When I analysed the historical win rates of various entry points, the results were counter-intuitive to how most people think about "buying the dip".
If your primary goal is absolute certainty, you buy in the deepest red zones. Statistically, if you only buy Bitcoin when it is at its most extreme downside deviations, you have a 97% probability of being in profit 12 months later. That is as close to a sure thing as you will ever find in a financial market.
However, there is a catch: being early often feels like being wrong. When you buy in the deep red, you are buying into a falling knife. You may have to endure months of sideways grind or further paper losses before the reversal eventually takes hold.
Surprisingly, if your goal is not just to be right, but to maximise your total return (the velocity of your capital), the optimal entry point isn't the deepest red. Instead, it is the moment the indicator first begins to transition into green.
At this stage, the win rate drops from 97% to around 77%. You are slightly more likely to be caught in a fake-out, but when you are right, the magnitude of the move is significantly larger, averaging over 230% returns over the following 12 months.
This happens because of market structure. By waiting for that first green flicker, you are no longer trying to catch a falling knife; you are reacting to the re-establishment of a trend. You are sacrificing 20% of your win rate for a massive increase in explosive growth.
This is the difference between an "accumulation" mindset and an "expansion" mindset. Neither is right or wrong. The investor who buys at deep red values is playing the long game of statistical asymmetry. The investor who buys at the first sign of a green print is plaiting the game of maximising the 12 month timeframe.
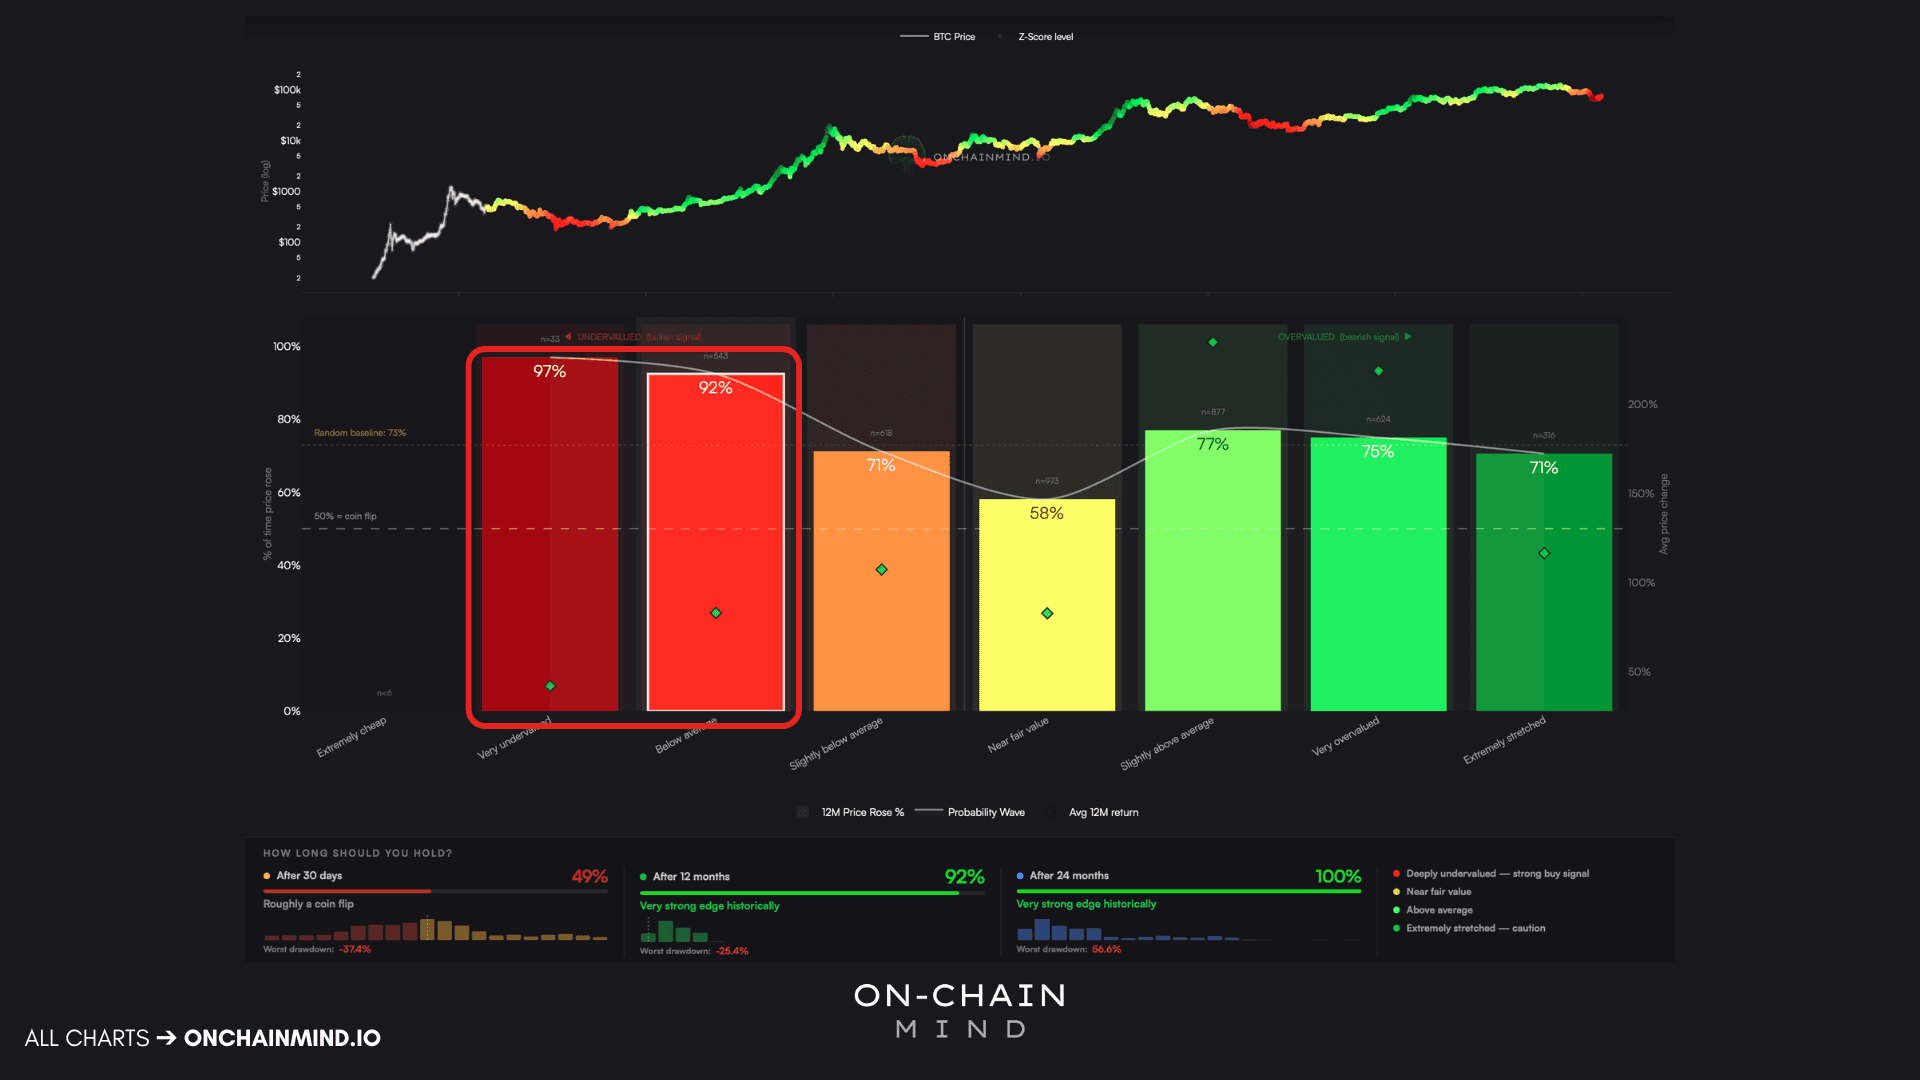
View live in OCM Studio: Z-Score Probability Model (Investor View)
On shorter timeframes, Bitcoin is currently sitting very close to its mean of $77,000. This creates a 50/50 distribution. In the short term, there is no statistical edge right now. This is exactly where retail traders get chopped up.
They try to use long-term signals (like the 92% win rate) to justify high-leverage short-term trades. But the 30-day market is dominated by momentum and reflexivity, not mean reversion.
To succeed, you must match your strategy to your timeframe:
In the short-term, chasing strength actually works because of momentum.
In the long-term, fading extremes is the only way to survive.
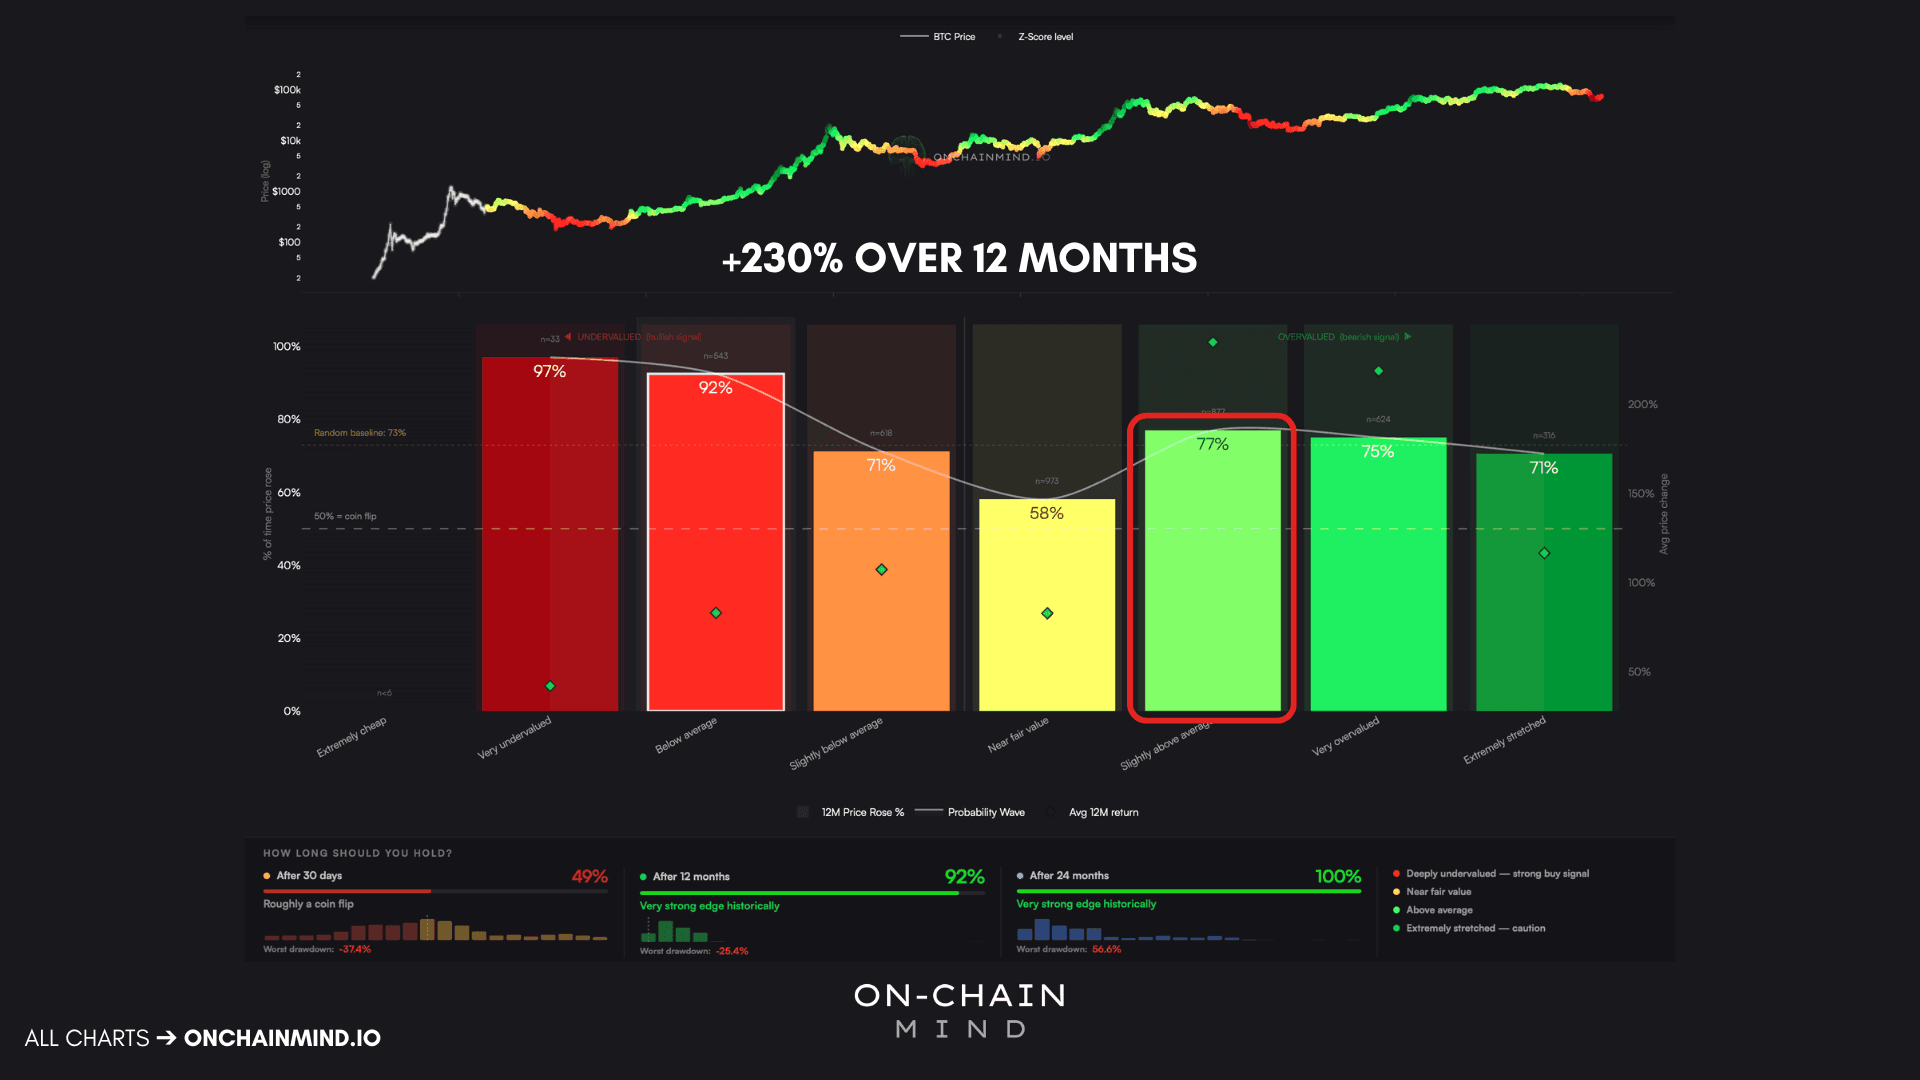
View live in OCM Studio: Z-Score Probability Model (Trader View)
Watch the video walkthrough on YouTube
Continue reading with OCM Premium
You have been reading the free preview of this article. The rest of it (about 550 more words) is for OCM Premium members. See OCM Premium plans.