
Every Bitcoin bear market has followed roughly the same script. Different cast, different decade, same beat. And when you look on-chain, you can actually watch that script play out every time, instead of guessing from a candlestick chart and a bad feeling in your stomach.
This article walks through two of the most powerful frameworks I use to understand where we are in a Bitcoin bear cycle, how long Bitcoin typically lingers there, and which price levels history tells us to watch closely.
The path to the bottom is not a mystery, it is a process of structural replacement.
Let’s get into it.
Key insights
The Cost Basis Crossover: Short-term and long-term holder cost bases have converged at every single Bitcoin bear market bottom in history.
The 50% Threshold: Around half of all Bitcoin supply has historically sat in loss at the point of maximum bear market stress.
Time Pain, Not Price Pain: Both frameworks suggest the remaining bottoming process is likely to be time-based rather than a dramatic capitulation event.
Where We Are Now: Current readings point to a structural reset forming over the coming months, with consolidation likely stretching into late 2026.
The Two Most Critical Cost Bases in Bitcoin
There are two primary groups that dictate the direction of the market: short-term holders (STHs) and long-term holders (LTHs).
Short-term holders (STHs) represent coins held for less than 5 months. These participants are highly emotional, sensitive to volatility, and tend to panic during price drops while chasing gains in uptrends. In short, they behave like humans, which is why they tend to lose money.
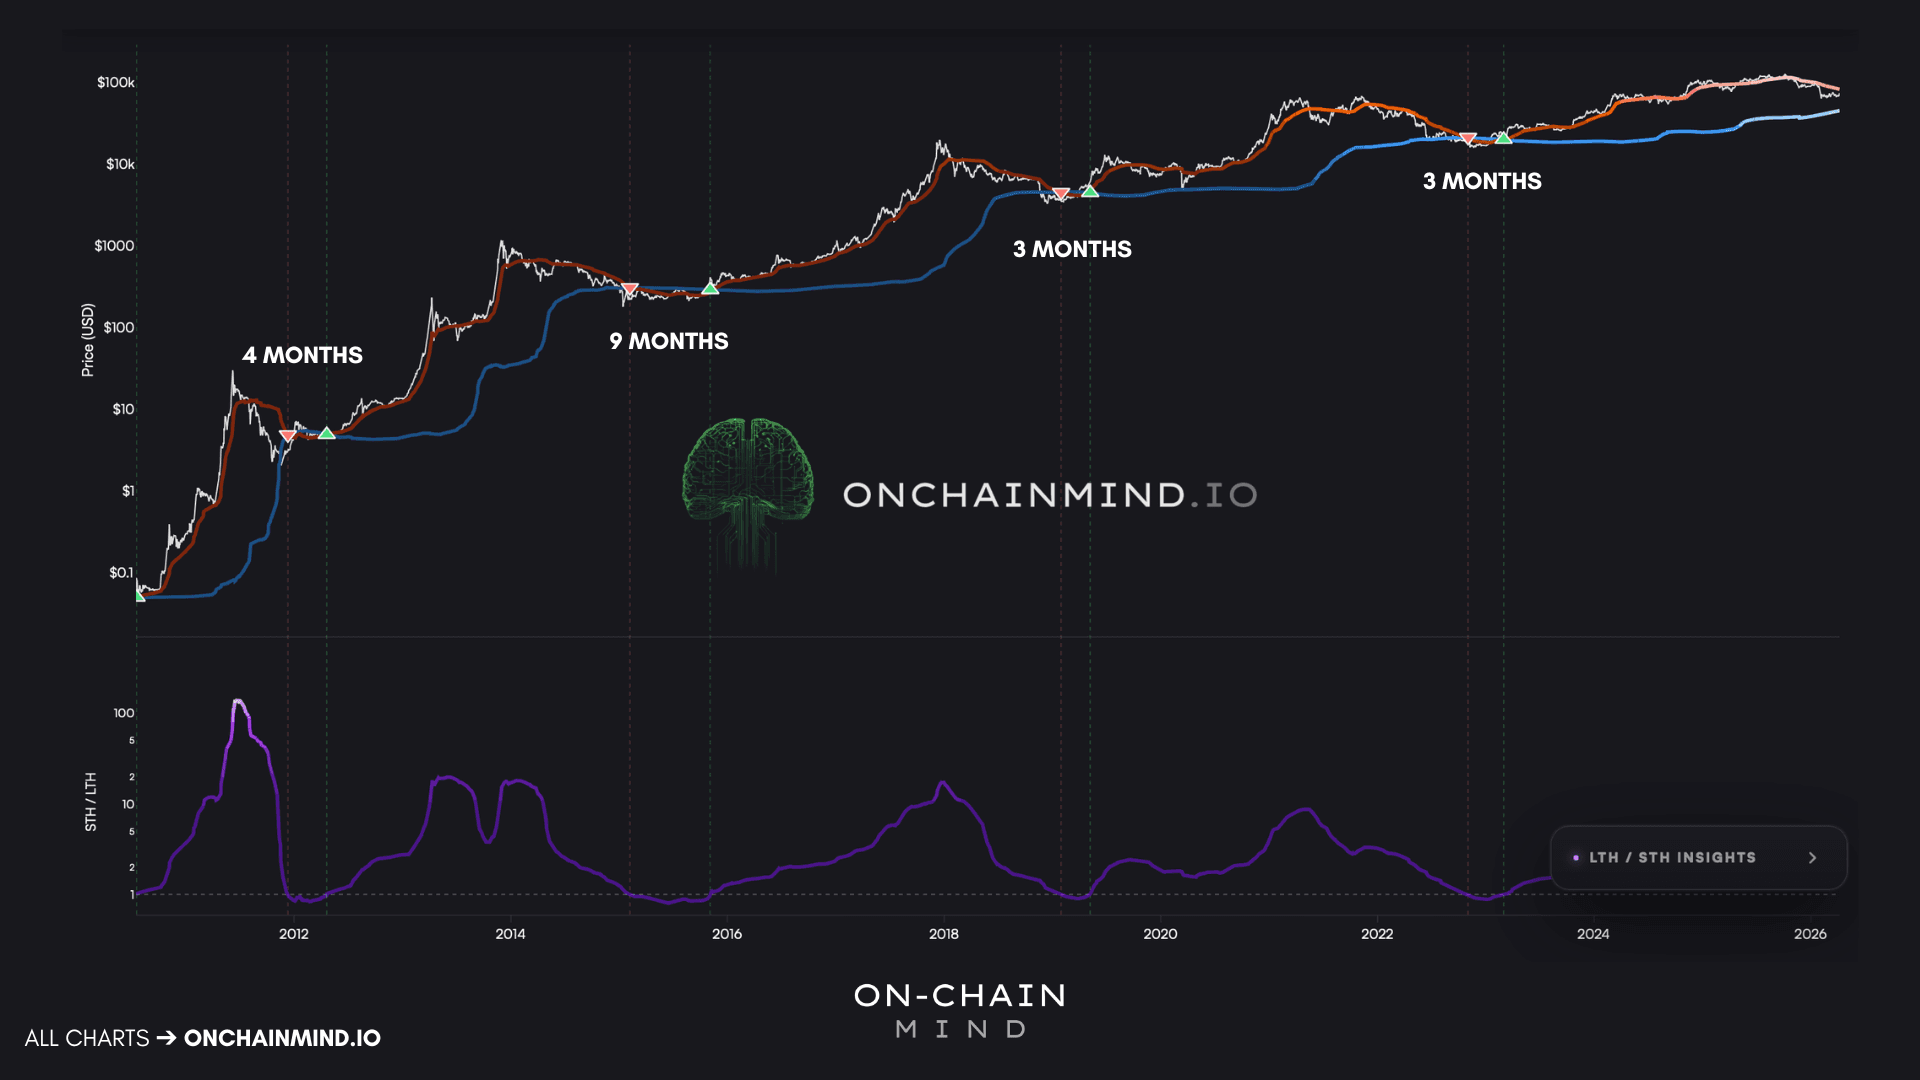
The short-term holder realised price (orange line), currently around $81,000, indicates the average price this cohort paid for their Bitcoin. In bull markets, the short-term holder realised price acts as support, because newer investors are sitting in profit and feel confident enough to buy dips.
In bear markets, the same level flips and acts as resistance, because those same participants are now underwater and desperate to exit anywhere near breakeven. The same line, doing opposite jobs, depending entirely on whether the cohort feels good or bad about themselves.
The second (blue) line is the long-term holder realised price, currently sitting at around $44,000. As you would expect, this is the average price paid by holders who have held for at least 5 months, and very often a great deal longer.
These are the seasoned participants. They have been through this before, they are generally less reactive, and they make more rational decisions because they have already had their souls crushed in a previous cycle. Because of all that, this line moves slowly, and price very rarely comes anywhere near it.
The STH/LTH Divergence
Both lines are useful in isolation, but the real magic happens when you measure the divergence between them.
During the peak of a bull market, the gap between the short-term cost basis and the long-term cost basis expands rapidly as new money floods in at higher prices. But when a bear market takes hold, these two lines begin to converge.
This convergence is not a fluke: it is a structural necessity for a bottom to form.
As short-term holders capitulate and sell their coins at a loss, those coins are often picked up by long-term holders. Or if the pain of selling at a loss is intolerable, they simply "graduate" into the long-term cohort after 5 months. I have been there myself. I bought near a top once, and in many ways, I think it is probably a rite of passage for anyone serious about Bitcoin/crypto.
This creates a two-sided compression where the short-term cost basis falls due to realised losses, while the long-term cost basis is pulled up by investors who bought higher but refused to sell. When these two lines finally meet, it signals that the majority of forced selling is over and the market has reached a state of equilibrium.
This convergence is not just a quirk. It is a structural feature of Bitcoin’s market cycles since the very beginning.
How Long Does the Bottoming Take?
Here is where it gets interesting. If you look at previous cycles, once the crossover happens, Bitcoin does not immediately rocket. It enters a period of consolidation.
In most cycles, this lasts roughly 3-4 months. The only real exception was 2015, where the market spent closer to 9 months chopping around and building that base.
Bringing this into the current cycle, the two lines are already converging quite rapidly. Since the bull market peak back in October, the short-term holder cost basis has fallen from around $113,000 to roughly $81,000. At the same time, the long-term holder cost basis has risen from about $36,000 to $44,000.
They are clearly on a collision course.
To estimate when they might actually meet, I ran an exponentially weighted log-linear regression to project the trajectories of both lines. This is not a crystal ball. It is just a way of framing the current trend in some rough numbers.
Based on the current slopes, the model suggests it could take ~23 weeks, so roughly 5 months, for the lines to fully converge. That puts us somewhere around September. Layer on the historical 3-4 month consolidation phase, and you start to see a transition back into a bull phase potentially occurring towards the very end of the year.
Profitability Across the Entire Network
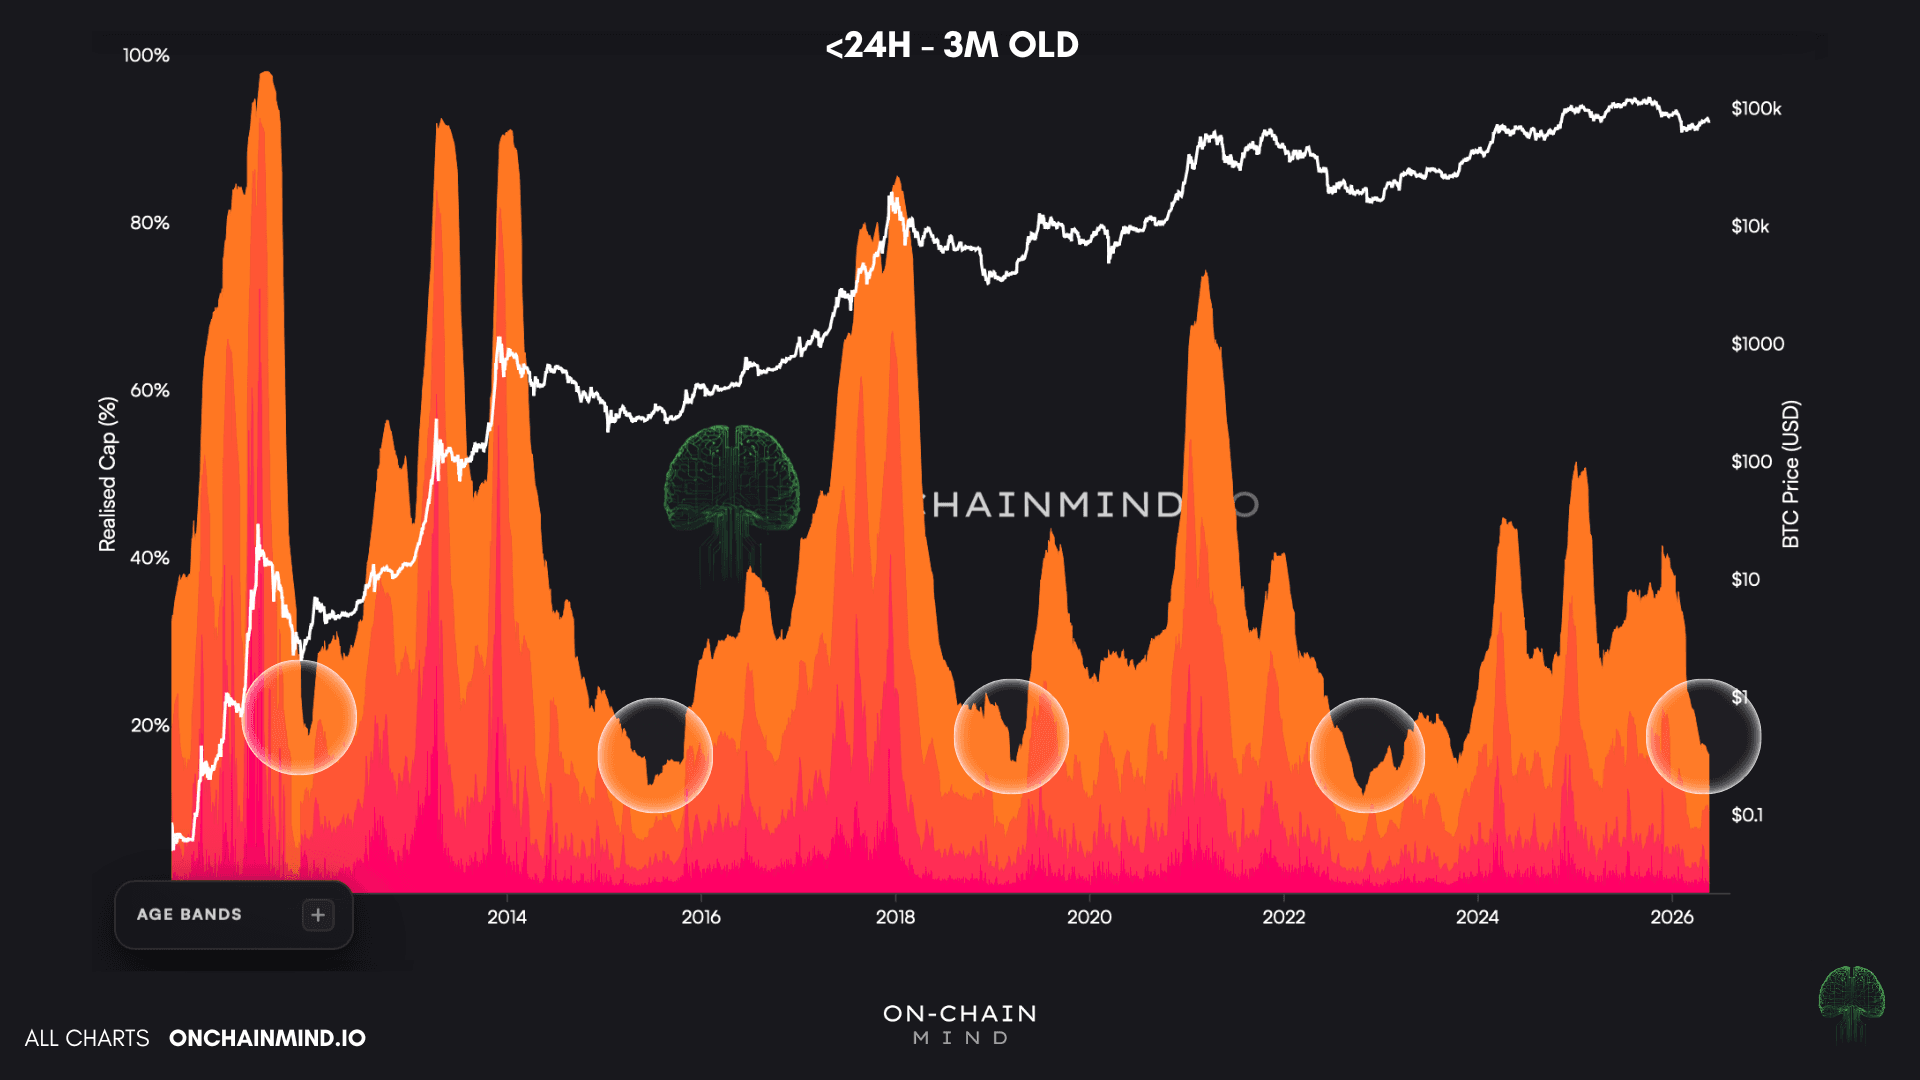
The second framework looks at profitability across the Bitcoin network. Specifically, the percentage of the total Bitcoin supply that is sitting in profit vs loss. This is perhaps the most honest metric in existence.
And once again, a very clear pattern emerges: at every major bear market bottom in Bitcoin's history, roughly half of the entire supply at the time has ended up sitting in loss before the final bottom is formed.
Right now, about 43% of the total Bitcoin supply is sitting in loss at current prices of around $71,000. So despite what anyone might tell you, we have already experienced a significant amount of pain. Nearly half the market is underwater. Historically, that means we have done a lot of the heavy lifting required to form a bottom.
But I would say we are not quite there yet. In every major Bitcoin bear market (2011, 2015, 2018, and 2022) the final bottom was only reached when roughly 50-55% of the total Bitcoin supply was held at a loss. At 43%, we are close, but not quite at the level that has historically marked maximum stress.
And just like with the cost basis model, this metric does not spike and then immediately reverse. It hovers around that 50% level for a period of time, producing the same grinding sideways behaviour as the market processes all the pain.
In terms of price levels, you cannot directly map a percentage of supply in loss to a specific future price because the network is constantly evolving, but you can approximate it using a short-term log-linear regression.
Based on current data, for 50% of supply to be in loss, Bitcoin would need to be around $63,000 as of today. For a deeper stress scenario of around 60% of supply in loss, the price would be closer to $53,000. That gives us a rough zone of interest between roughly $55,000-$65,000 for a potential ultimate short-term bottom, based on current conditions. Not a hard prediction, but an area of interest to monitor as the new data comes in.
Bottoms Are Built, Not Printed
Here is what I actually think is going on, and why I find these two frameworks so useful when I need to keep my own emotions in check.
The first model is telling us we are moving towards structural reset territory, where the famous crossing of the two most important cost bases occurs. We are not quite there yet, but the trajectory is unmistakable.
The second model is telling us a lot of pain has already been realised, but if history rhymes, there is likely still a bit more to come.
Crucially, both frameworks point towards the same conclusion: the majority of the pain is probably behind us, but the remainder is likely to be time-based rather than price-based.
In other words, instead of one dramatic final capitulation event with a viral candle that everyone screenshots, what I think we are more likely to see is a prolonged period of consolidation. It’s still my base case. A market that feels slow, frustrating, and directionless. The kind of market that quietly thins out the audience and tests whether you actually believe what you say you believe.
And honestly, that is exactly what a bottom looks like. It is a process. It is not obvious, and it does not announce itself with a bell. By the time you look back and see the bottom zone on a chart, it always seems clean and inevitable, but when you are inside it, it just feels like nothing is happening, forever.
The thing I want you to take away from this is not the specific price levels or the September estimate. Those will move. What I want you to internalise is the shape of how Bitcoin bottoms form, because once you can see that shape clearly, you stop being shaken by every red day and you stop being seduced by every dead cat bounce. You start seeing the market for what it actually is, which is a slow transfer of coins from people who cannot handle them to people who can.
If history is any guide, that process is already well underway. And if you ask me, that is genuinely something to be quite excited about, even if the next few months feel like watching paint dry.