

Everyone is arguing about the one number that matters least over any horizon worth holding.
Strategy's mNAV has fallen roughly 77% from its November 2024 peak. The stock has just rallied more than 70% in a matter of weeks.
Both of those things are true at the same time, and the fact that they can be is the whole problem.
For the best part of a year, the bear case has been the collapse of the sentiment premium. Now that price has ripped, the same crowd has quietly switched to calling MSTR a leveraged Bitcoin play. Neither camp is lying to you. Neither has the mechanism correct either.
There's a piece of pioneering equity research from 2009 that settles this. It's just never been applied to Bitcoin. So I did.
Let's get into it.
Key insights
Percentiles Beat Precision: How you calculate mNAV barely matters. Where it sits against its own history matters enormously.
The Morgan Stanley Parallel: Valuation multiples drove 46% of one-year stock returns, but only 5% over a decade.
A Sevenfold Decay: mNAV explains 42% of MSTR's monthly returns and collapses to just 6% over 4 years.
Sats Per Share Wins: Stack growth and share dilution together account for over 71% of 4-year performance.
The Multiple Everyone Fights Over
MSTR has put its holders through it. From over $450 in July of last year down to the $80 region only 12 months later, then a violent 70%+ recovery that caught the bears flat-footed yet again.
Underneath that, the sentiment premium has been in freefall.
mNAV is down about 77% from its November 2024 peak, and it has now spent almost a full year beneath its own 200-day moving average, which has been devastating for the stock price.
And the calculation itself is one of the most hotly contested topics in the treasury space, with everyone convinced theirs is the correct one.
I have stopped caring which one wins.
What I care about is the percentile. Pick whatever method you like, then measure it against its own history. That single reframe turns a contested accounting argument into a usable valuation tool, because it stops asking whether the number is right and starts asking whether the number is stretched.
The percentile view of mNAV has called bear market bottoms and bull market tops with extreme precision. Check it out.
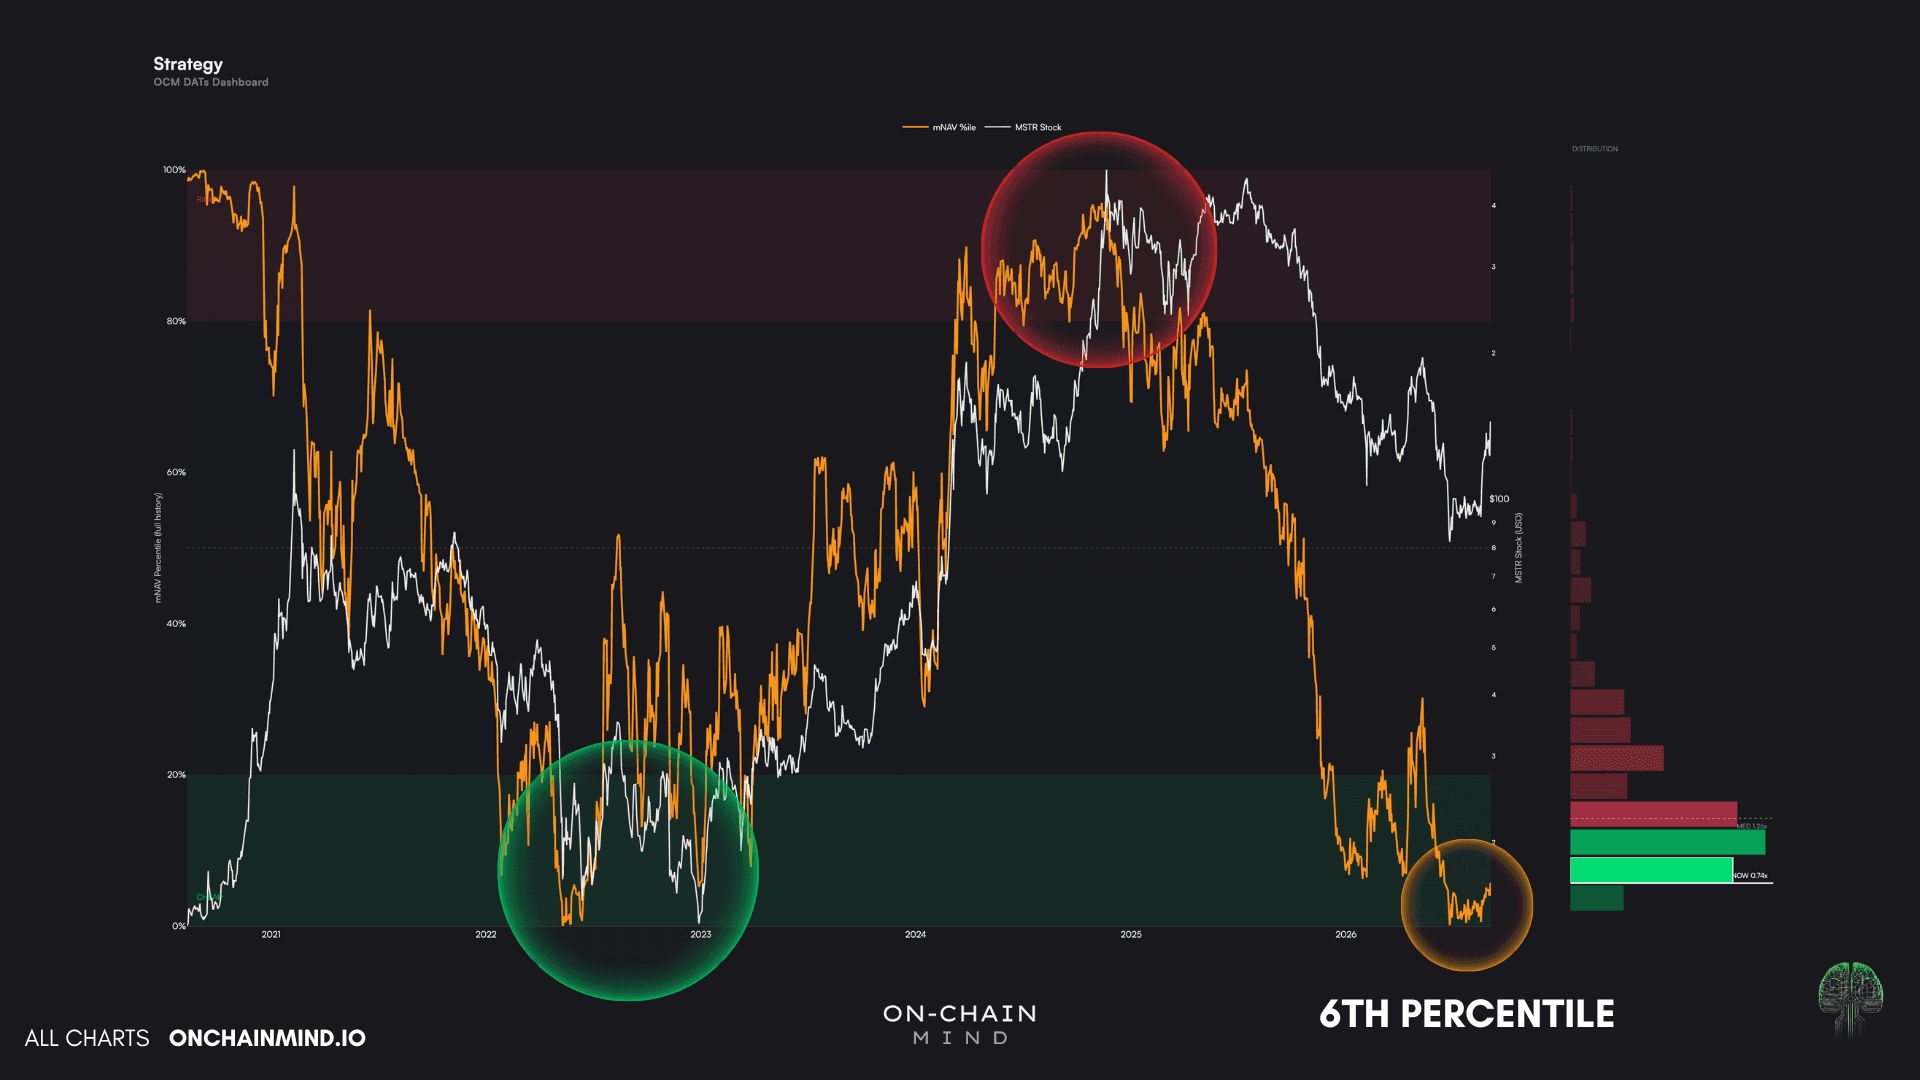
View live in OCM Studio: mNAV Percentile
When MSTR printed the $80 handle, mNAV was in the 1st percentile of every reading it has ever produced.
Today, after a rally of more than 70%, it is still only in the 6th percentile.
Sit with that for a moment. Price has moved enormously and sentiment has barely lifted off the floor. Whatever drove that move, it was not the crowd rediscovering its affection for the equity.
What Morgan Stanley Settled Back in 2009
If you invest in equities at all, you have heard the argument about what really drives long-run stock performance:
Consistent free cash flow?
Extreme revenue growth?
Superior returns on capital?
Everyone has a favourite and almost nobody has the evidence to back it up.
Morgan Stanley actually sat down and quantified it, across the whole S&P 500, over multiple decades.
Over a 1-year horizon, 46% of a stock's return came down to the multiple it traded at. Just the multiple, normally the price-to-earnings (P/E) ratio, the crudest overpriced-or-not gauge in the business. Almost half of a year's performance, explained by what you paid relative to earnings.
Then they extended the horizon, and the finding inverted.
Push out to 3 years, 5, then 10, and the entry multiple mattered less and less, until it accounted for only 5% of the 10-year return. Buy a stock at a historically absurd valuation and yes, your next 12 months will probably hurt. Over a decade, it barely registers.
So what replaced it? The biggest driver was by far revenue growth, which explained roughly 29% of 1-year returns, went on to contribute just under three quarters of total performance over 10 years.
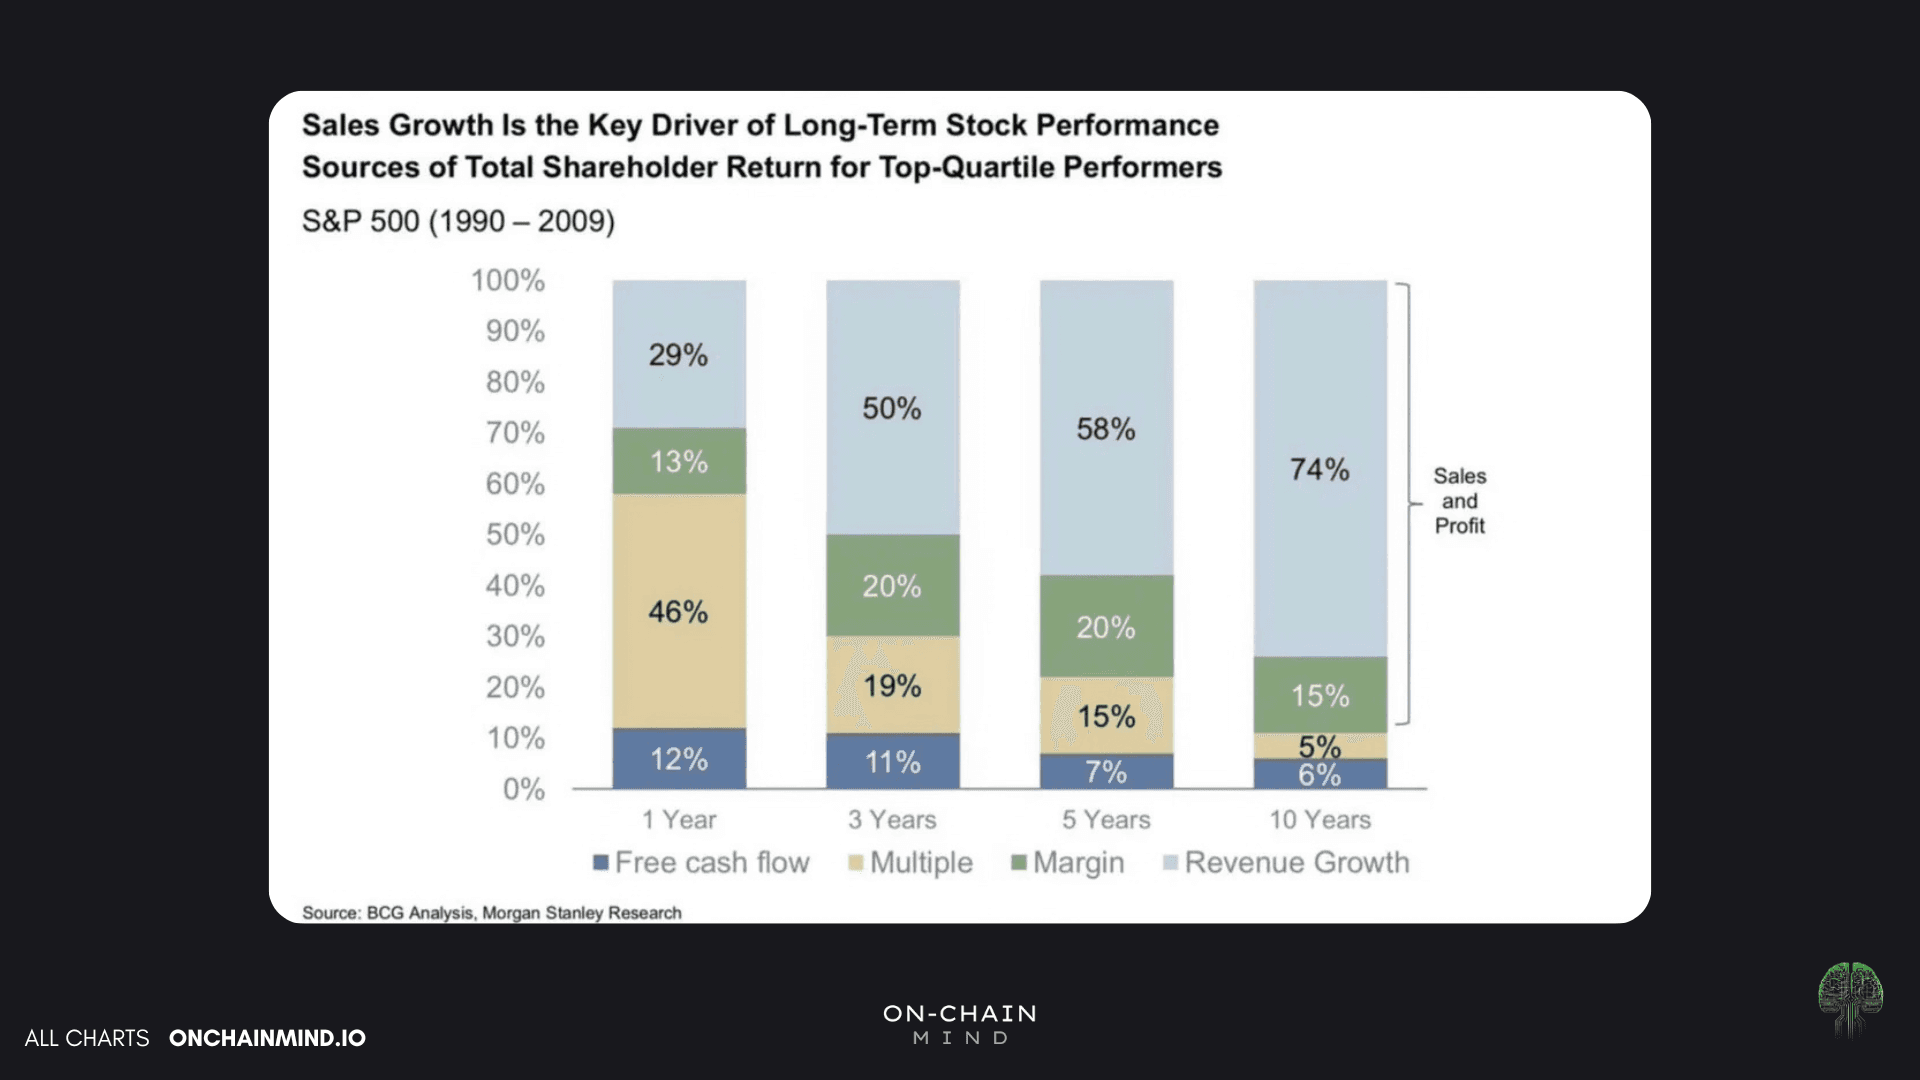
View live in OCM Studio: Morgan Stanley 2009 Stock Research
That is the entire lesson: sentiment prices the near-term, compounding prices the long-term.
Now, MSTR does not have a meaningful price-to-earnings ratio in the classical sense, so anyone reaching for one is looking at the wrong instrument entirely. But it does have a sentiment multiple, and mNAV behaves almost identically.
Like we said, the absolute number is meaningless in isolation. Some stocks live at single-digit multiples, the large-cap tech names sit in the 20s and 30s, and the hype names have held triple digits for years.
You cannot compare apples with oranges. You can absolutely compare current oranges with past oranges.
Running The Same Test On A Treasury Company
There are 4 things that can move MSTR's share price:
The sentiment on the business (mNAV)
The price of the underlying asset it holds (BTC)
The growth of the BTC stack itself
The dilution of common equity onto the market
Working that list out is not the clever part. Measuring which one dominates, and over what horizon, is.
That is what our new Horizon Attribution view does on the DATs dashboard.
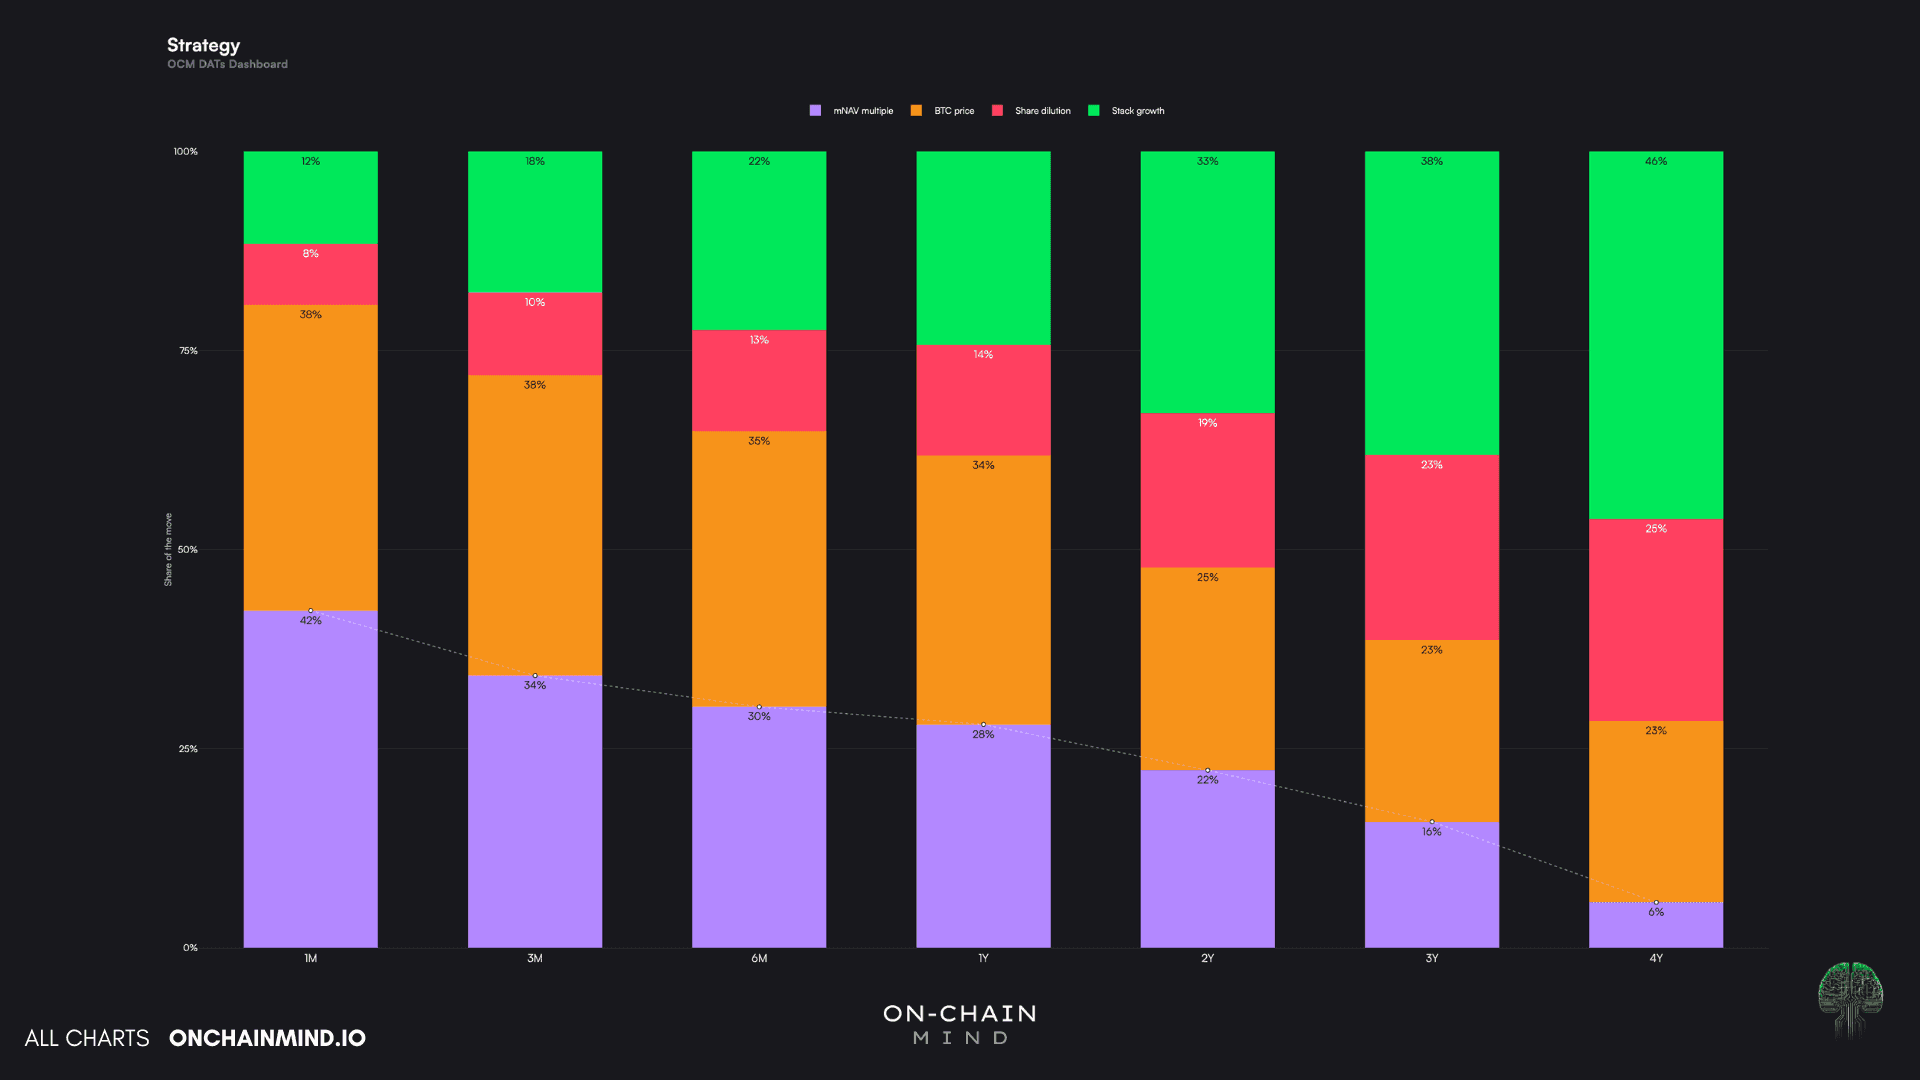
View live in OCM Studio: Horizon Attribution
It takes the Morgan Stanley framework and applies it directly to MSTR. And the pattern that came out genuinely surprised me.
Over 1 month, the multiple accounts for 42% of returns. Over 1 year, it fades to 28%. Over 4 years, it collapses to 6%. You are staring at a sevenfold decay in the importance of the thing everyone argues about, and it maps almost perfectly onto decades of traditional equity data.
Short-term emotion dominates short-term price action. We know this instinctively in Bitcoin. It turns out the treasury vehicles obey exactly the same law.
So what takes over across 4 years?
Stack growth comes in at 46%, and share dilution at 25%. Bundle those two together and you essentially have Satoshis per Share explaining over 71% of everything the stock has done. The Bitcoin price, the thing the leveraged-play crowd hang their entire thesis on, accounts for just 23% over that same window.
Obviously if Bitcoin goes to zero, so does MSTR. That is a given and not worth arguing about. But conditional on it surviving, outperformance is not a story about the multiple, and it is not really a story about spot either.
There's one final way to view this, and that's by overlaying the attribution on top of price, to see what moves were driven by what. It reads pretty cleanly.
This bear market has been a mix of Bitcoin dragging it down and mNAV compression dragging it down further.
It should come as no surprise that the recent 70% rip is almost entirely due to Bitcoin's price revival.
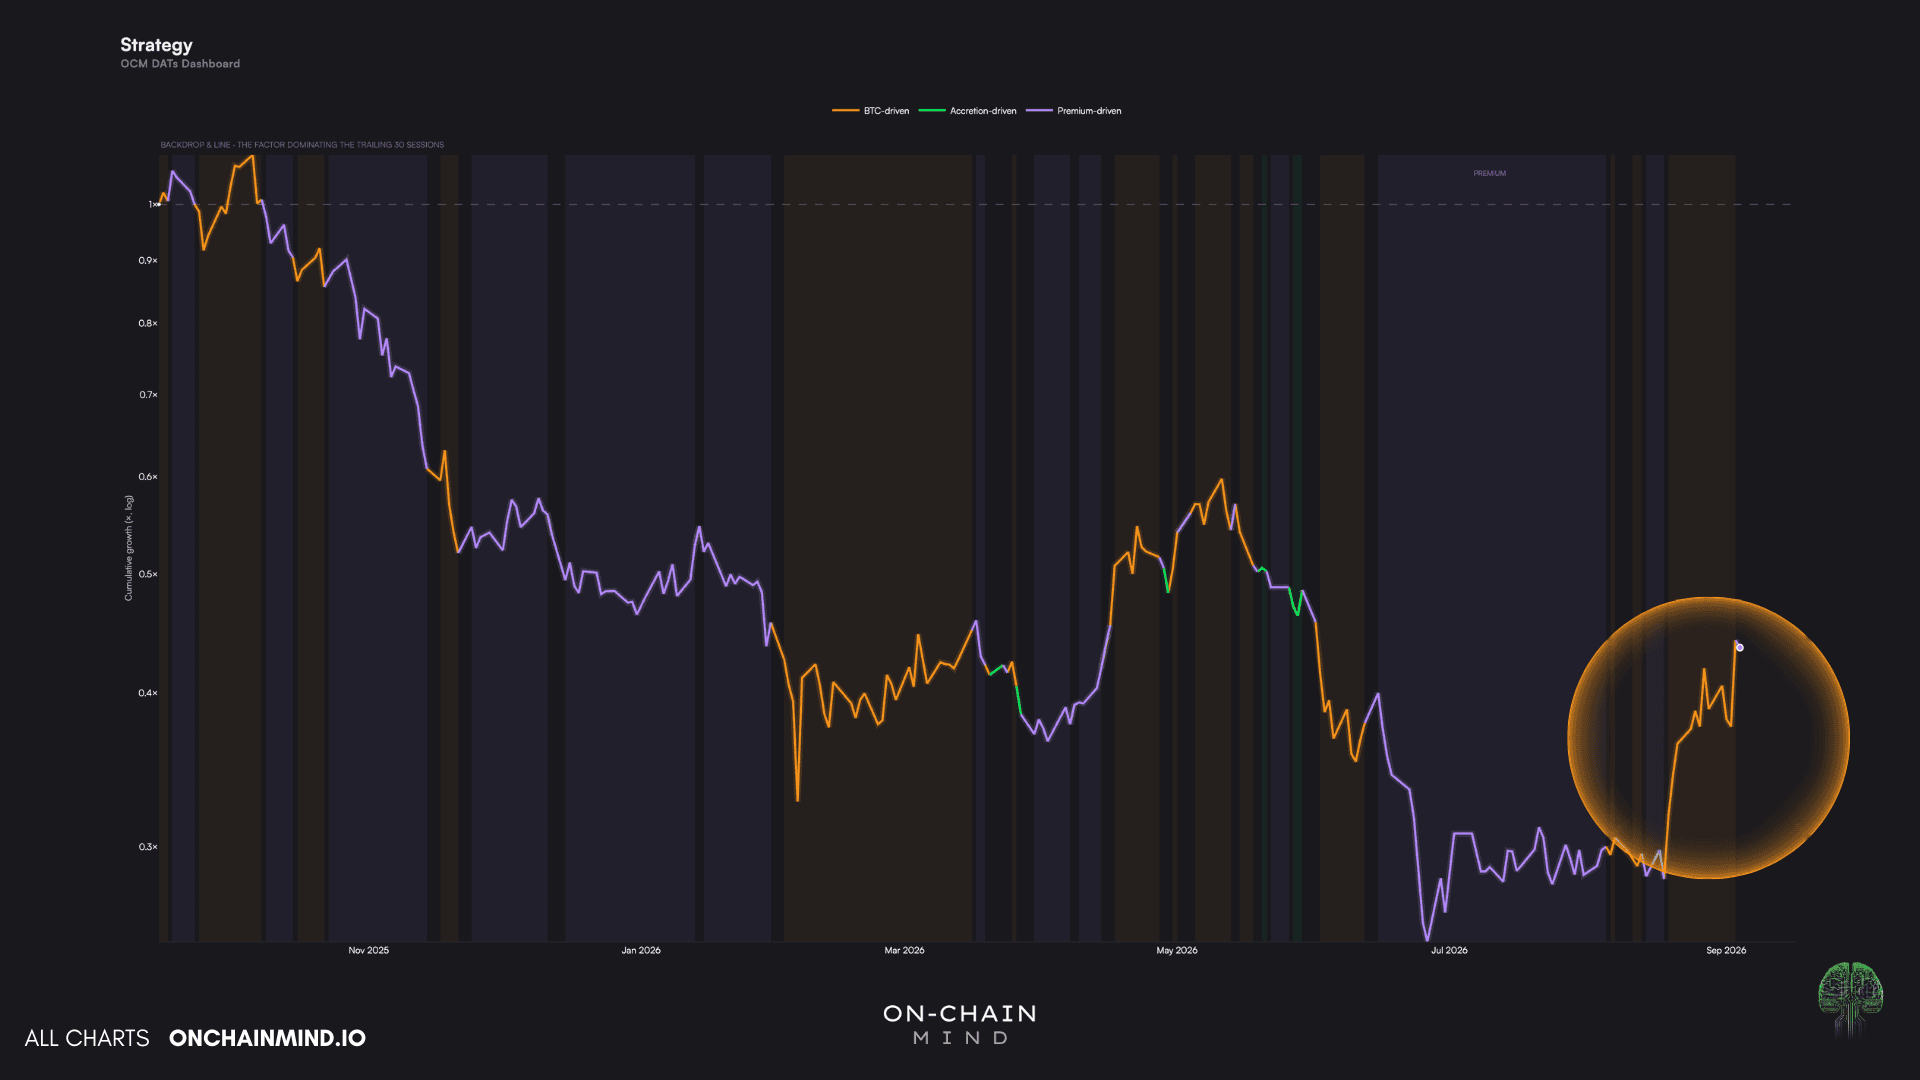
View live in OCM Studio: Attribution on Price
Where I Land On This Data
I always like to talk about the limitation before I give you the conviction.
Our sample is nowhere near what Morgan Stanley had. They had the entire cohort of the S&P 500 across multiple decades. We have roughly 2 cycles of a business model that has itself changed enormously inside that window, with new instruments, new capital structures and a completely different shareholder base at the end than at the start.
So no, I cannot promise this attribution holds forever. Because it might not.
But the parallel with multi-decade equity research is close enough that I think we are looking at a real mechanism rather than a coincidence of a few cycles. Two entirely separate datasets, built on entirely different assets, landing on the same shape of curve. That is not the sort of thing that usually happens by accident.
What it means practically is that your time frame decides how you play this data.
If you are trading MSTR over weeks or a few months, you should be watching Bitcoin's price action and the mNAV percentile, and nothing else really deserves much of your attention. That is where the explanatory power lives, and is all any good trader needs to make the correct short-term decision.
However, if you intend to hold for a year, 4 years or even longer, then honestly, the multiple is noise you are paying too much attention to. You need to be keeping a casual eye on whether the business is increasing Satoshis per Share over time. That is it.
You can optimise for perfect entry timing, and honestly, the past month of price action has demonstrated that beautifully. But over an investor's (not trader's) horizon, the fundamentals matter more than anything.
And I think the reason this gets missed so consistently is that Satoshis per Share is boring. It moves slowly, it does not generate arguments on Twitter, and it never gives you a dopamine hit on a Tuesday afternoon.
mNAV does all three.
But this piece has reminded me that, once again, it doesn't matter whether we're investing in traditional equities, or short-term trading speculative Bitcoin proxies: human psychology never changes.
Multiples are sentiment, and sentiment mean reverts.
Compounding the underlying asset per share does not mean revert. It just accumulates.
Understand that difference, and you're free to be boring. Because boring, it turns out, is what wins.