
If we wake up in a few months to find Bitcoin trading at $63,000 again, for some, that would feel like the end of the world. For me, it would simply be the market doing what it has always done: rediscovering real value through discomfort.
We’re entering the decisive stretch of this post–all-time-high correction, and the next 6-9 months are almost certainly going to lock in the final low of the cycle.
In this article, I’m going to walk you through the exact levels I’m watching and how several independent on-chain and technical frameworks are converging on the same narrative.
Key insights
Volume Battlegrounds Reveal True Support: High-volume nodes act as price magnets because they represent where the most real money changed hands.
The Current Range: Bitcoin is building a genuine consolidation zone between $80k-$93k. A seemingly slow, deliberate base, and not a reflexive rebound.
The Structural Mega-Support: The Point of Control, Realised Price, and the rising 200-week MA are all converging near $63–65k over the coming months.
Bear Markets Bottom Slowly, Not Dramatically: True floors form through months of choppy accumulation, not single V-shaped reversals.
A Market in the Middle of Negotiation
Bitcoin’s current behaviour is a tale of negotiation. Markets don’t form meaningful bottoms through a single dramatic wick. They build them through argument, hesitation, re-tests, and eventually agreement. The range we’ve entered is functioning exactly like that: a slow-moving council of buyers and sellers debating fair value.
And to understand these debates, we need to look at where the market has genuinely spent its energy. Not where price passed through quickly. Not where it wick-tapped. Where the weight of actual human conviction took form.
This is where volume anatomy comes in.
Mapping Bitcoin’s Battlegrounds
We can look at volume in the usual simplistic way such as per candle, per day, per week. That view is tidy and convenient, but almost always misleading.
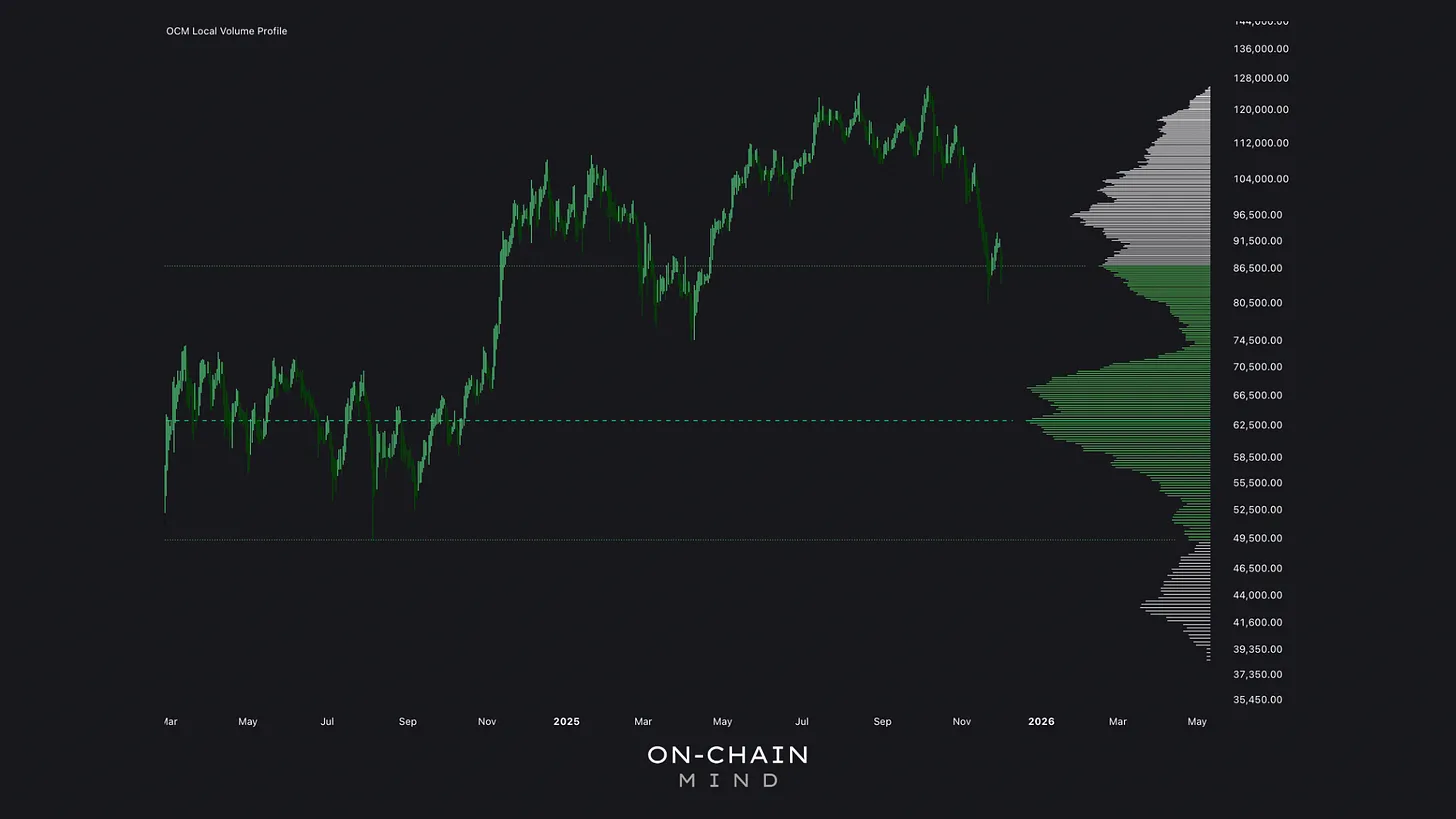
The Local Volume Profile approach is different. It reconstructs a granular distribution of volume across hundreds of micro-levels in the recent range. Instead of counting when the trading occurred, it focuses on where the activity actually clustered.
This gives us something far closer to truth: the real battlegrounds of the market.
These battlegrounds matter because:
They reveal where both sides fought hardest.
They show where traders had genuine conviction.
They often define long-term floors or ceilings.
Over the past year, one such battleground towered over the rest: the high-energy zone around $96,000. This was the place where buyers began reaching for 6 figure territory and sellers took profits at a major psychological threshold.
Once that zone broke recently, the next lower region at the Value Area High around $87,000 naturally became the gravitational centre. And it was always going to fall there fast.
The Horizontal Forest
Overlaying the Local Volume Profile is a second tool that gives us a completely different perspective.
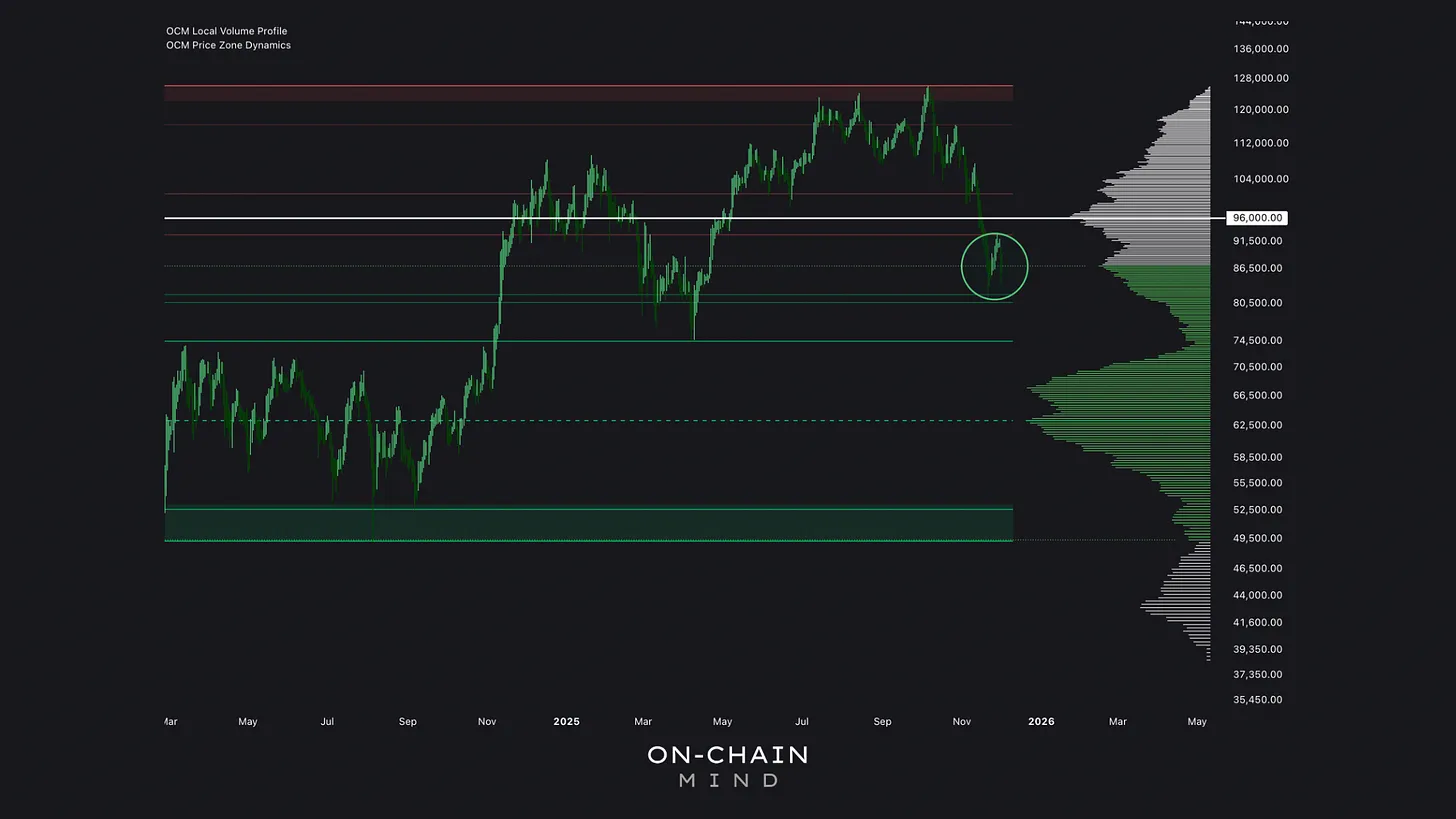
Rather than being volume-driven, the Price Zone Dynamics indicator sweeps across the chart to harvest:
Previous highs and lows.
SMA intersections.
Bollinger boundaries.
Fibonacci pivot clusters.
Swing points and structural turning zones.
This produces a dense forest of horizontal “candidate levels” of potential supports and resistances drawn from a wide spectrum of market logic.
But the key is what happens next: each level is graded based on historical interaction. The system doesn’t treat all levels equally; it recognises which ones the market respected most consistently.
When Volume Profile and Price Zone Dynamics align, you’re seeing a level of genuine market memory.
And right now, several of them sit uncomfortably close to current price.
A Bottoming Structure in Motion
Bitcoin is currently carving out a working range between $80,000-$93,000, which is a structure that looks similar to the early stages of a genuine local bottom. Every cycle forms its base in its own way, but all meaningful bottoms share the same defining trait: they take time.
There are no instant rebounds, no trapped-short squeezes pretending to be recoveries, and no miraculous V-shaped escapes. Instead, real bottoms emerge through repeated tests, failed breakdowns, soft rejections, gradual accumulation, and a slow compression of volatility. That’s the exact signature developing here.
Essentially, the market is trying to agree on the price at which it stops apologising for the previous rally and starts preparing for the next one.
If the Range Breaks
A break below $80,000 isn’t my base case, but it’s worth exploring what happens if we do lose that level with conviction.
When the local range fails, the next major structural support zone sits firmly in the mid-$60,000s. And it is supported by three entirely independent metrics that all converge at roughly the same price:
1. The Point of Control (POC)
Across the entire past 2 years of trading, there is one price at which Bitcoin spent more time and traded more volume than any other: around $63,000.
This is the POC, or in other words, the market’s centre of gravity.
When price falls in a prolonged downtrend, it often gravitates toward its deepest prior region of conviction. Not for any particular technical reason apart from the fact that the human herd remembers that zone. Traders feel comfortable there.
If $80k fails, this becomes the primary magnet.
2. The Realised Price
The Realised Price tracks the average on-chain acquisition cost of every circulating coin. Historically, it has acted as a deep accumulation zone and a structural pivot in every bear market.
It currently sits near $56,000 but is rising steadily. If price falls lower over the next several months, the Realised Price is likely to climb toward the same $63,000 region that houses the POC.
3. The 200-Week Moving Average
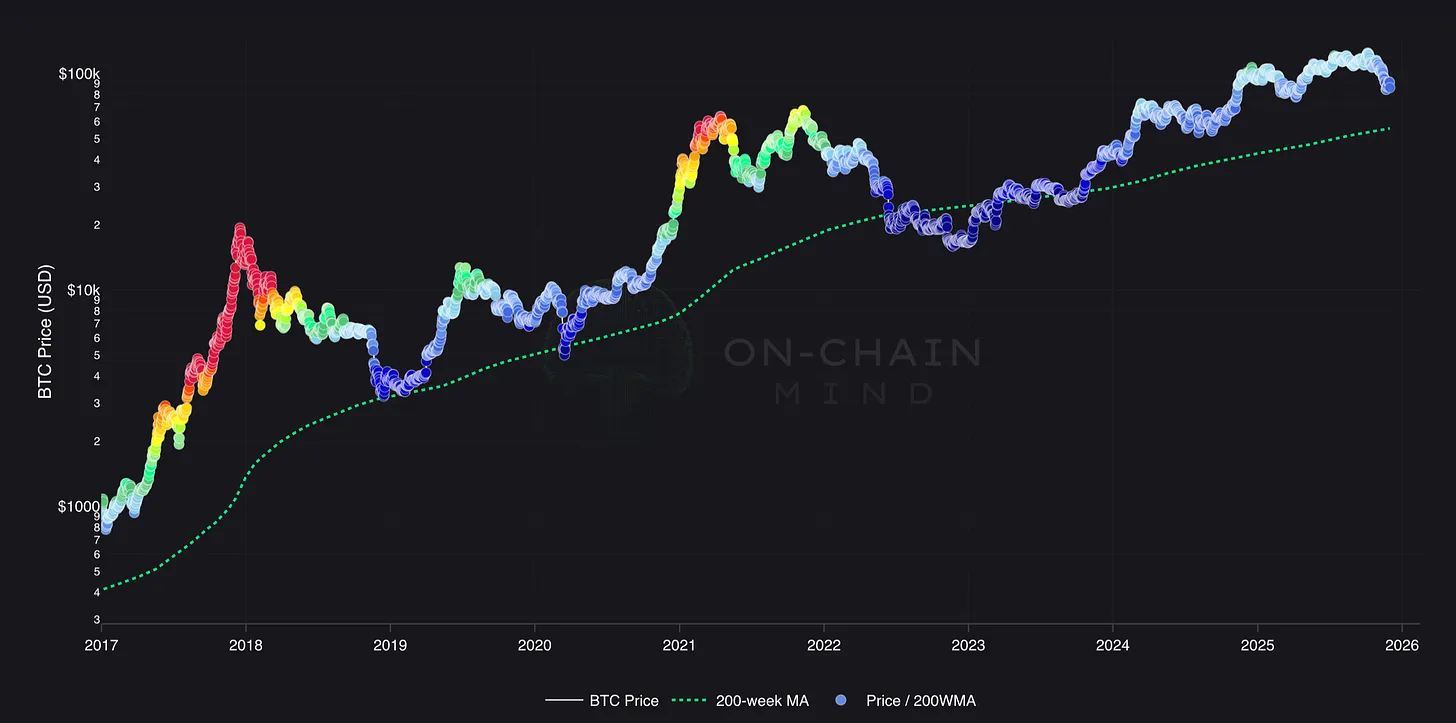
The 200W MA is the closest thing Bitcoin has to a fundamental trendline. Even in bear markets it continues sloping upward.
By analysing historical slopes (2014–15, 2018–19, 2022), we can estimate its natural trajectory. Even with a conservative growth rate assumption, that would place the 200W MA near $64,000–$66,000 by mid-2026 if we enter a prolonged drawdown now.
Three completely independent frameworks (volume, on-chain cost basis, and long-term momentum) are all pointing to the same zone. That is not coincidence. That is confluence.
The One Thing That Could Force Us There
Now let’s dig into what could actually pull Bitcoin down into those deeper levels, why this moment feels different even though it rarely ever is, and how I’m positioning myself as the market decides its next move.
So do I think we’re guaranteed to hit the mid-$60,000s? No. My base case remains that this current range likely builds out and we grind out a healthy consolidation here.
But there is exactly one scenario that would change my mind overnight: a broad risk-off event in traditional markets.
Bitcoin is still treated as a high-beta risk asset by institutions. A sharp correction in the S&P 500 or a blow-up in AI narrative mega-caps (e.g. Nvidia) would drag Bitcoin lower regardless of its own fundamentals. In every previous macro shock in recent history, Bitcoin fell harder and faster than equities. In that specific situation, the mid-$60k region becomes a logical landing zone.
Absent that kind of shock, I see little technical or on-chain justification for revisiting those lower levels.
This Time Feels Different, But It Never Is
Watch the video walkthrough on YouTube
Continue reading with OCM Premium
You have been reading the free preview of this article. The rest of it (about 350 more words) is for OCM Premium members. See OCM Premium plans.