

Every backtest ever published is sold on the same number, the one at the very end.
But that number is not what you live through. What you live through is the drawdown, the 18 months of chop, and the quiet decision to sell at exactly the wrong moment.
The fourth model now live in the Strategy Lab was not built to win the returns column. It was built so that you are still holding when the returns finally arrive.
Let’s get into it.
Key insights
Rails That Breathe: ATR-scaled bands widen in volatility and tighten in calm, so the model adapts instead of guessing.
Commitment Over Reaction: The regime holds until price closes through the opposing rail, and that is what kills the whipsaw.
The Edge Is Defensive: It gives up ground in bull markets, then more than repays every point of it when things break.
Proof In Real Time: Bitcoin is down 45% over the past 12 months. The model is down under 6%.
How The Model Works
We have just added our fourth model to the Strategy Lab, and this one is built with the conservative investor in mind. It runs on the Adaptive Trend, the regime engine lifted straight out of the Trading Envelope Dashboard. This is how it is constructed:
It starts with a fast DEMA baseline
It runs a rolling median filter across it, so a single violent bar cannot drag the whole trend line off course.
Then it wraps that baseline in two rails scaled by the Average True Range concept
That last step is the adaptive part, and it matters more than anything else in the model.
When volatility expands, the rails push outward and ordinary noise can no longer reach them. When the market goes quiet, they draw in tight and the model responds far sooner. You are not applying a fixed percentage band to an asset that changes character every quarter.
The rails are also deliberately asymmetric. Committing to a bull regime demands a close 2.1 ATR above the baseline. Committing to a bear needs only 1.5 ATR below it.
In plain English: it is slow to believe in an uptrend and quick to step aside from one.
And once a regime commits, it holds. Price must close through the opposite rail before anything changes. The chart plots the distance from price to that flip level in ATR units, so a zero crossing is not a signal derived from the regime. It is the regime flip itself.
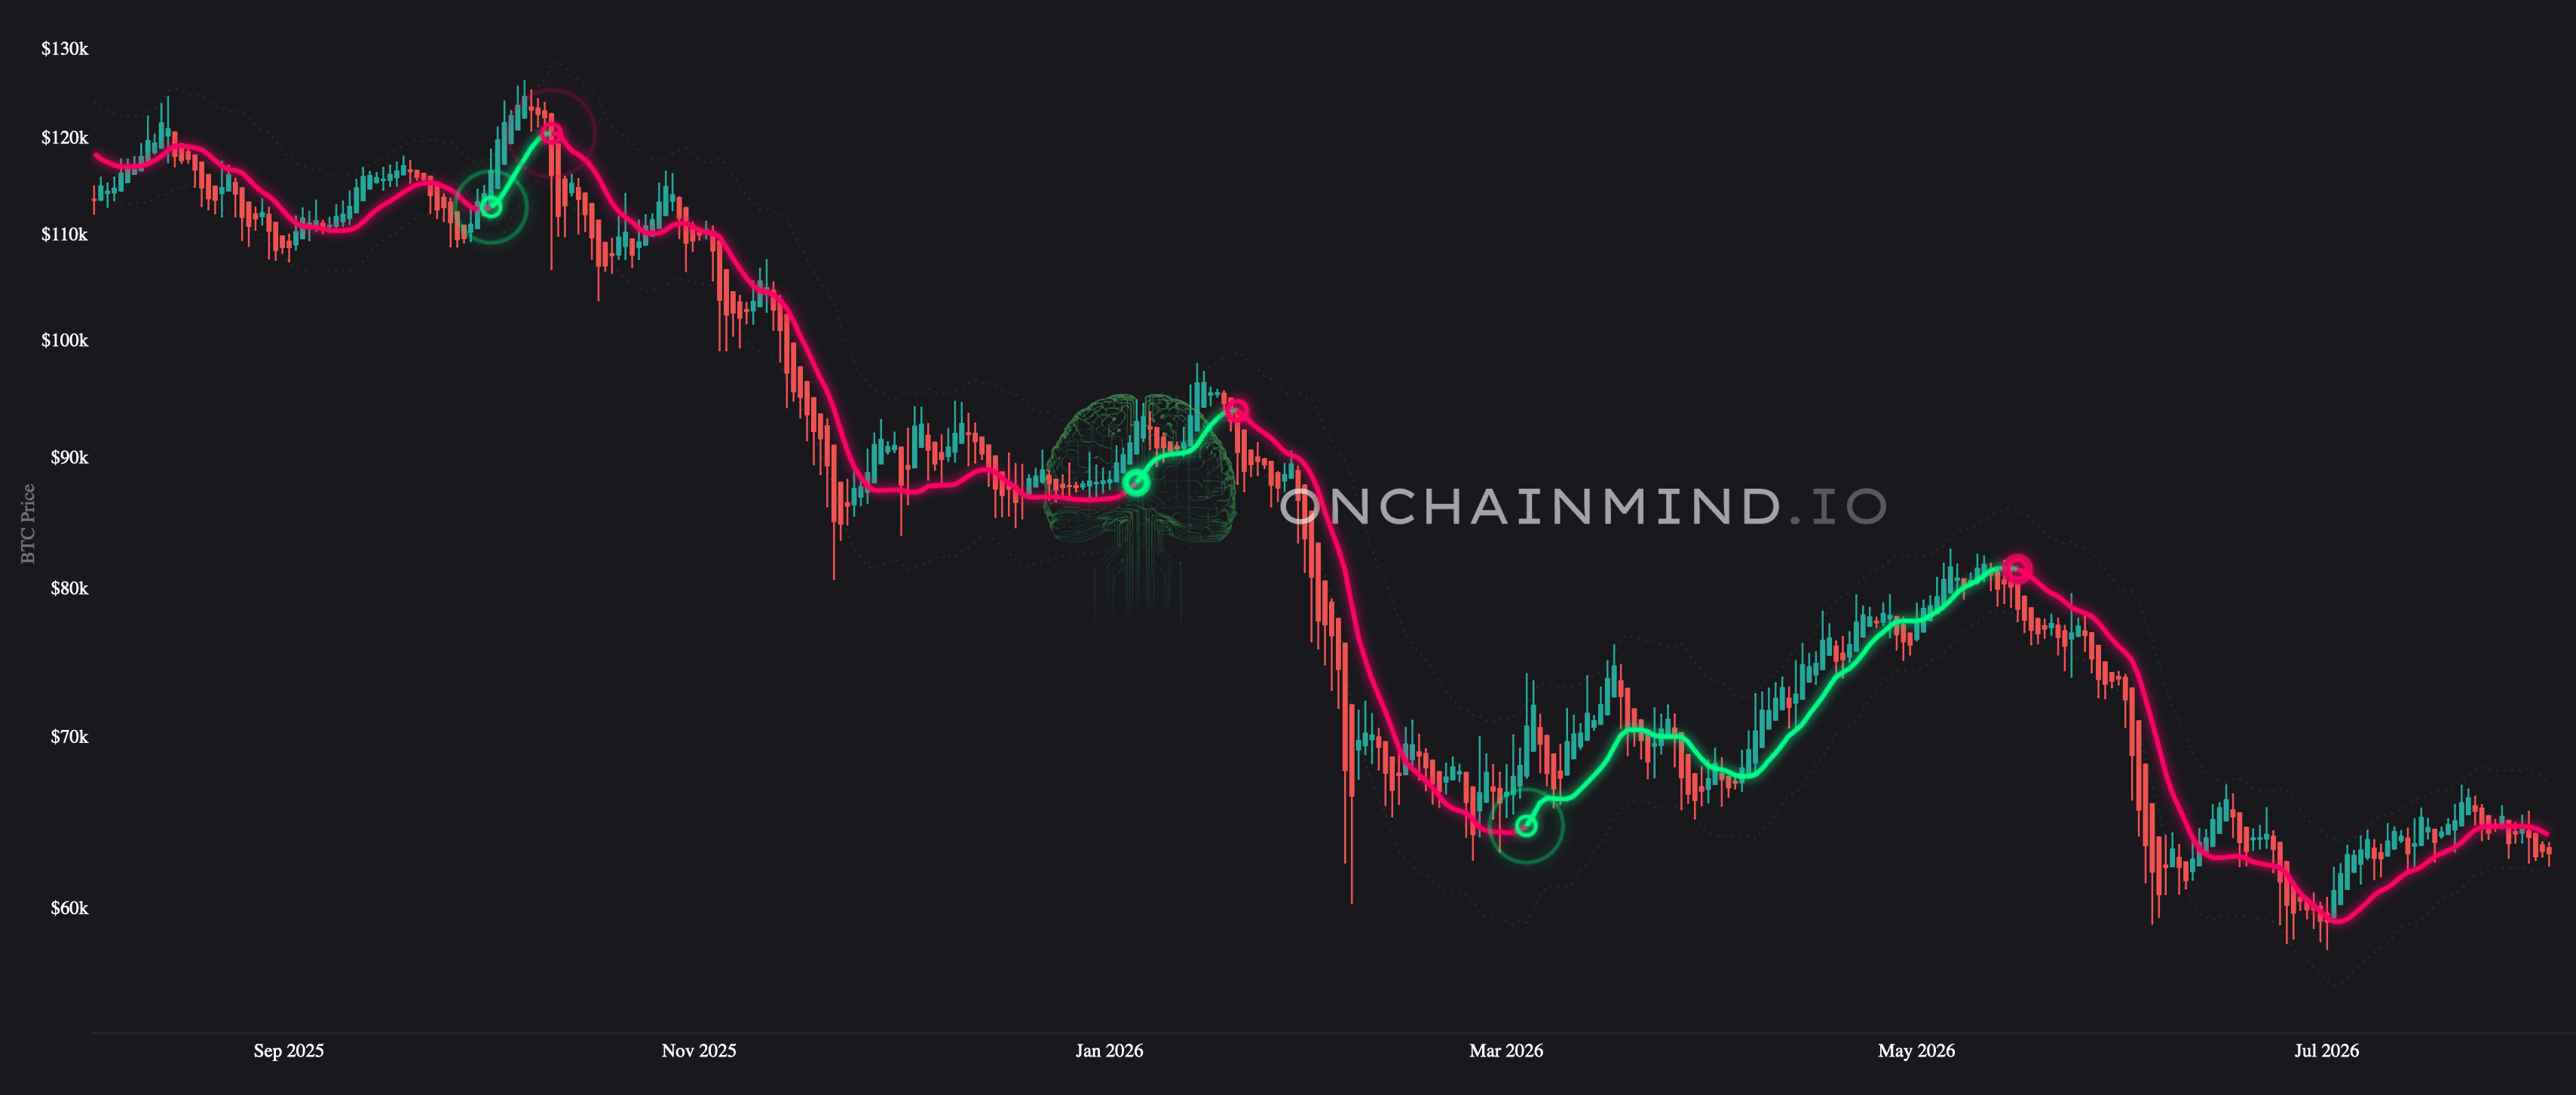
View live in OCM Studio: Adaptive Trend Model (1Y view)
From there the rule is trivial. It buys on the bull signal, sells on the bear signal, and does nothing in between.
It reads the regime as a state, not a crossing. Which sounds like semantics, but it’s not. A crossing rule starting mid-downtrend sits fully invested until the next flip, which is pain you never agreed to.
I set the start to 10th December 2017, days before the top, so DCA gets the kindest possible fight. If it cannot beat DCA from there, it has not beaten DCA at all.
What The Numbers Say
From a $10,000 portfolio start point, here is where everything finishes:
Adaptive Trend: ~$111,000
Buy and hold: ~$40,000
DCA: ~$40,000
Gold: ~$32,000
S&P 500: ~$28,000
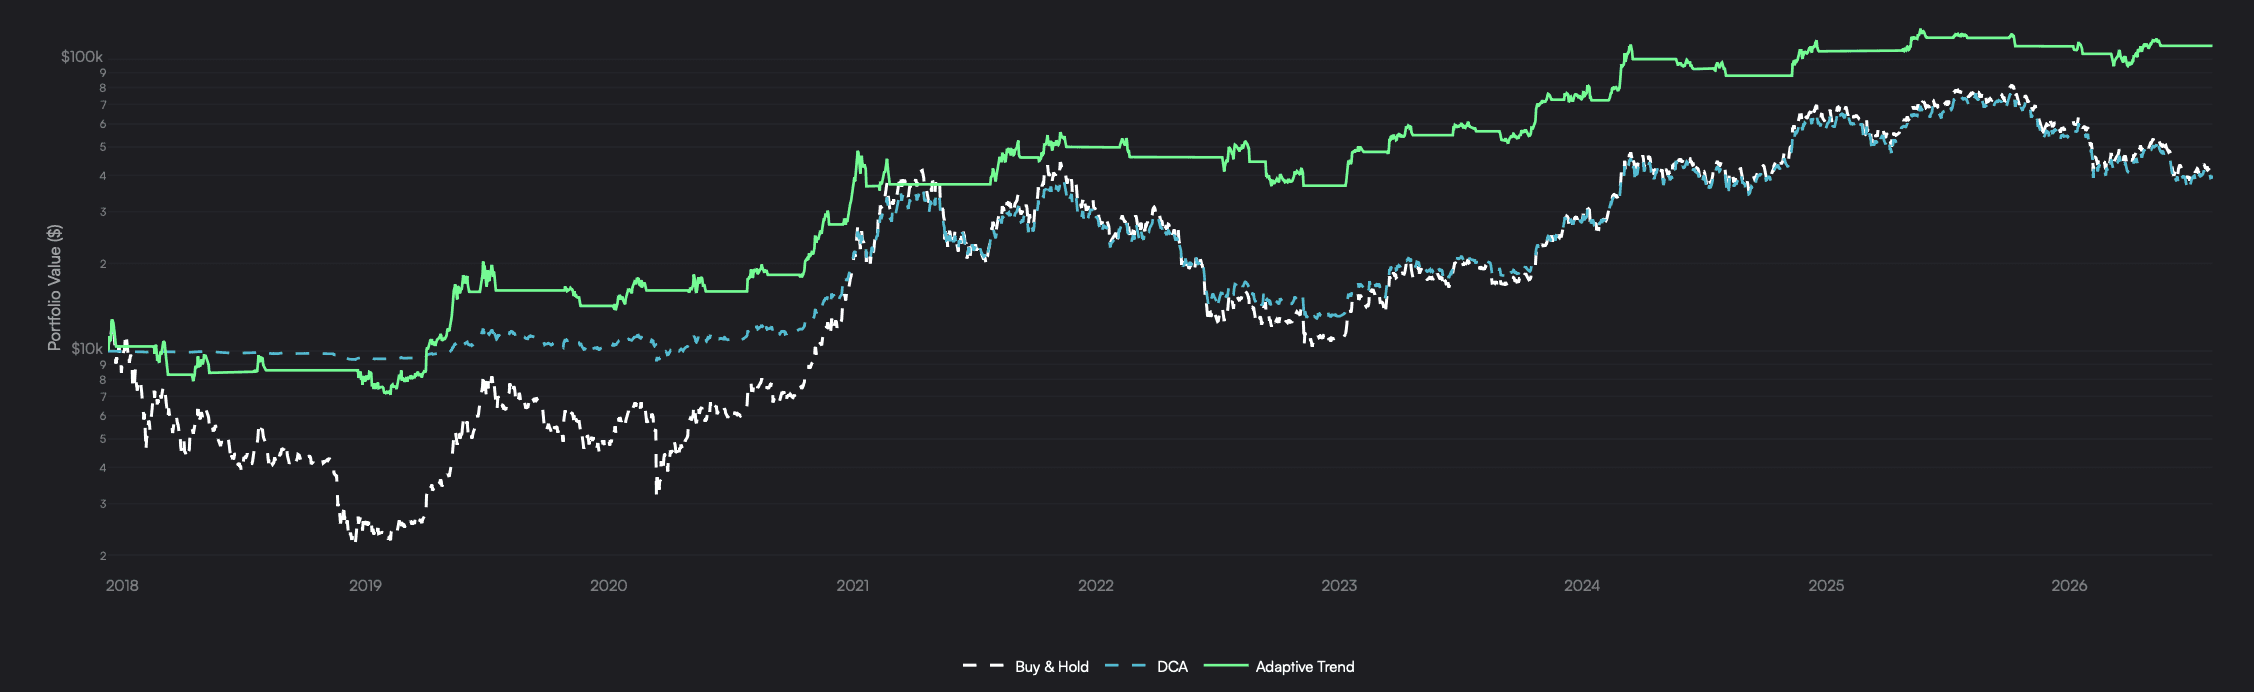
View live in OCM Studio: Strategy Performance Overview
In headline total return terms that is 1,011% against DCA’s 290%, or 32.1% compound annual growth against 17.5%. Now split it by regime, because this is where it gets interesting.
In bull markets, the Adaptive Trend compounds at 26.8% while DCA compounds at 33.5%.
The model loses to a passive accumulation plan when the trend is up. That is not a flaw to be apologised for, it is the cost of the insurance. Waiting for 2.1 ATR of proof means you are never first through the door.
In bear markets the picture inverts completely. The model returns 44.3% annualised while DCA bleeds -11.5%.
That is the model doing two things at once. It steps aside when the trend is wholeheartedly down and the pain is real, then re-commits quickly enough to catch the bear market rallies that always arrive.
Those vicious counter-trend bounces are what suck passive holders back in before rolling over on them. The Adaptive Trend simply flips back on, takes what the rally gives it, and steps aside again the moment the lower rail breaks.
The risk numbers tell the same story:
Worst drawdown: 44.7%, against DCA’s 67.2% and buy and hold’s brutal 83.2%
Calmar: 0.72 against DCA’s 0.25
Sharpe: 0.94against DCA’s 0.59
Sortino: 1.48against DCA’s 0.87
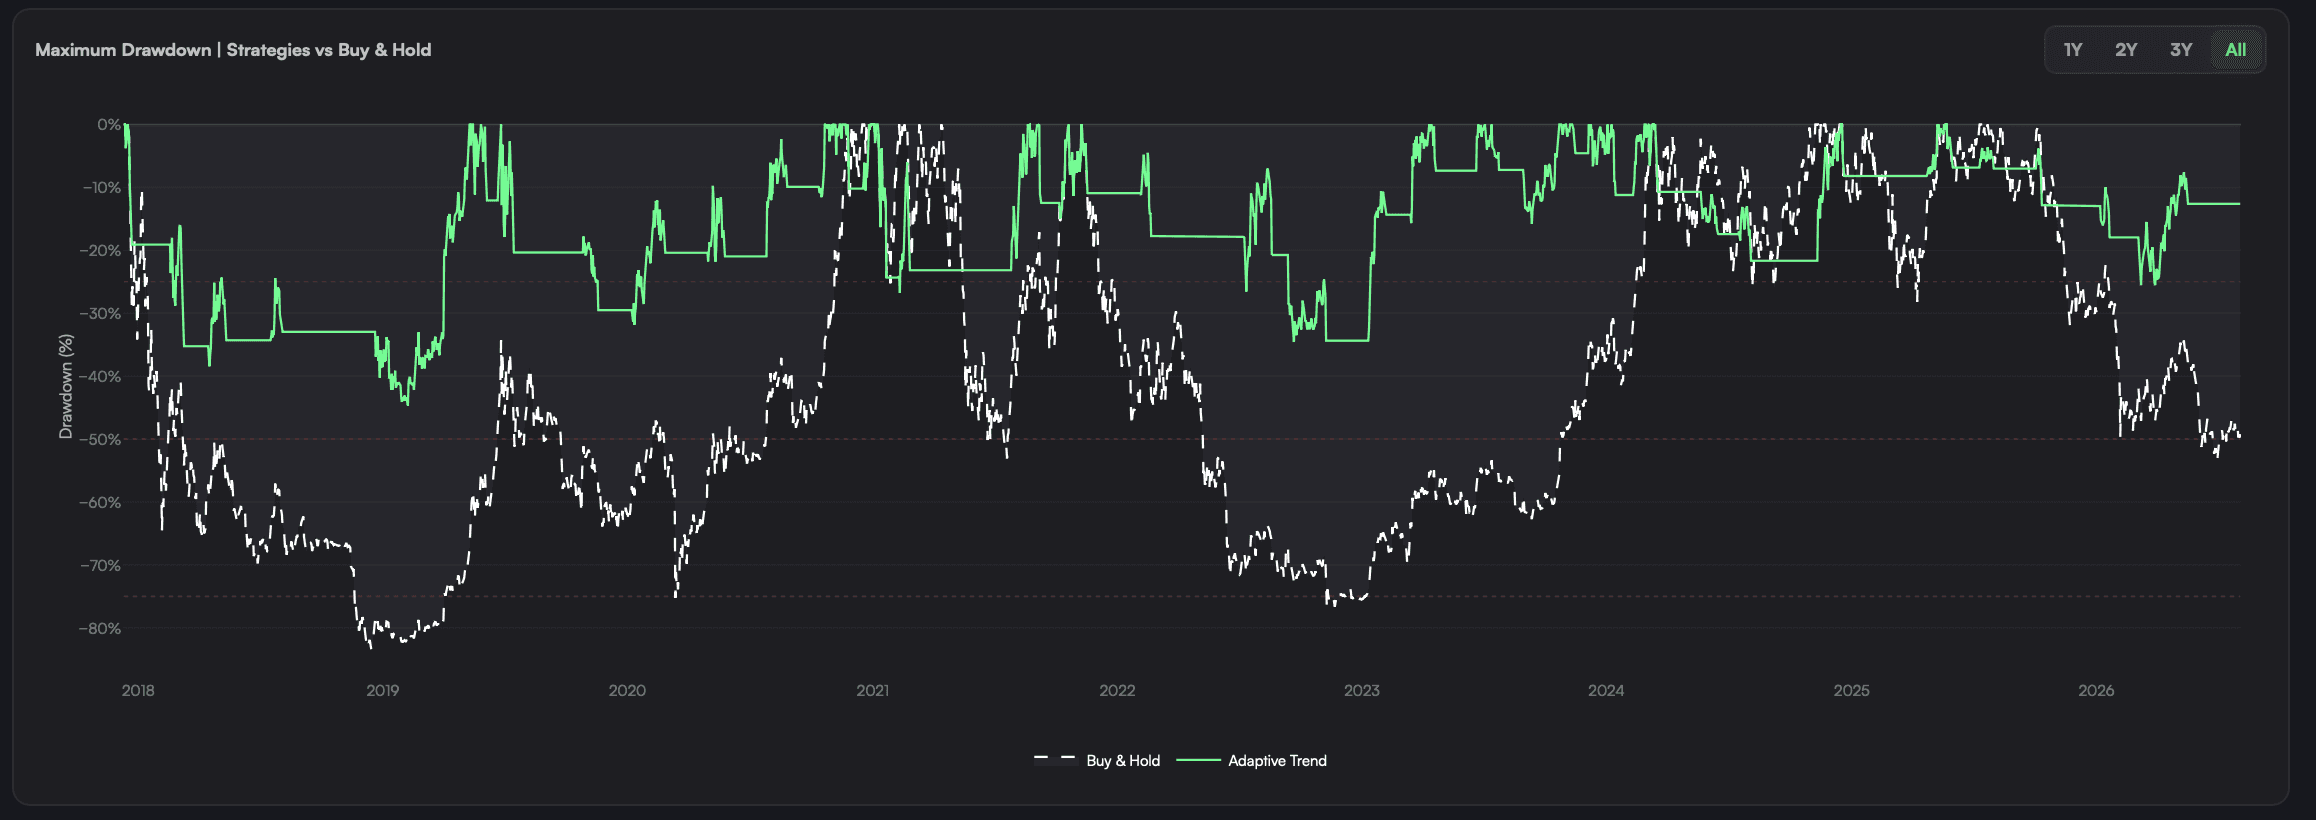
Maximum drawdown comparison. Strategy in green, buy and hold in white
View live in OCM Studio: Max Drawdown Comparison
What This Past Year Actually Looked Like
Everything above is history. Here is the model working in real time, through the worst conditions we have had since 2022.
Over the past 12 months, Bitcoin has lost 45% in dollar value. Meaning a $100,000 portfolio held through it is worth just $55,000 today. That is the honest, unvarnished cost of holding through a bear market.
Over those same 12 months, the Adaptive Trend has given up less than 6%. The same $100,000 is worth roughly $94,000.
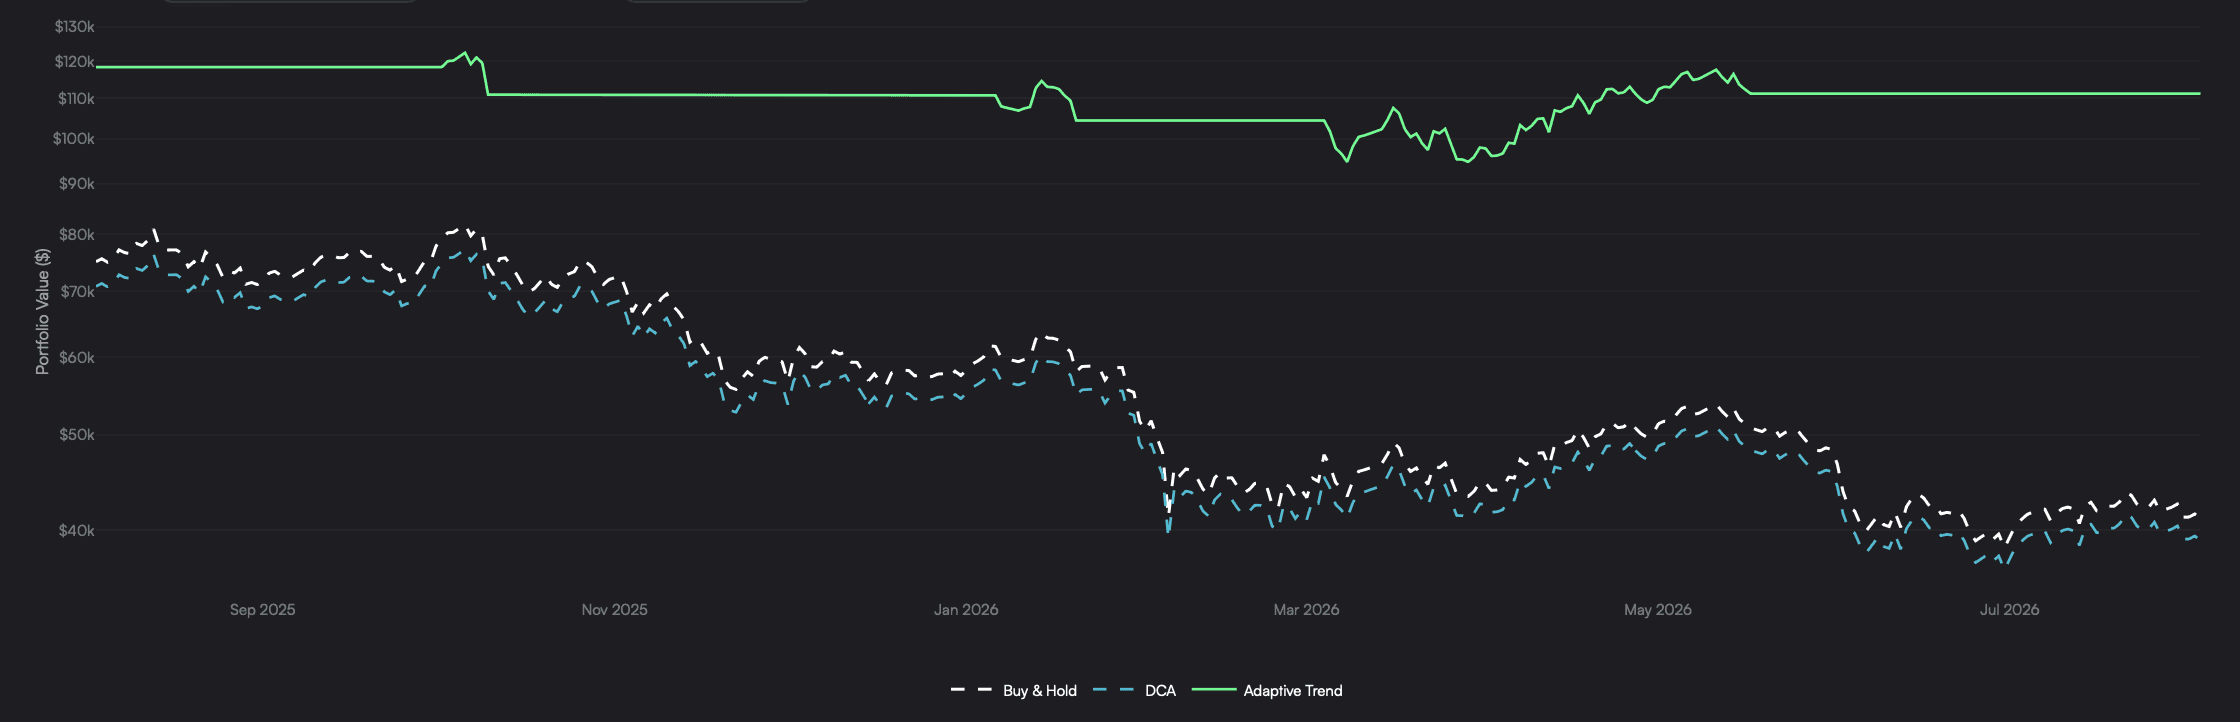
View live in OCM Studio: This Bear Market Performance
Sit with that gap for a second, because of how it was earned.
The model did not call the top. It never tries to. It holds no opinion on whether any given high is the high, and it does not care what cycle theory says or how many days we are into the drawdown. It simply waited for price to close through the lower rail, flipped to cash, and stayed there until price earns its way back through the upper one.
That is the entire trick. No forecast, no top-calling, no heroics.
The arithmetic does the rest, brutally in your favour. The buy and hold portfolio now needs 82% just to get back to where it started. The Adaptive Trend portfolio needs 6.3%.
One of those is a large portion of a cycle. The other is a single bear market rally.
And rallies are the one thing a bear market reliably hands you. The last one the Adaptive Trend caught added 18% to the portfolio value before it flipped back to cash at $78,100.
The recovery it needs is smaller than the bounce it has already banked.
How I Personally Use This
Let me tell you how I actually use this one.
Continue reading with OCM Premium
You have been reading the free preview of this article. The full analysis continues with 1 more sections, charts and takeaways. Read the full article or see OCM Premium plans.