
It is very easy to fall in love with your own model. I have been running the Ω-Score for years and I trust it completely, which is exactly the problem.
Conviction is how people end up married to ideas that quietly stopped working.
Of the thousands of tools I have built, the Strategy Lab is the one I am proudest of, and the one most likely to embarrass me. A proper backtest cannot be fudged. So I pointed it at my flagship Ω-Score, fed it the full history, and tried my hardest to break it.
Here is what survived.
Let’s get into it.
Key insights
Backtests Can Lie: A rising equity curve means little unless it survives costs, delays, and bad luck.
Survival Beats Size: The Ω-Score beat buy-and-hold by 280,000% while cutting drawdown, proving more return and less pain can coexist.
Stress-Tested To Destruction: Across 5,000 shuffled timelines the strategy stayed profitable every time, and still won after missing tops and paying full costs.
Anchor To Risk, Not Price: With the score at 11%, waiting for a tidy round-number entry risks missing the whole move. Think in risk, not round numbers.
Surviving the Real World
Someone shows you a chart. It starts in the bottom-left, ends in the top-right, and the implication is obvious: this strategy works. But that is not enough.
A proper strategy needs to survive the real world. It needs to survive trading costs, slippage, delayed execution, bad luck, and the fact that you will not always catch the exact bottom or exact top.
That is what makes Bitcoin strategy testing so difficult. Bitcoin is already one of the greatest buy-and-hold assets in financial history, so any strategy has to clear a brutally high bar. It cannot just make money. It has to outperform one of the strongest passive trades ever made, while reducing the emotional and financial pain along the way.
The Strategy Lab was built to test precisely that. Not just “did this work in hindsight?”, but:
“Did this work under pressure?”
“Did it reduce drawdown?”
“Did it survive worse execution?”
“Did it still work when the settings were not perfect?”
Our Bitcoin Ω-Score Strategy
Before we test anything, you need to know what is being tested. The Bitcoin Ω-Score is the flagship model I have run for years, and it does one job exceptionally well: it takes over a dozen of Bitcoin’s most proven valuation, on-chain and momentum indicators and synthesises them into a single, normalised risk score from 0 to 100%.
Instead of cross-referencing a dozen charts every morning, you get one number telling you where the market sits on the risk spectrum.
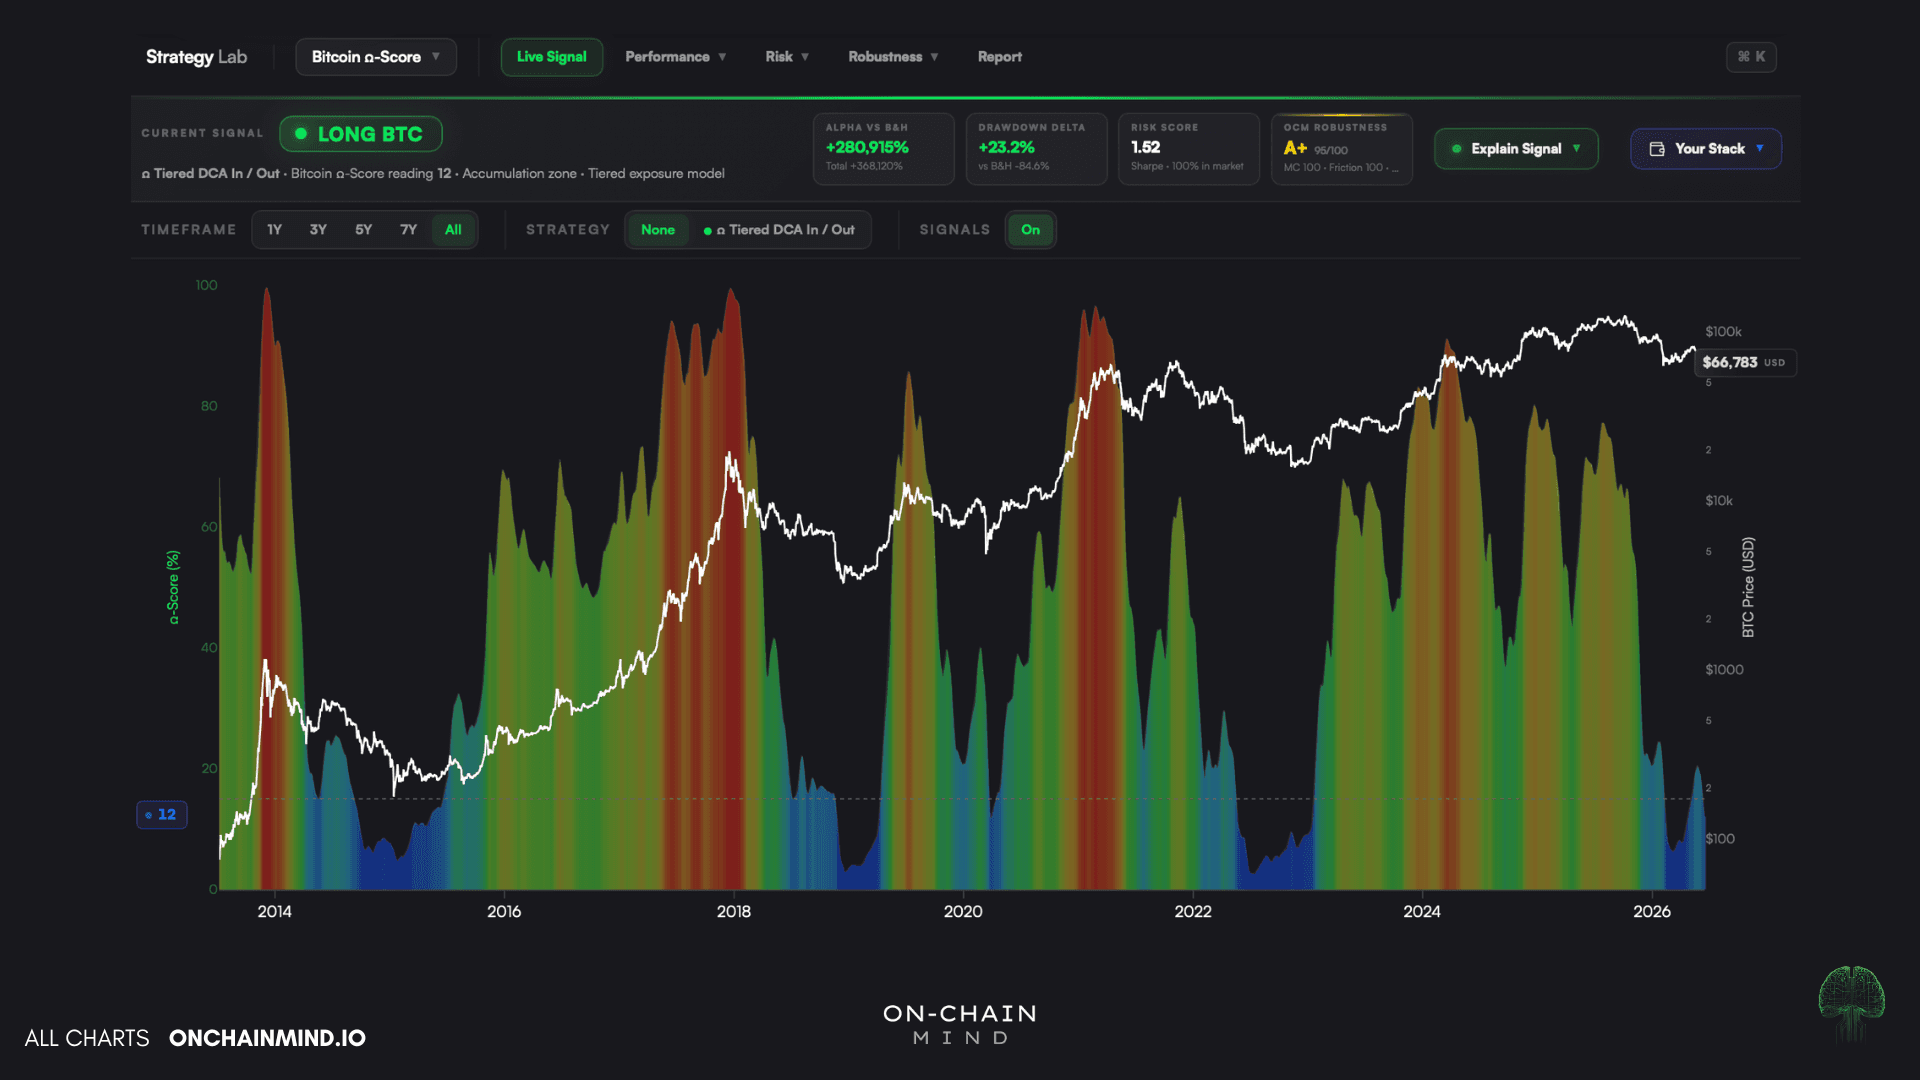
The strategy itself is intentionally plain. Scale into buys whenever the score drops below 15%, scale out whenever it climbs above 85%. A DCA in, DCA out approach, nothing more.
I set the starting pot at $10,000 and never added another dollar. Simple enough to run on autopilot, and, as you are about to see, surprisingly potent.
View live in OCM Studio: The Strategy Lab - Omega Strategy
Returns Are the Easy Part
In 13+ years, the strategy returned roughly 368,000%. Too large to mean much, so here is the honest translation: an 88% Compound Annual Growth Rate (CAGR).
Now, your inner sceptic should be stirring: “Bitcoin gave everyone one of history’s greatest buy-and-hold trades, so surely the start date did the work?”
Fair point. Except the strategy beat holding by around 280,000% while cutting the drawdown from highs by 23%. Holding returned 87,000% but made you swallow multiple 80%+ collapses.
Naive weekly DCA managed 6,000%. The Ω-Score pot finished 4.2x larger than holding and 61x larger than weekly DCA, with a much improved drawdown profile. More return, less pain.

View live in OCM Studio: Raw Returns
This is where most analysis unfortunately stops and mine refuses to, because a headline number says nothing about what it felt like to hold.
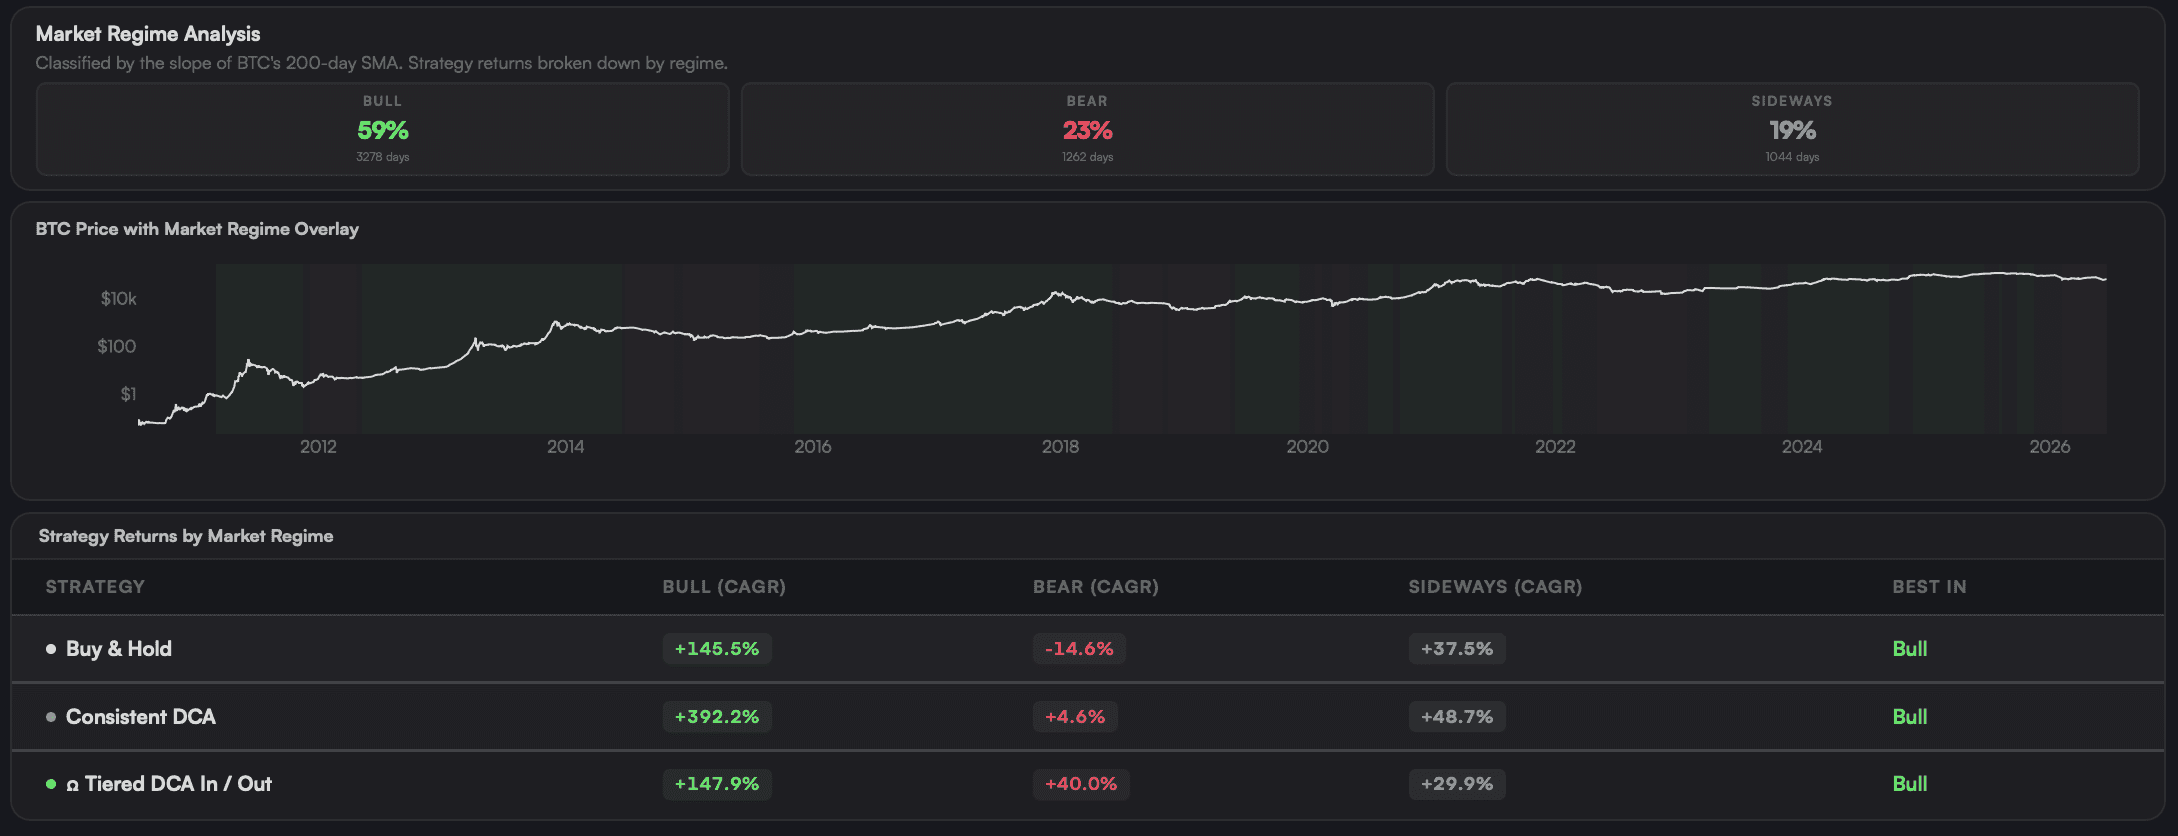
The Calmar ratio, which is a TradFi classic of CAGR divided by maximum drawdown, hit 1.44, and anything above 1 is pretty rare air. The more famous Sharpe and Sortino ratios were strong too. Check them out.

But the sharpest line lands when you split by regime: holding Bitcoin through a bear bled 14% a year, while the Ω-Score flipped that into a positive 40% a year.
View live in OCM Studio: Regime Analysis
Stress-Testing a Strategy to Destruction
Feeling sceptical? Good, because a backtest can be a beautiful lie. So I went looking to break this one on purpose.
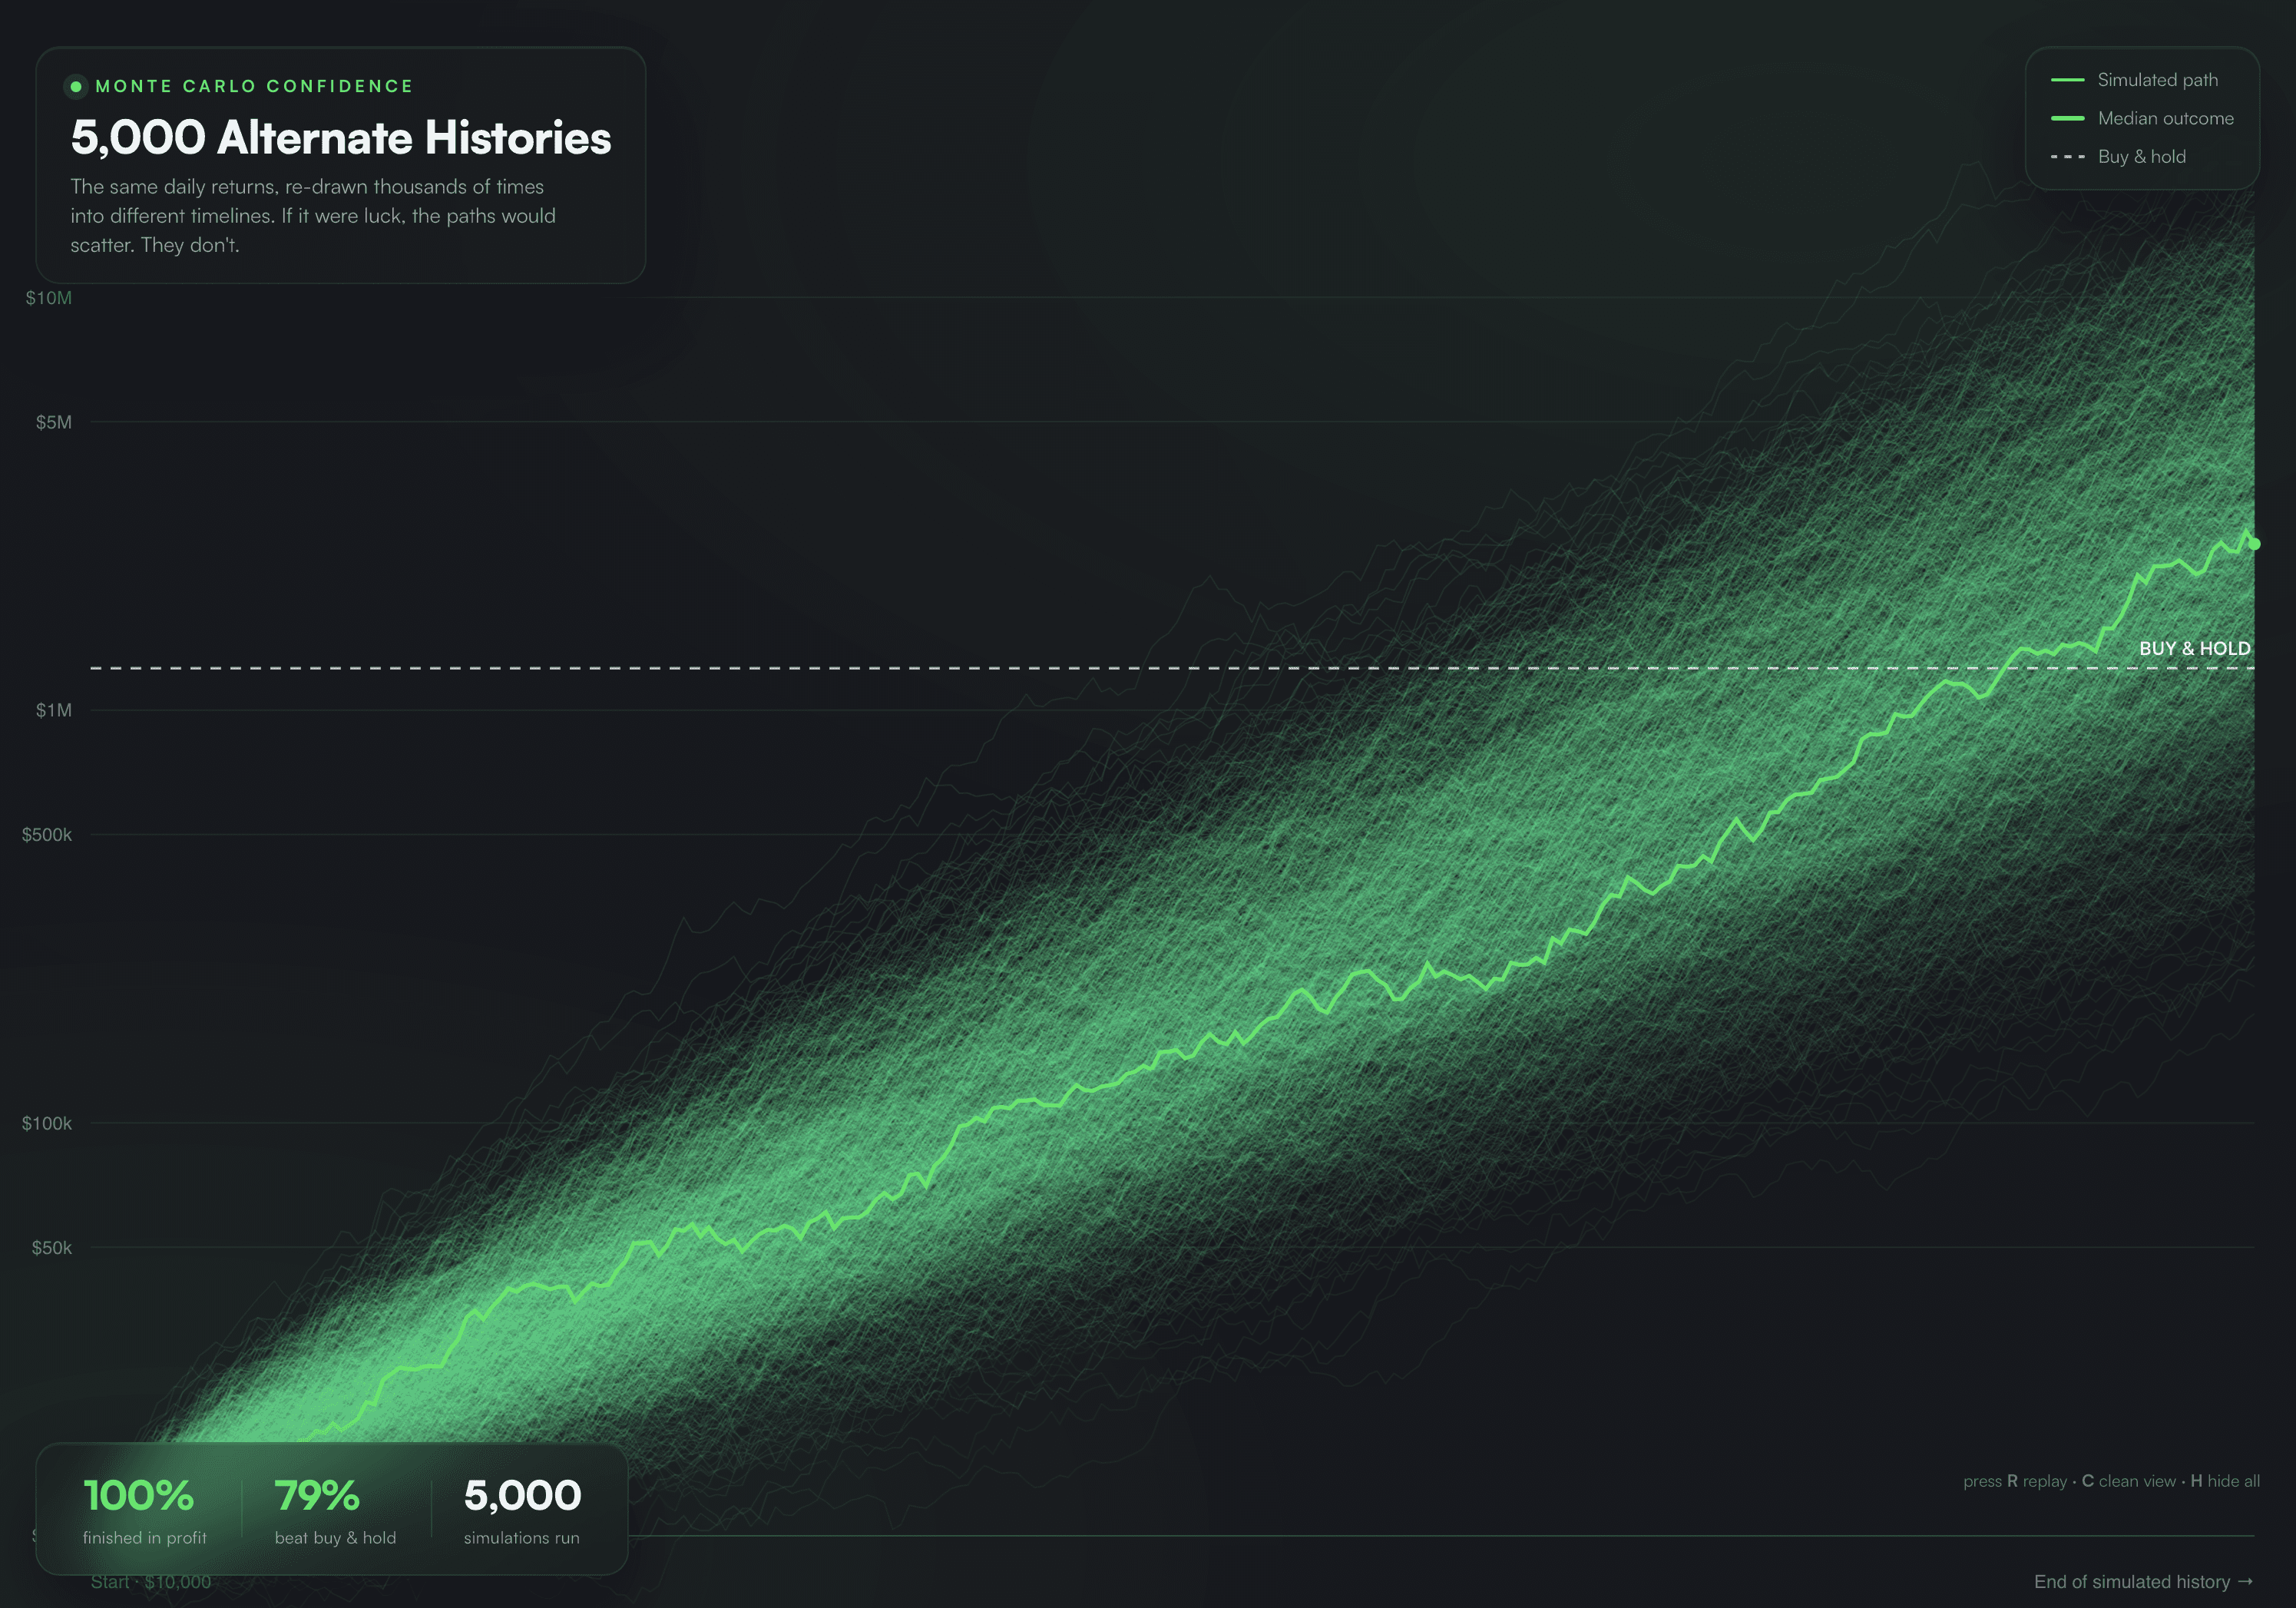
First, a Monte Carlo confidence analysis. I took the strategy’s daily returns and shuffled them 5,000 times into thousands of alternate histories.
The logic is simple:
If the edge is real, it survives being reshuffled into timelines that never happened.
If we just got lucky on one path, the shuffle drags that luck into the light.
The result was about as clean as it gets. In 100% of simulations the strategy finished in profit, and in 79% it beat holding outright.
View live in OCM Studio: Monte Carlo Simulation
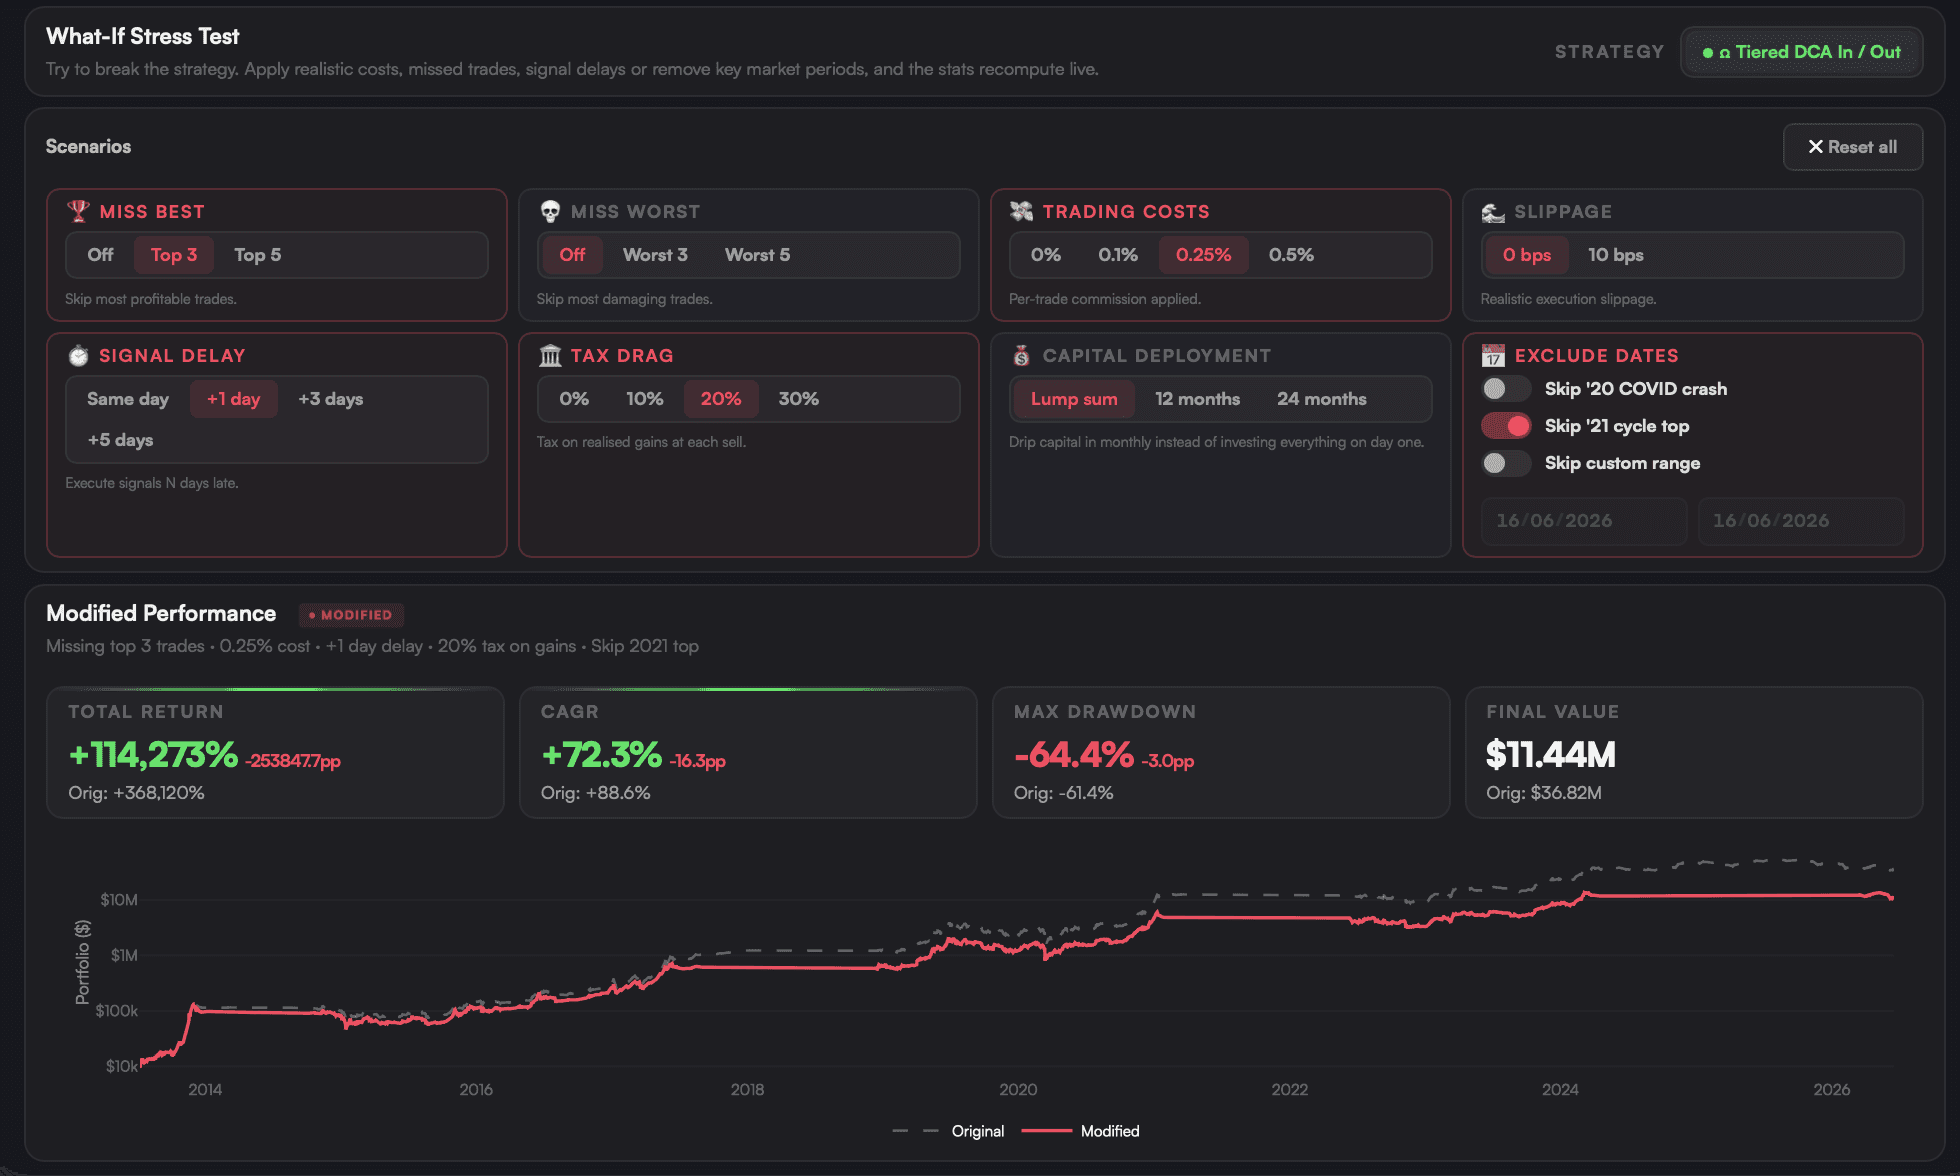
Second, overfitting, the curse of a model that only works on one magic setting and shatters the moment reality drifts. So I piled on the abuse:
Miss the best days
Steepen the trading costs
Increase the tax drags and slippage
Miss a few cycle tops entirely (as if you had wandered off at exactly the wrong fortnight)
It still held up.
The drawdown profile seals it. That deepest 61% fall came in the violent March 2020 Covid crash and recovered almost as fast as it arrived. Outside that one event, we rarely sat more than 35-40% below the highs, and the average recovery took just over 30 days.
It hurt less, and it hurt for less time.
View live in OCM Studio: What If Scenarios
Thinking in Risk, Not Round Numbers
Here is where it all becomes personal, because numbers are only useful if they change how you behave.
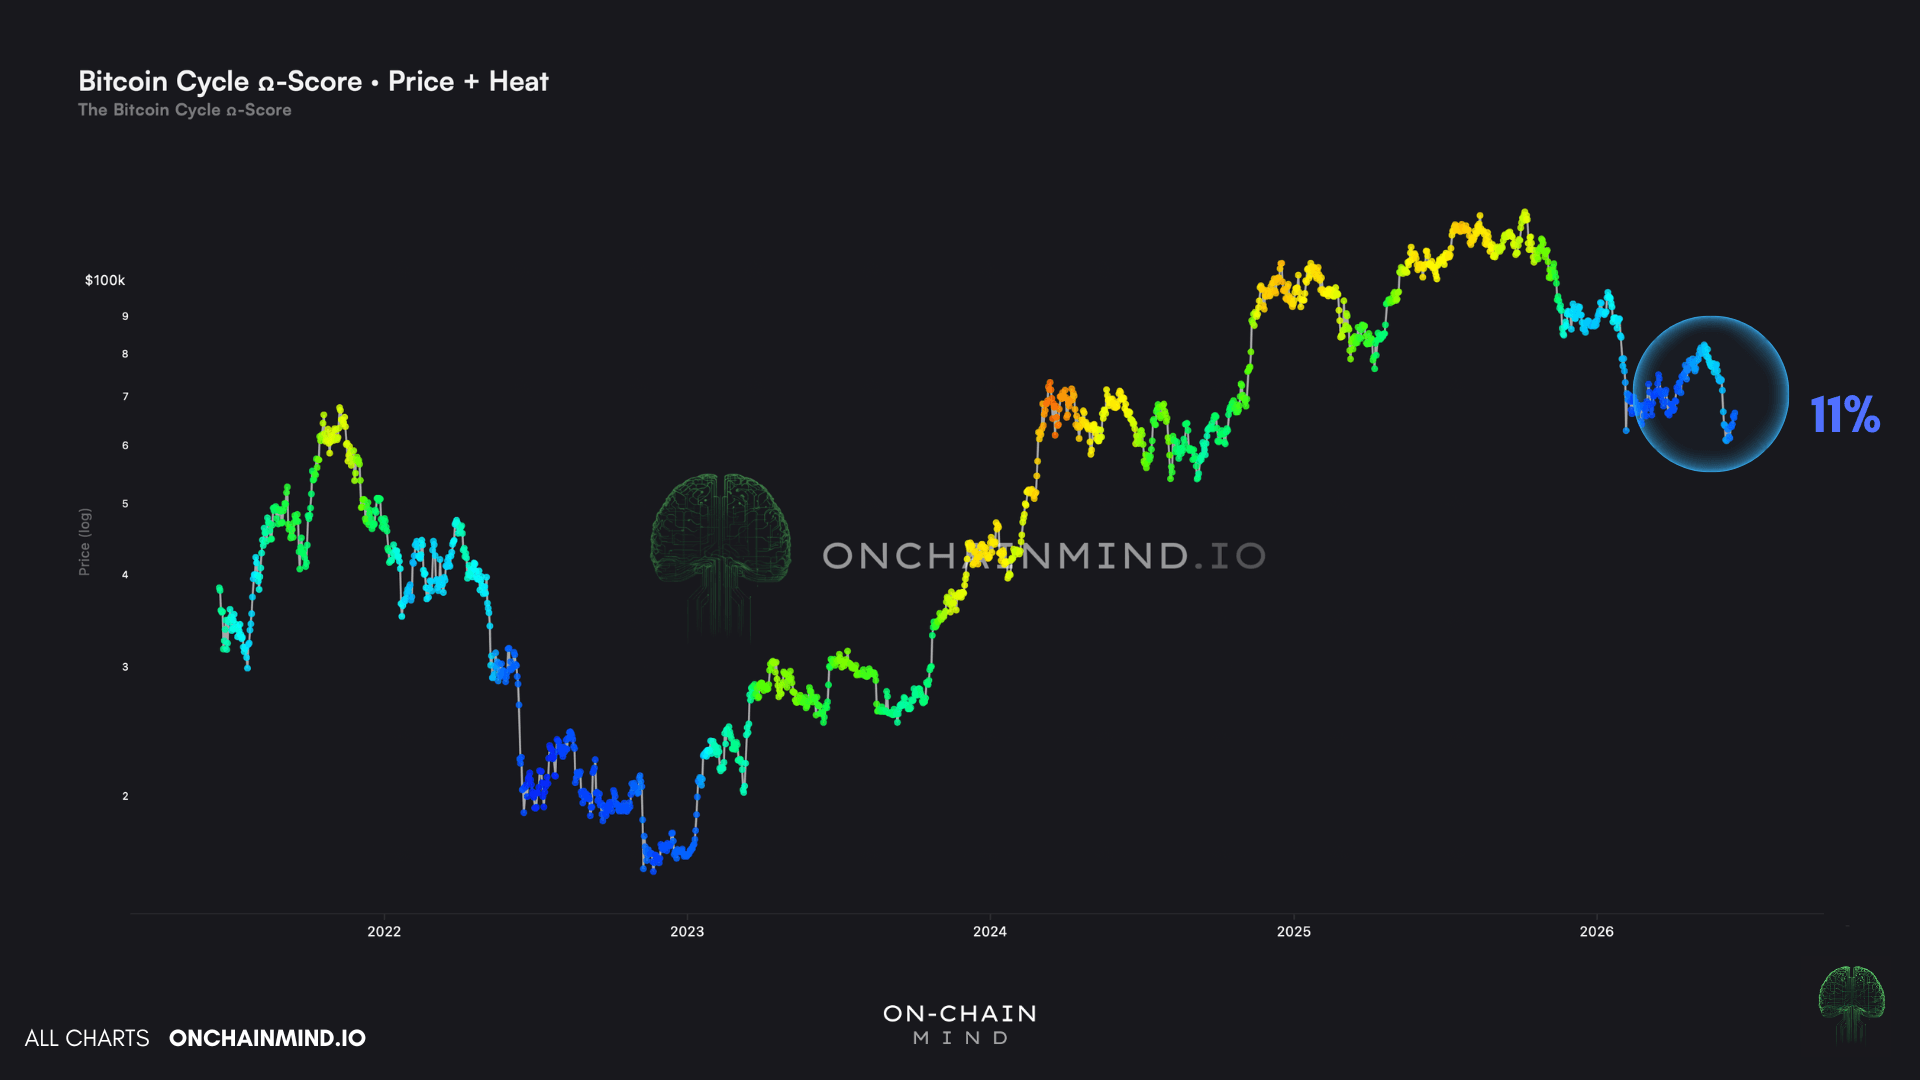
As I write this, the Ω-Score sits at 11%, down from around 24% just a month ago. Despite the recent mini-bounce, we are firmly in deep accumulation territory still.
View live in OCM Studio: The Bitcoin Ω-Score
Across the entire history, whenever the score has loitered near 11%, the 12-month median return has been a positive 66%, and the 24-month median a positive 320%. To me, that is a genuinely asymmetric risk-reward setup with a high historical win rate sitting behind it.
Personally, I play this market in two gears. I DCA steadily whenever the score sits below 50%, because this game is not only about catching the absolute floor of a bear; it is also about those tidy dips that turn up mid-bull, when everyone else has stopped paying attention.
Then, in bears, I ramp up hard below 20%, and I go properly aggressive below 10%, because that is where the most asymmetric opportunities in this entire market live.
And this is the mental shift I most want you to take away. Bitcoin is around $66k today, and half the internet is chanting the same line: “I will only buy at 40k”.
I understand the instinct completely. A lower number simply feels safer. But you are anchoring yourself to a price, and that is the trap.
The model puts today’s theoretical 0% risk level at roughly $41k, and across all of history the difference between buying at 0% risk and 10% risk is basically a rounding error.
Holding out for a magic round number, by contrast, carries a very real chance of missing the entire move.
So I do not sit there thinking in tidy round numbers. I think in risk. Anchor your mind to where the market actually sits on the risk spectrum, and let those levels, not your emotions, tell you when to dollar-cost-average in and when to ease back out.
Because in the end, the strategy was never the thing I was testing. It was whether I could trust myself to follow it. The model held up. The next part is still on me.