
Long-term holders are still fast asleep. Only the faintest stir of profit-taking, nowhere near enough to say they've woken up, because price hasn't risen far enough to tempt them into selling in size.
That's exactly what you want to see this early in a recovery. What's actually moving right now is coming from people who bought in the last 3 months, banking a small win, while loss realisation in Bitcoin terms has dropped to its lowest point since this bear market began.
That's the exact fingerprint of February 2023, the first real leg off the last bear market floor, and this time it's showing up against the strongest week of institutional demand in almost a year.
So here's what I want to walk you through: the supply picture running on empty, a profit ribbon framework I've never shown before, and the exact price where the bulls take unambiguous control.
Let's get into it.
Key insights
Best Week In Almost A Year: The ETF complex delivered a demand print not seen since before the bear market.
Selling Is Barely Registering: Realised profit in Bitcoin terms is subdued, and the cohort behind it is exactly the right one.
The 80% Threshold: A new profit ribbon framework pinpoints the level where rallies historically shift into full bull force.
The 2023 Echo: Everything visible here has a precedent, and it did not resolve the way most expected.
The Institutional Bid Has Returned
We covered the ETFs briefly on Tuesday, when the complex pulled in roughly a billion dollars in a single session as an immediate response to the price move. What's more impressive to see is that it didn't stop there. A single big day is often just a reflex, allocators chasing a green candle and nothing more. A full week of it is a decision.
The week has closed out at $2.25 billion of net inflows across the complex. To put that into perspective, the last time we saw a week better than this was the w/c 6th October last year, when $2.69 billion came through the door.
That was before the bear market started. This is the strongest weekly demand print in almost a year, and it lands after months in which the same vehicles were leaking supply back into the market rather than absorbing it.
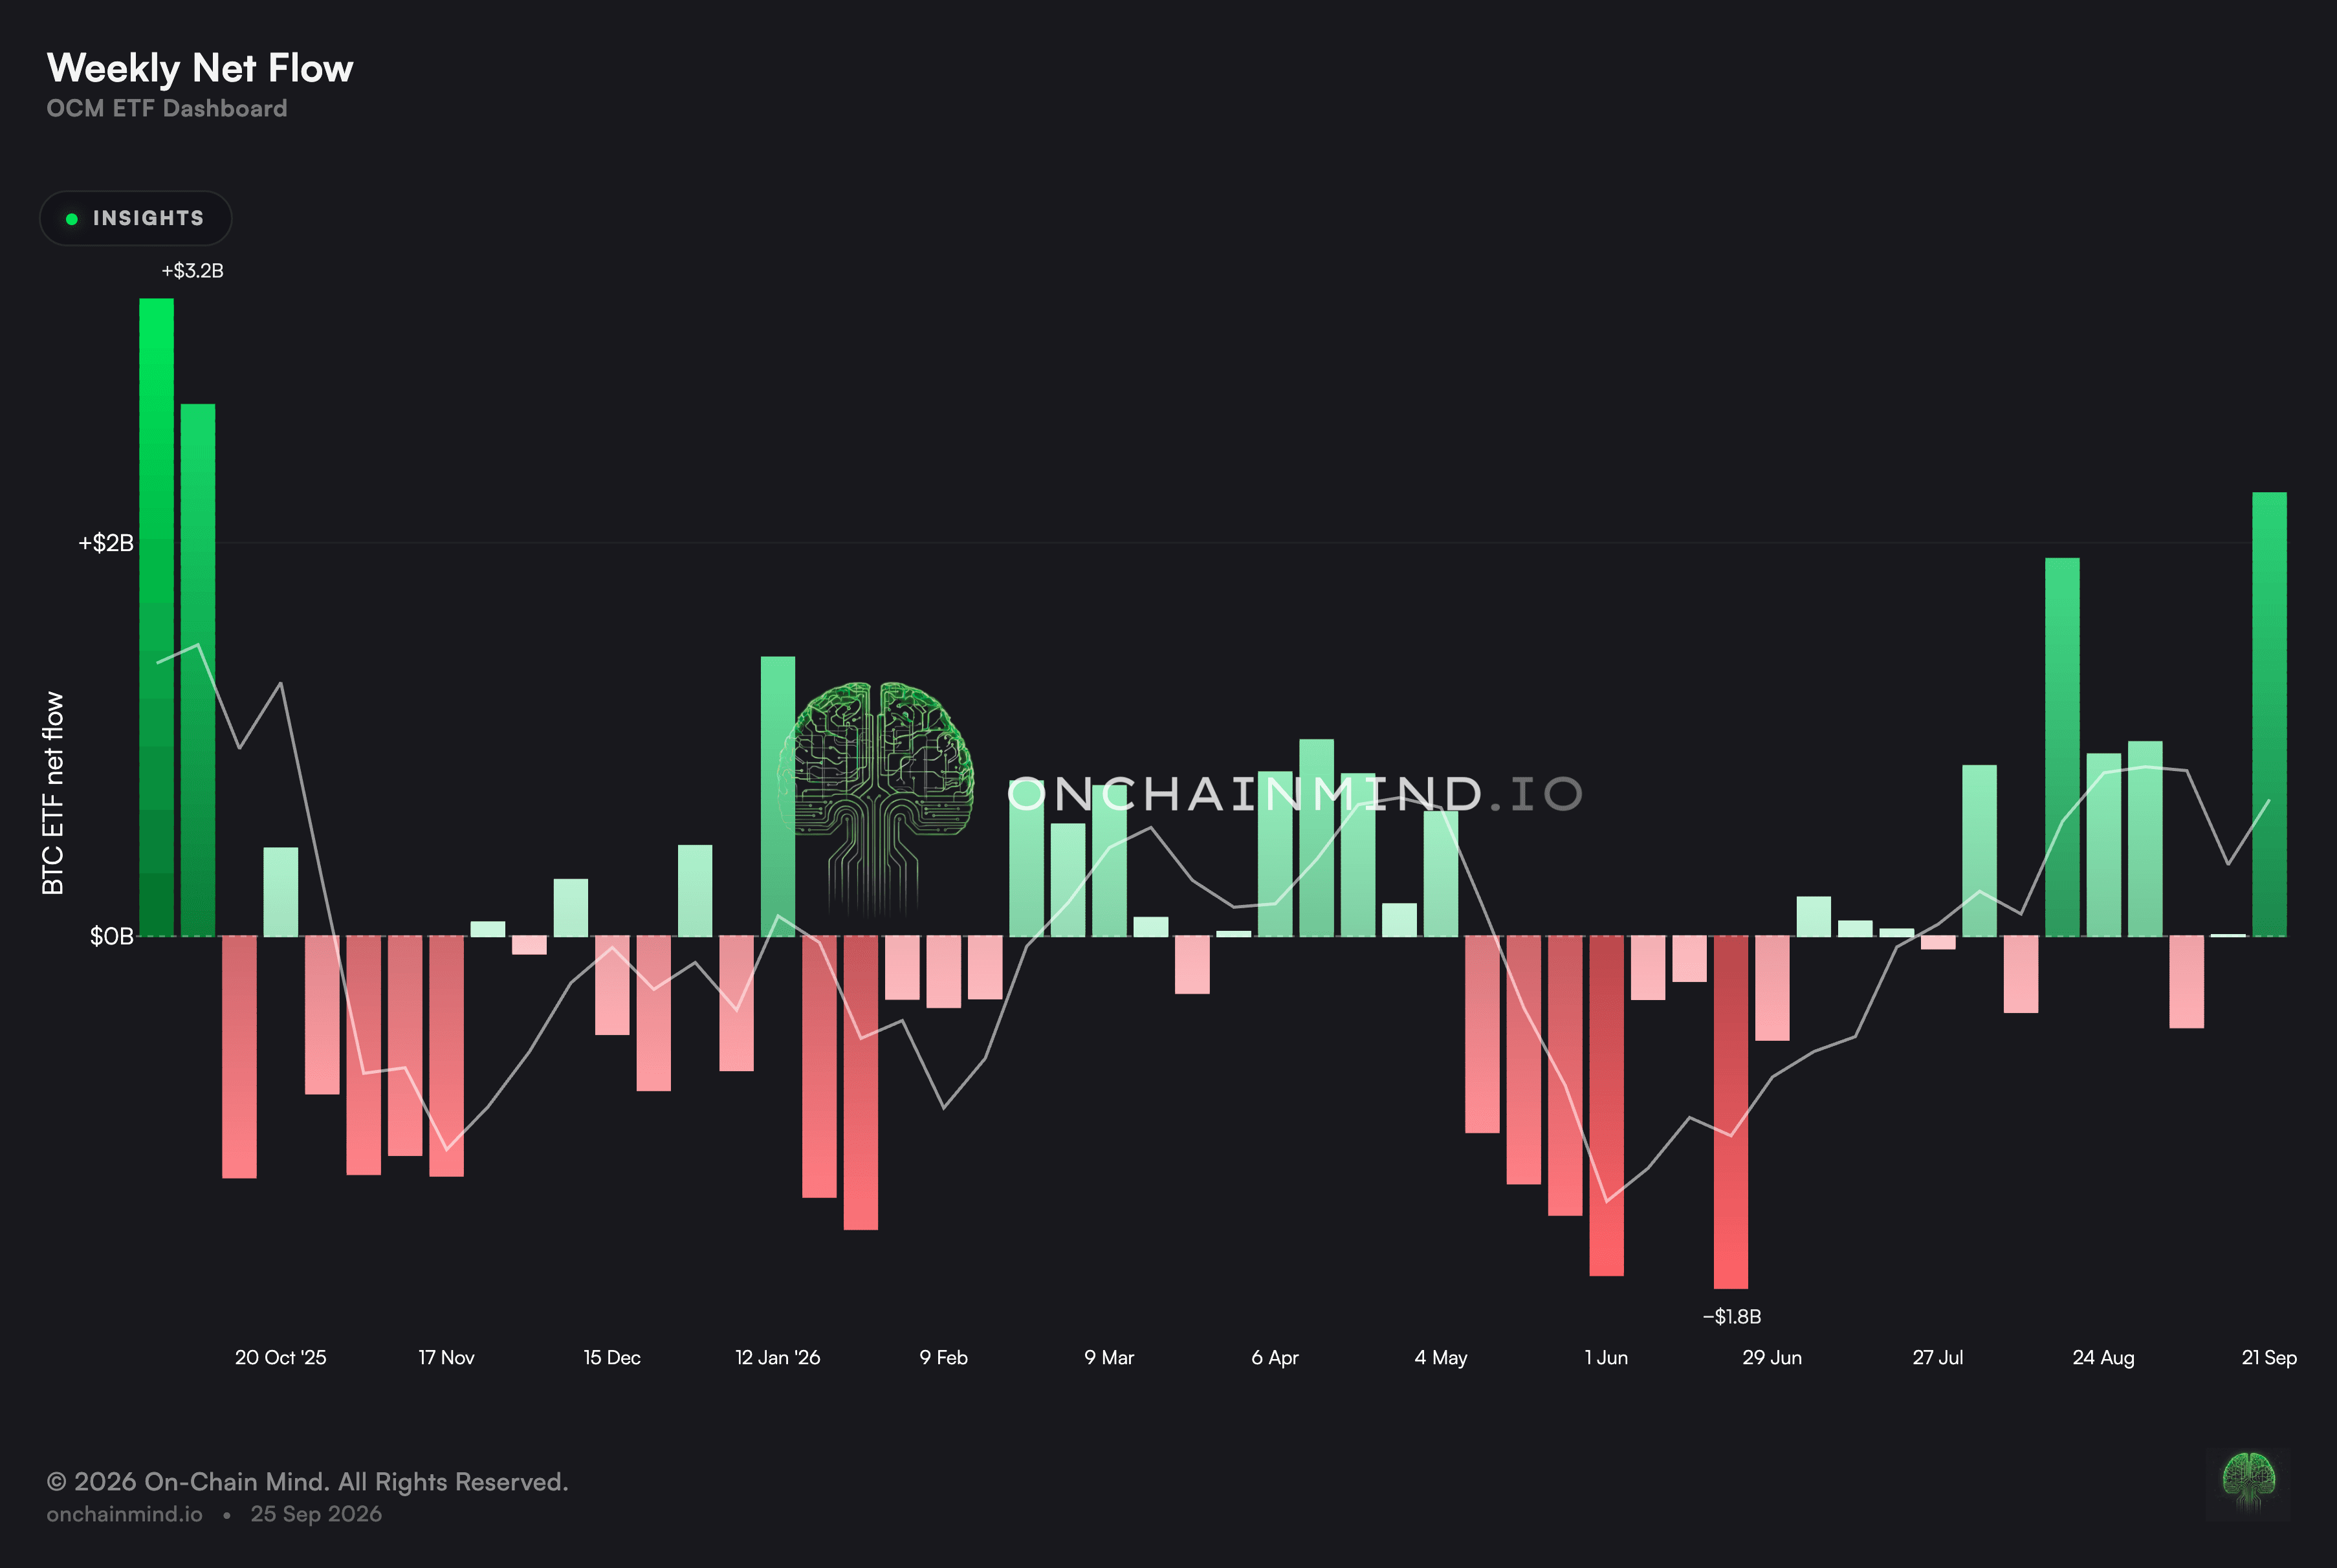
View live in OCM Studio: Weekly ETF Flows
But I want to hold the enthusiasm in check, before we all get too carried away. Month to date we are sitting at $2.6 billion, which is thoroughly middle of the pack. During the previous bull market there were months that cleared $6 billion in net inflows. We are nowhere near that pace.
So this is not euphoria. It is not the wall of money that characterised the vehicle at its peak. It is simply positive, sustained demand returning after a long absence, and at this stage of a recovery that is genuinely all you need.
We've not seen the start of a bull market in the post-ETF world yet. But from what we know about previous cycles, recoveries do not begin with utter mania. They begin with the marginal seller running out of coins and a steady bid quietly taking the other side. And our current ETF flow data is showing exactly that.
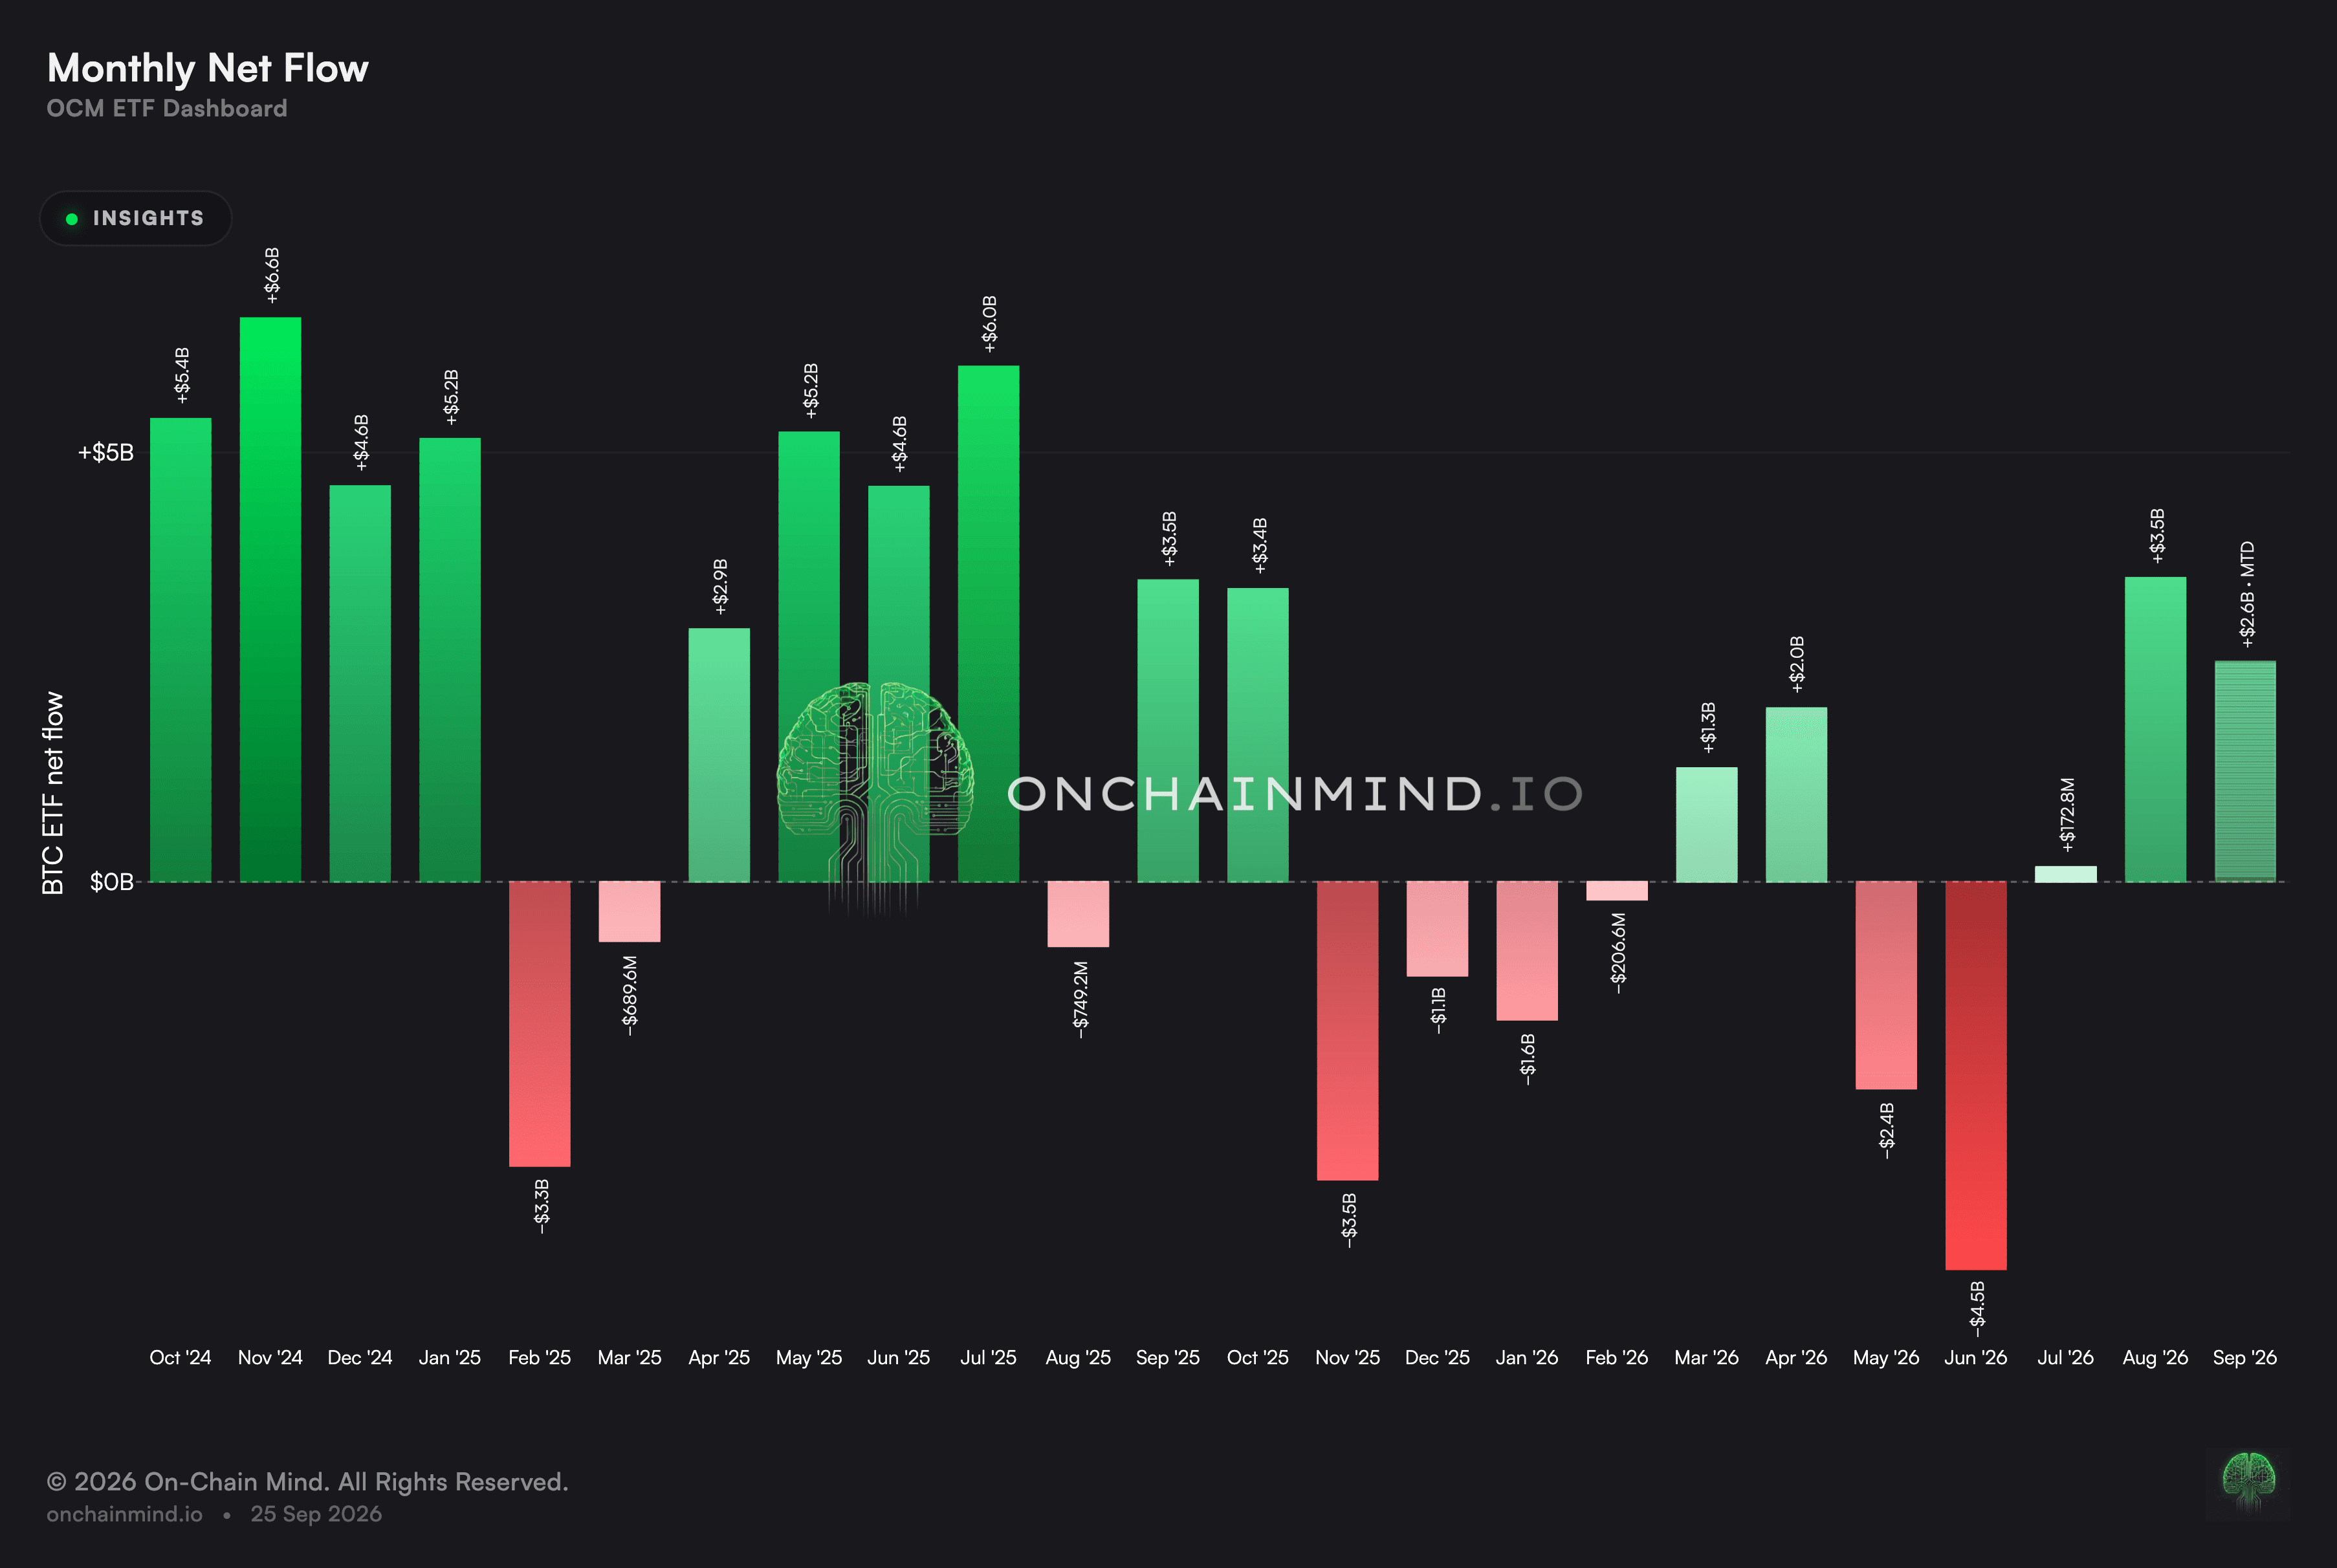
View live in OCM Studio: Monthly ETF Flows
The part of this complex I am watching most closely is the ETF cost basis, which is being tested as we speak at $84K.
That level is the aggregate average entry of everyone who has bought through these vehicles, and it functions as a psychological line for the single largest pool of new capital in this cycle.
Given how large a share of recent capital flowing into the network has come from this cohort, seeing that level hold as support rather than break is important. If the institutional buyer defends its own average entry, the floor beneath this move gets a lot more credible.
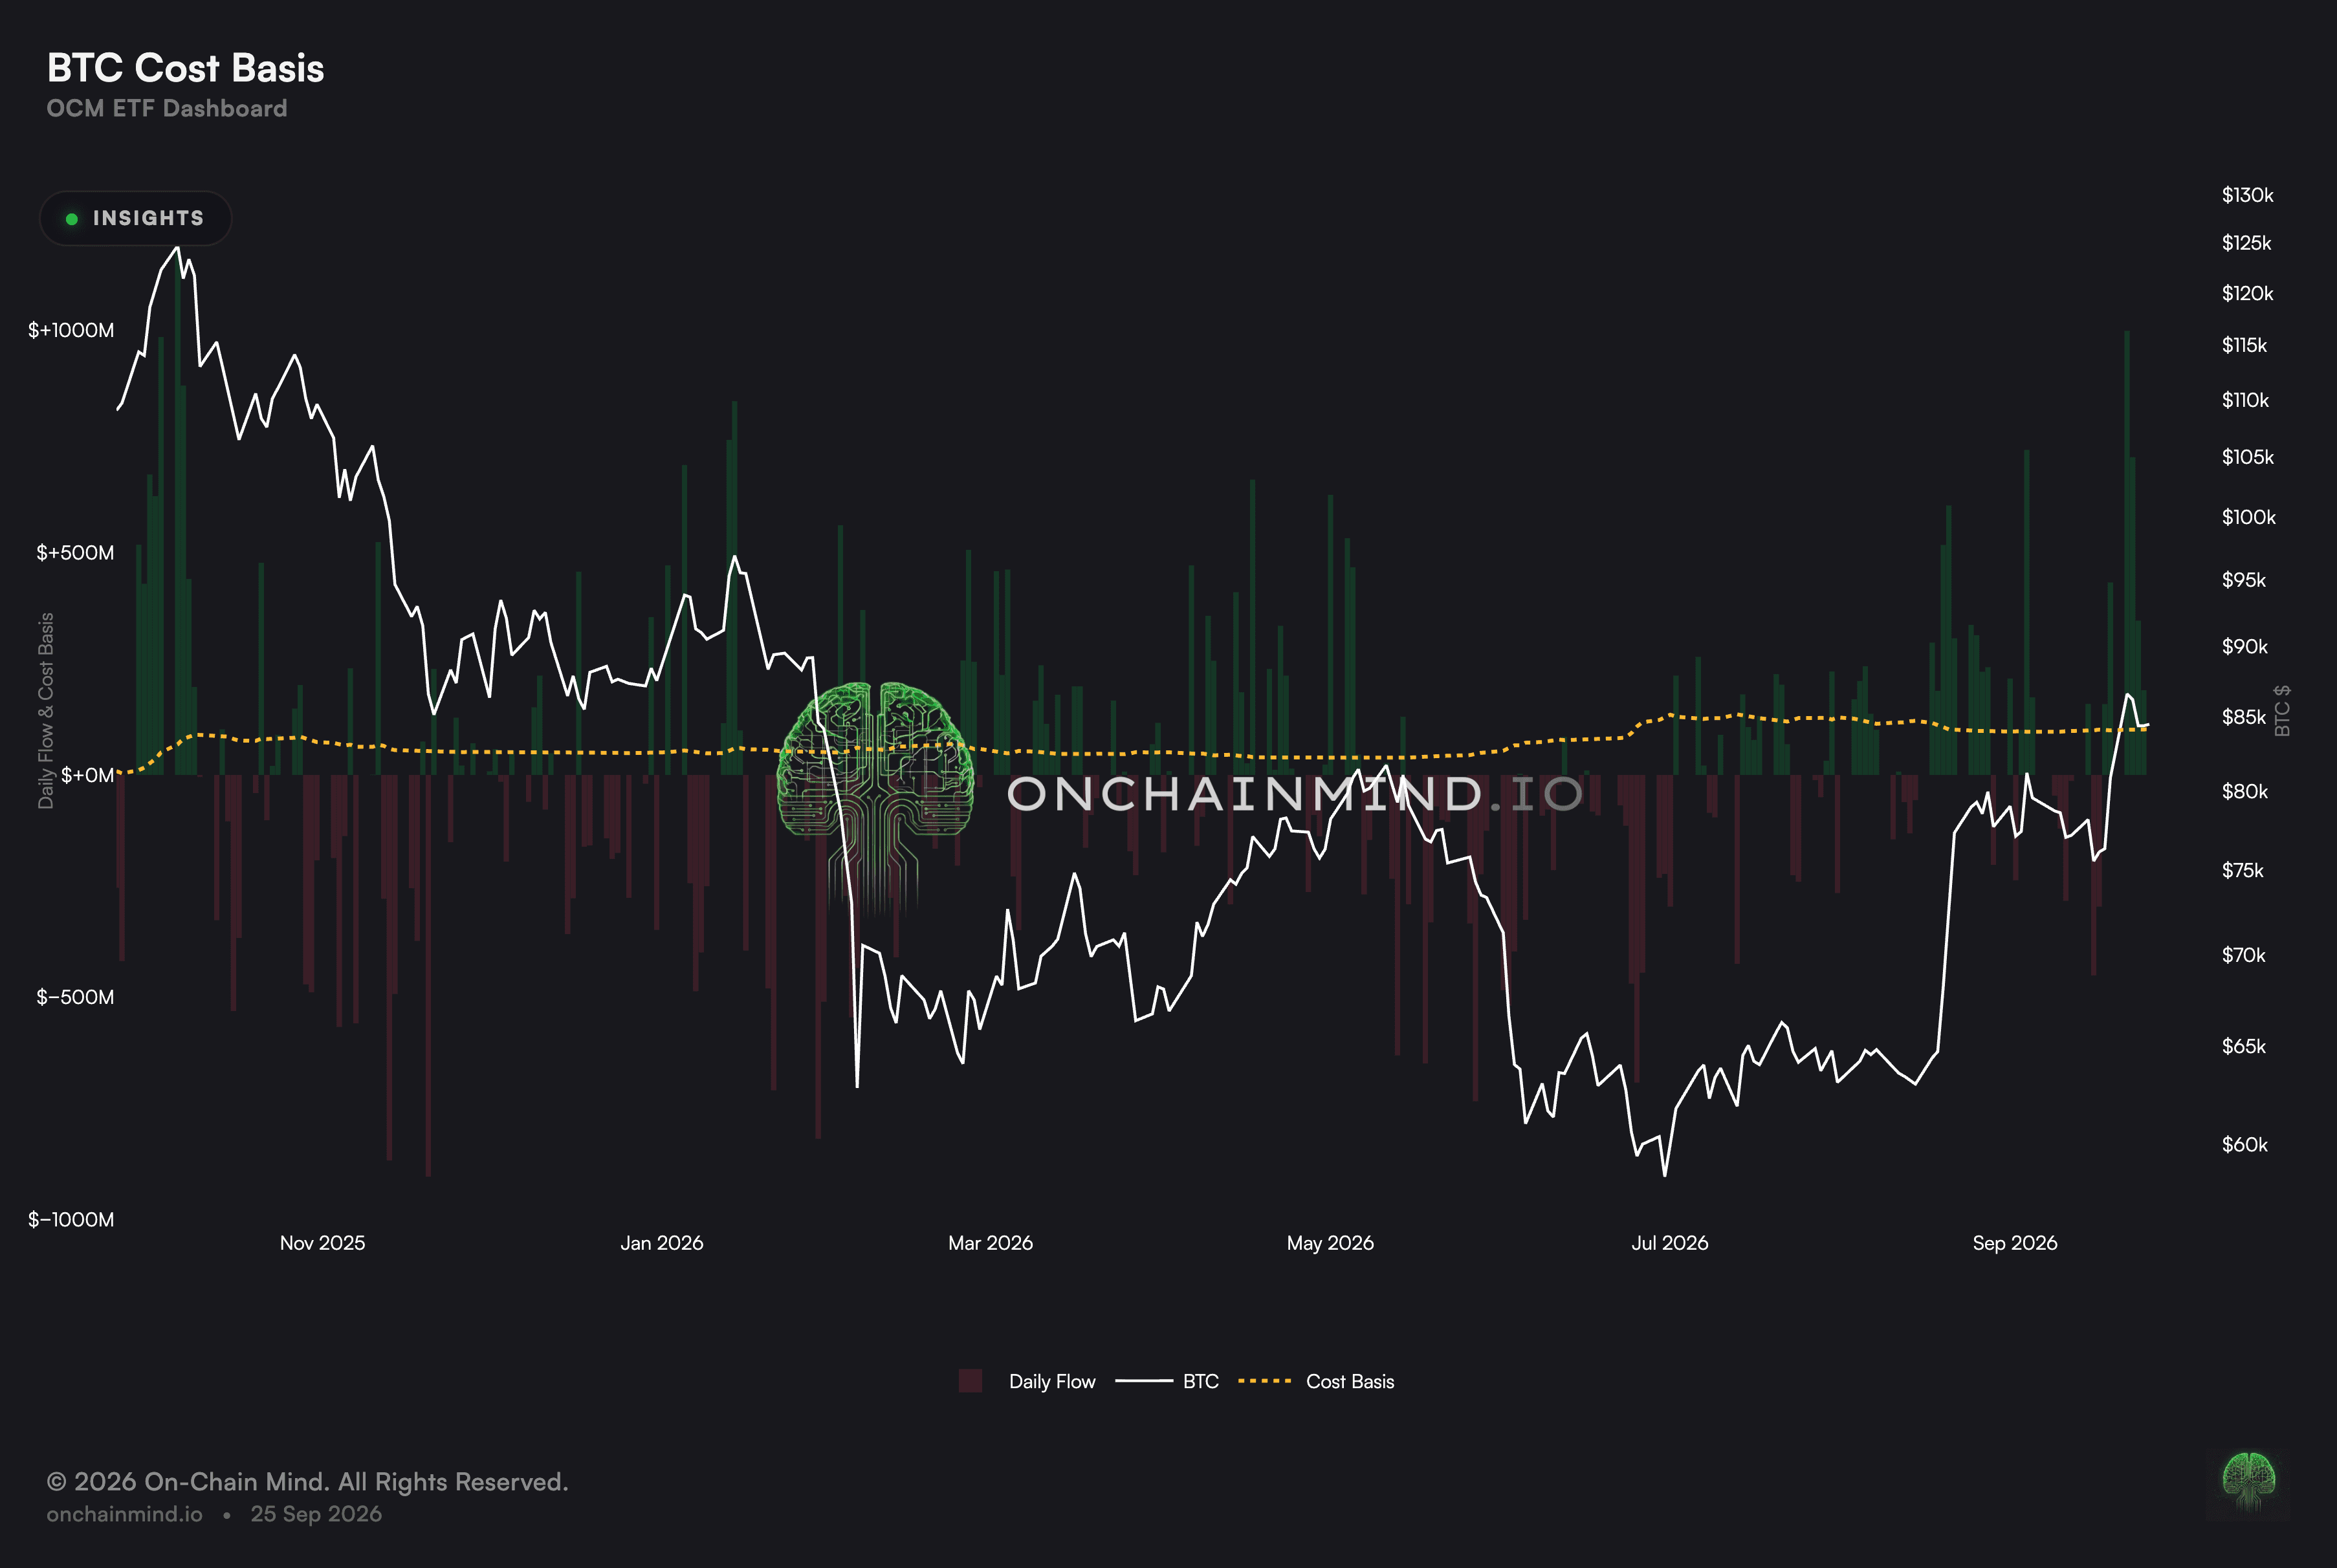
View live in OCM Studio: ETF Cost Basis (VWAP)
Nobody Is Actually Selling
Continue reading with OCM Premium
You have been reading the free preview of this article. The full analysis continues with 14 more sections, charts and takeaways. Read the full article or see OCM Premium plans.