
Right now you can buy $145 of Bitcoin for $85. That is not a typo, and it is stranger than it looks. The Bitcoin itself is underwater, below what Strategy paid for it. The stock is priced below even that. A discounted claim on an already-discounted asset.
There is a catch hiding in that $145, and it is the same thing that builds the upside too. The trade is whether it sinks them first.
So let’s settle it with maths. I’ll model three cases: conservative, reasonable, and bear. And here is the part that made me write this. Even on the worst valuation this company has ever printed, the stock still nearly doubles.
The story is not the upside. It is that the bear case still pays you. Assuming Saylor doesn’t blow this whole thing up.
Let’s get into it.
Key insights
Trading Below The Stack: The shares now change hands for noticeably less than the Bitcoin sitting behind every one of them, with valuation metrics at cycle floor levels.
The Flywheel Still Turns: Even through this drawdown, each share quietly lays claim to more Bitcoin than it did a year ago.
Asymmetry… With a Catch: Run the bear case to its ugliest setting and 3 years of maths still point up. The only real risk is self-inflicted.
My Trading Position: This discount has me stepping over a personal limit I almost never cross. I’ll show you exactly how far, and when I step back out.
The Current State of Affairs
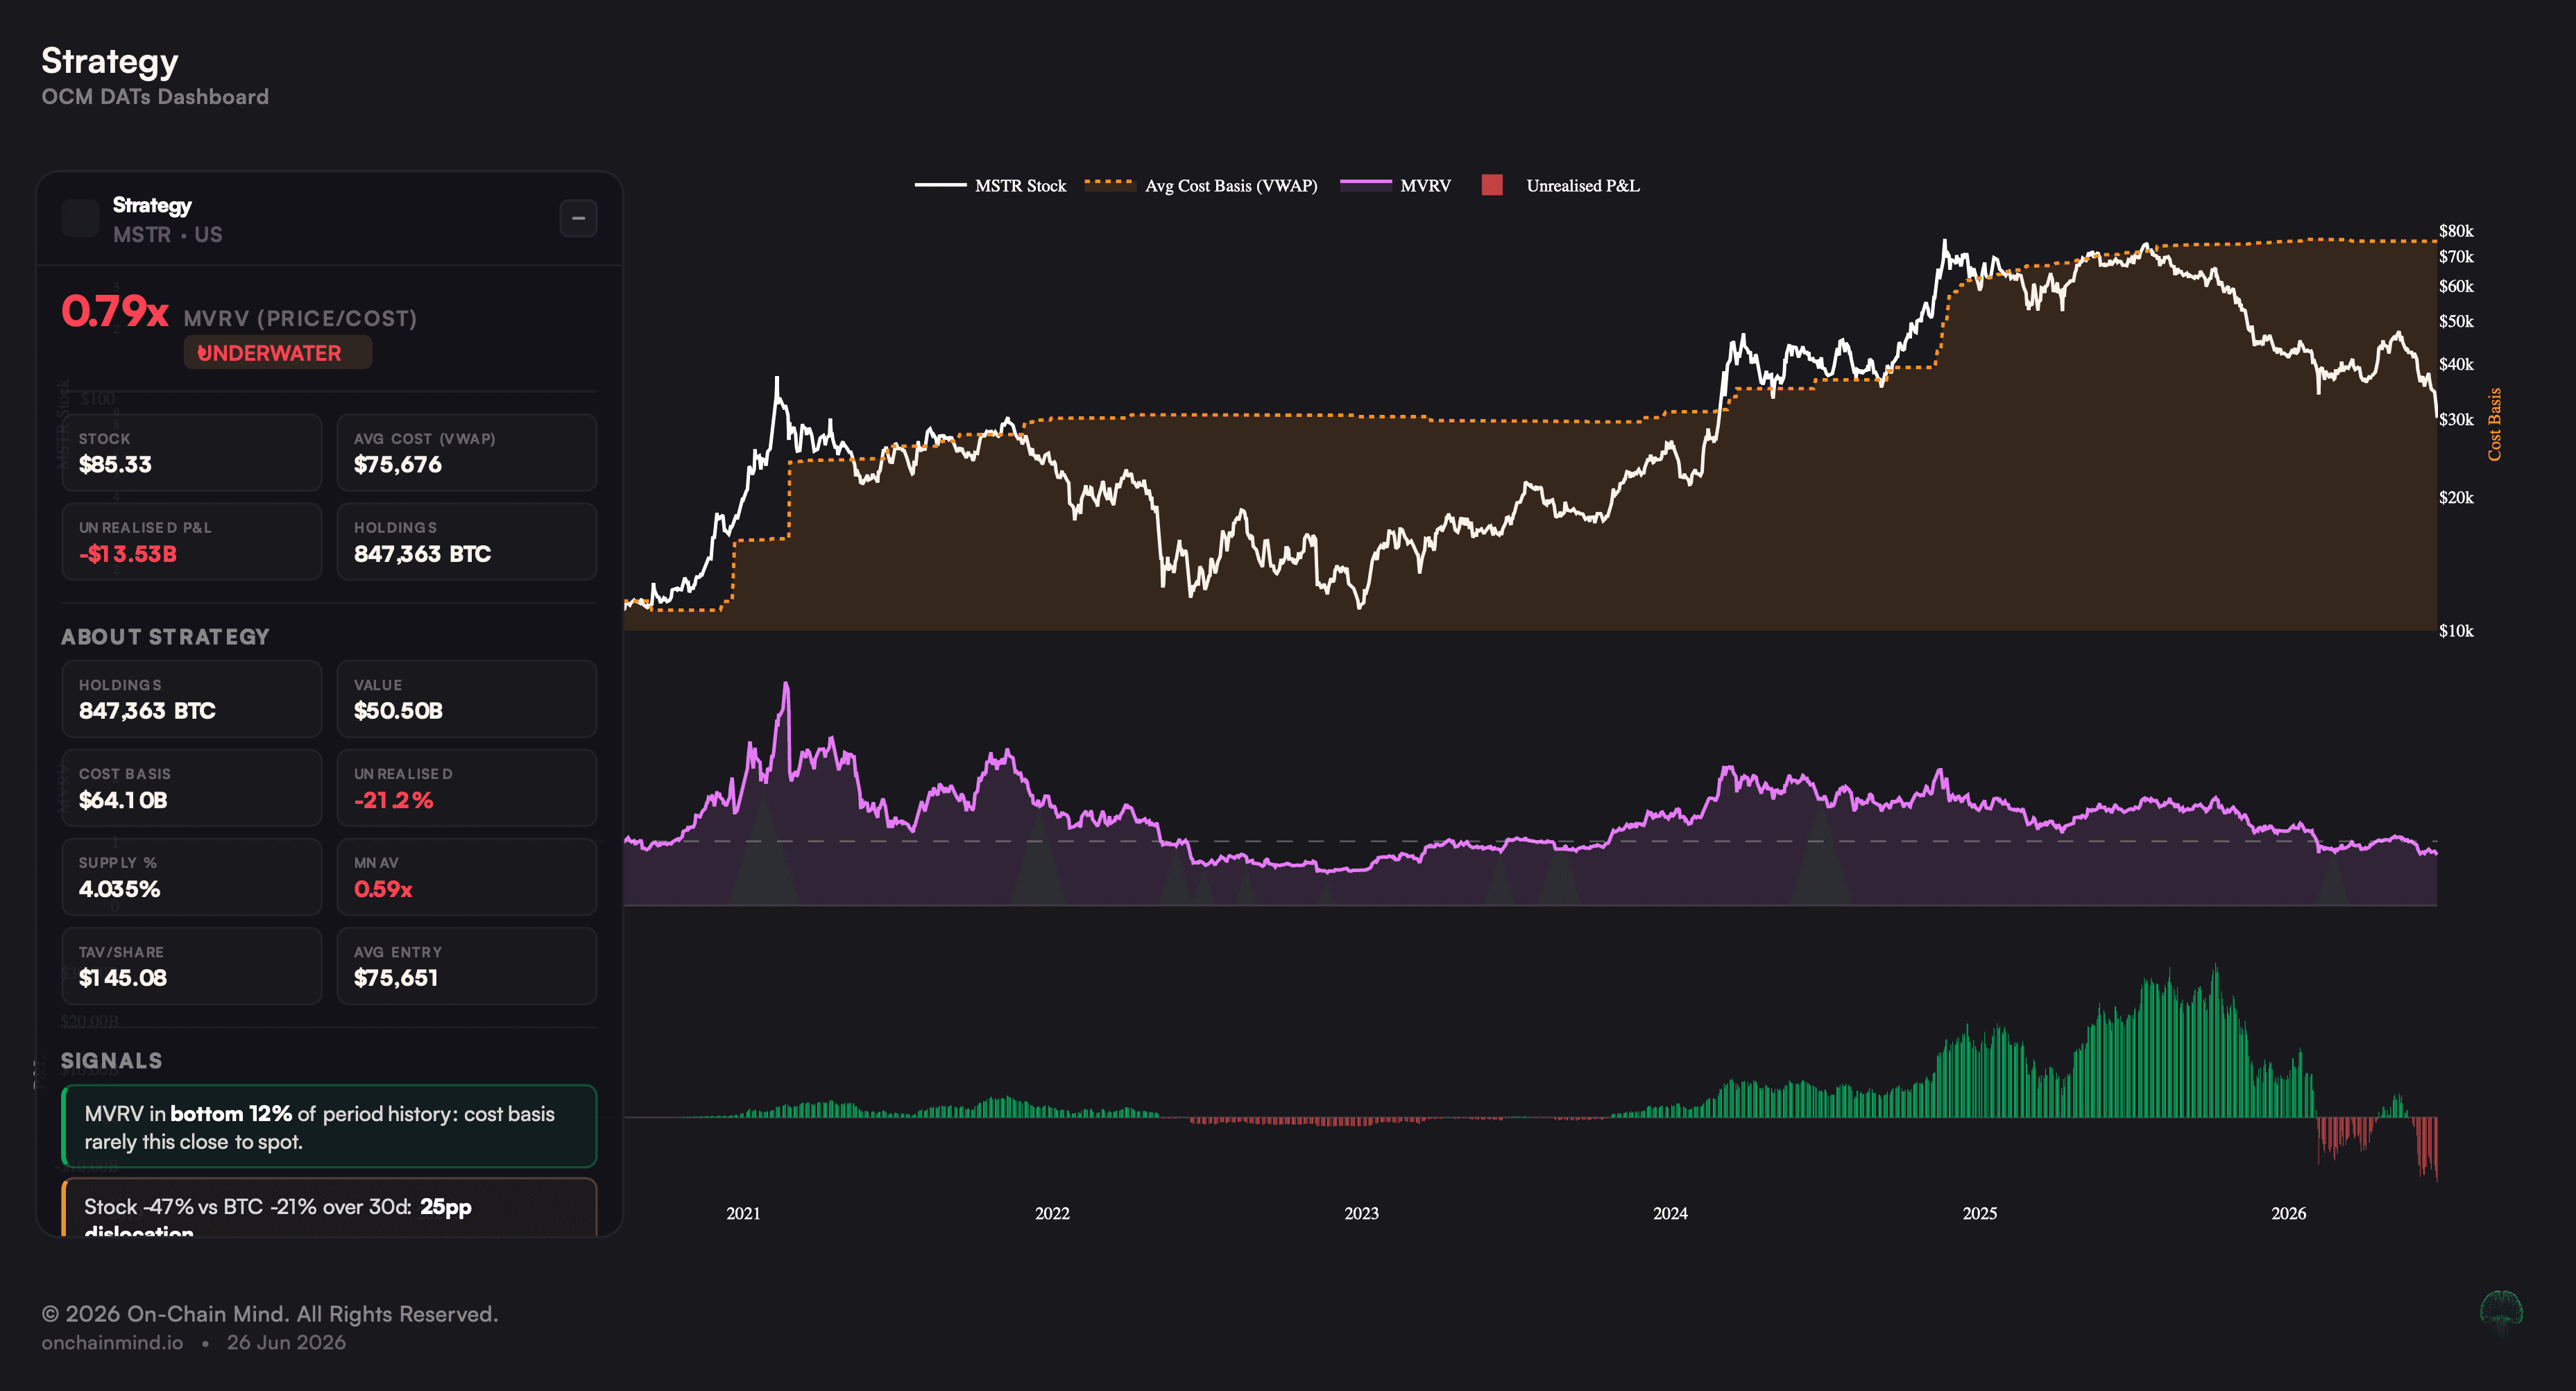
Let's start with the scale, because it is easy to lose sight of it. Strategy holds 847,363 BTC, worth roughly $50.5B at current prices. That is 4.03% of every Bitcoin that will ever exist, and around 44% of all corporate treasury and sovereign holdings combined. No other entity is even close.
Now to the part that has the market nervous. Their estimated VWAP cost basis, the volume-weighted average price paid across every purchase, sits at $75,676. So they have spent in the region of $64.1B assembling the position, and at today's prices the stack carries an unrealised loss of about -21.2%. The market can see that, and it is reacting accordingly.
This is where it got interesting for me. We can take a metric usually reserved for on-chain work, MVRV, and point it straight at Strategy.
MVRV, or Market Value to Realised Value, normally pits Bitcoin's market capitalisation against its realised capitalisation, the network's aggregate cost basis. Applied here it weighs the live value of the stack against what was paid for it.
Right now that reads 0.79, in the bottom 12% of its entire history. For context, the previous bear bottomed at 0.55, true capitulation territory.
So 0.79 is cheap, deeply so by historical standards, but not the absolute floor we have seen. Pessimism is doing the pricing here, not fundamentals.
View live in OCM Studio: MSTR Technicals
The Metric Nobody Talks About
Here is a number that almost never gets airtime and deserves to. Total Asset Value per share, or TAV/share, is simply the USD value of the treasury holdings divided by shares outstanding.
It answers a powerful question: how much Bitcoin stands behind each share? Right now that figure is $145.
Each share is backed by $145 of Bitcoin while the stock trades near $85. On the face of it, you are buying $145 of Bitcoin exposure for $85, the underlying asset for less than the contents of the box.
That is the gross number though, and you deserve the net one. Around $21B of debt and preferred stock sits ahead of the common, with first claim on the stack. Strip that out and the Bitcoin truly owned by each share is nearer $84, almost exactly today’s price.
The common is not being handed free Bitcoin. It is being handed a levered claim on it, priced at roughly par once you count everything standing in front of it.
This does not erase the discount. It tells you what kind of discount it is. The cheapness is real, but it is the cheapness of leverage, not a free lunch on spot. Hold that thought, because it is the engine behind both the upside I am about to model and the risk I finish on.
The discount here has a name most readers will know: mNAV, the multiple of net asset value, simply the market's valuation of the company set against the Bitcoin it holds. Above 1.0 is a premium, where investors pay up for future accumulation. Below 1.0 is a discount, where you get the Bitcoin cheap.
Strategy's mNAV currently sits at 0.59, a 41% discount to treasury value. It has compressed 33% in the last month alone, which is a violent turn in sentiment. The all-time low was 0.51, set in the last bear. We are not there, but we are within touching distance.
View live in OCM Studio: MSTR mNAV
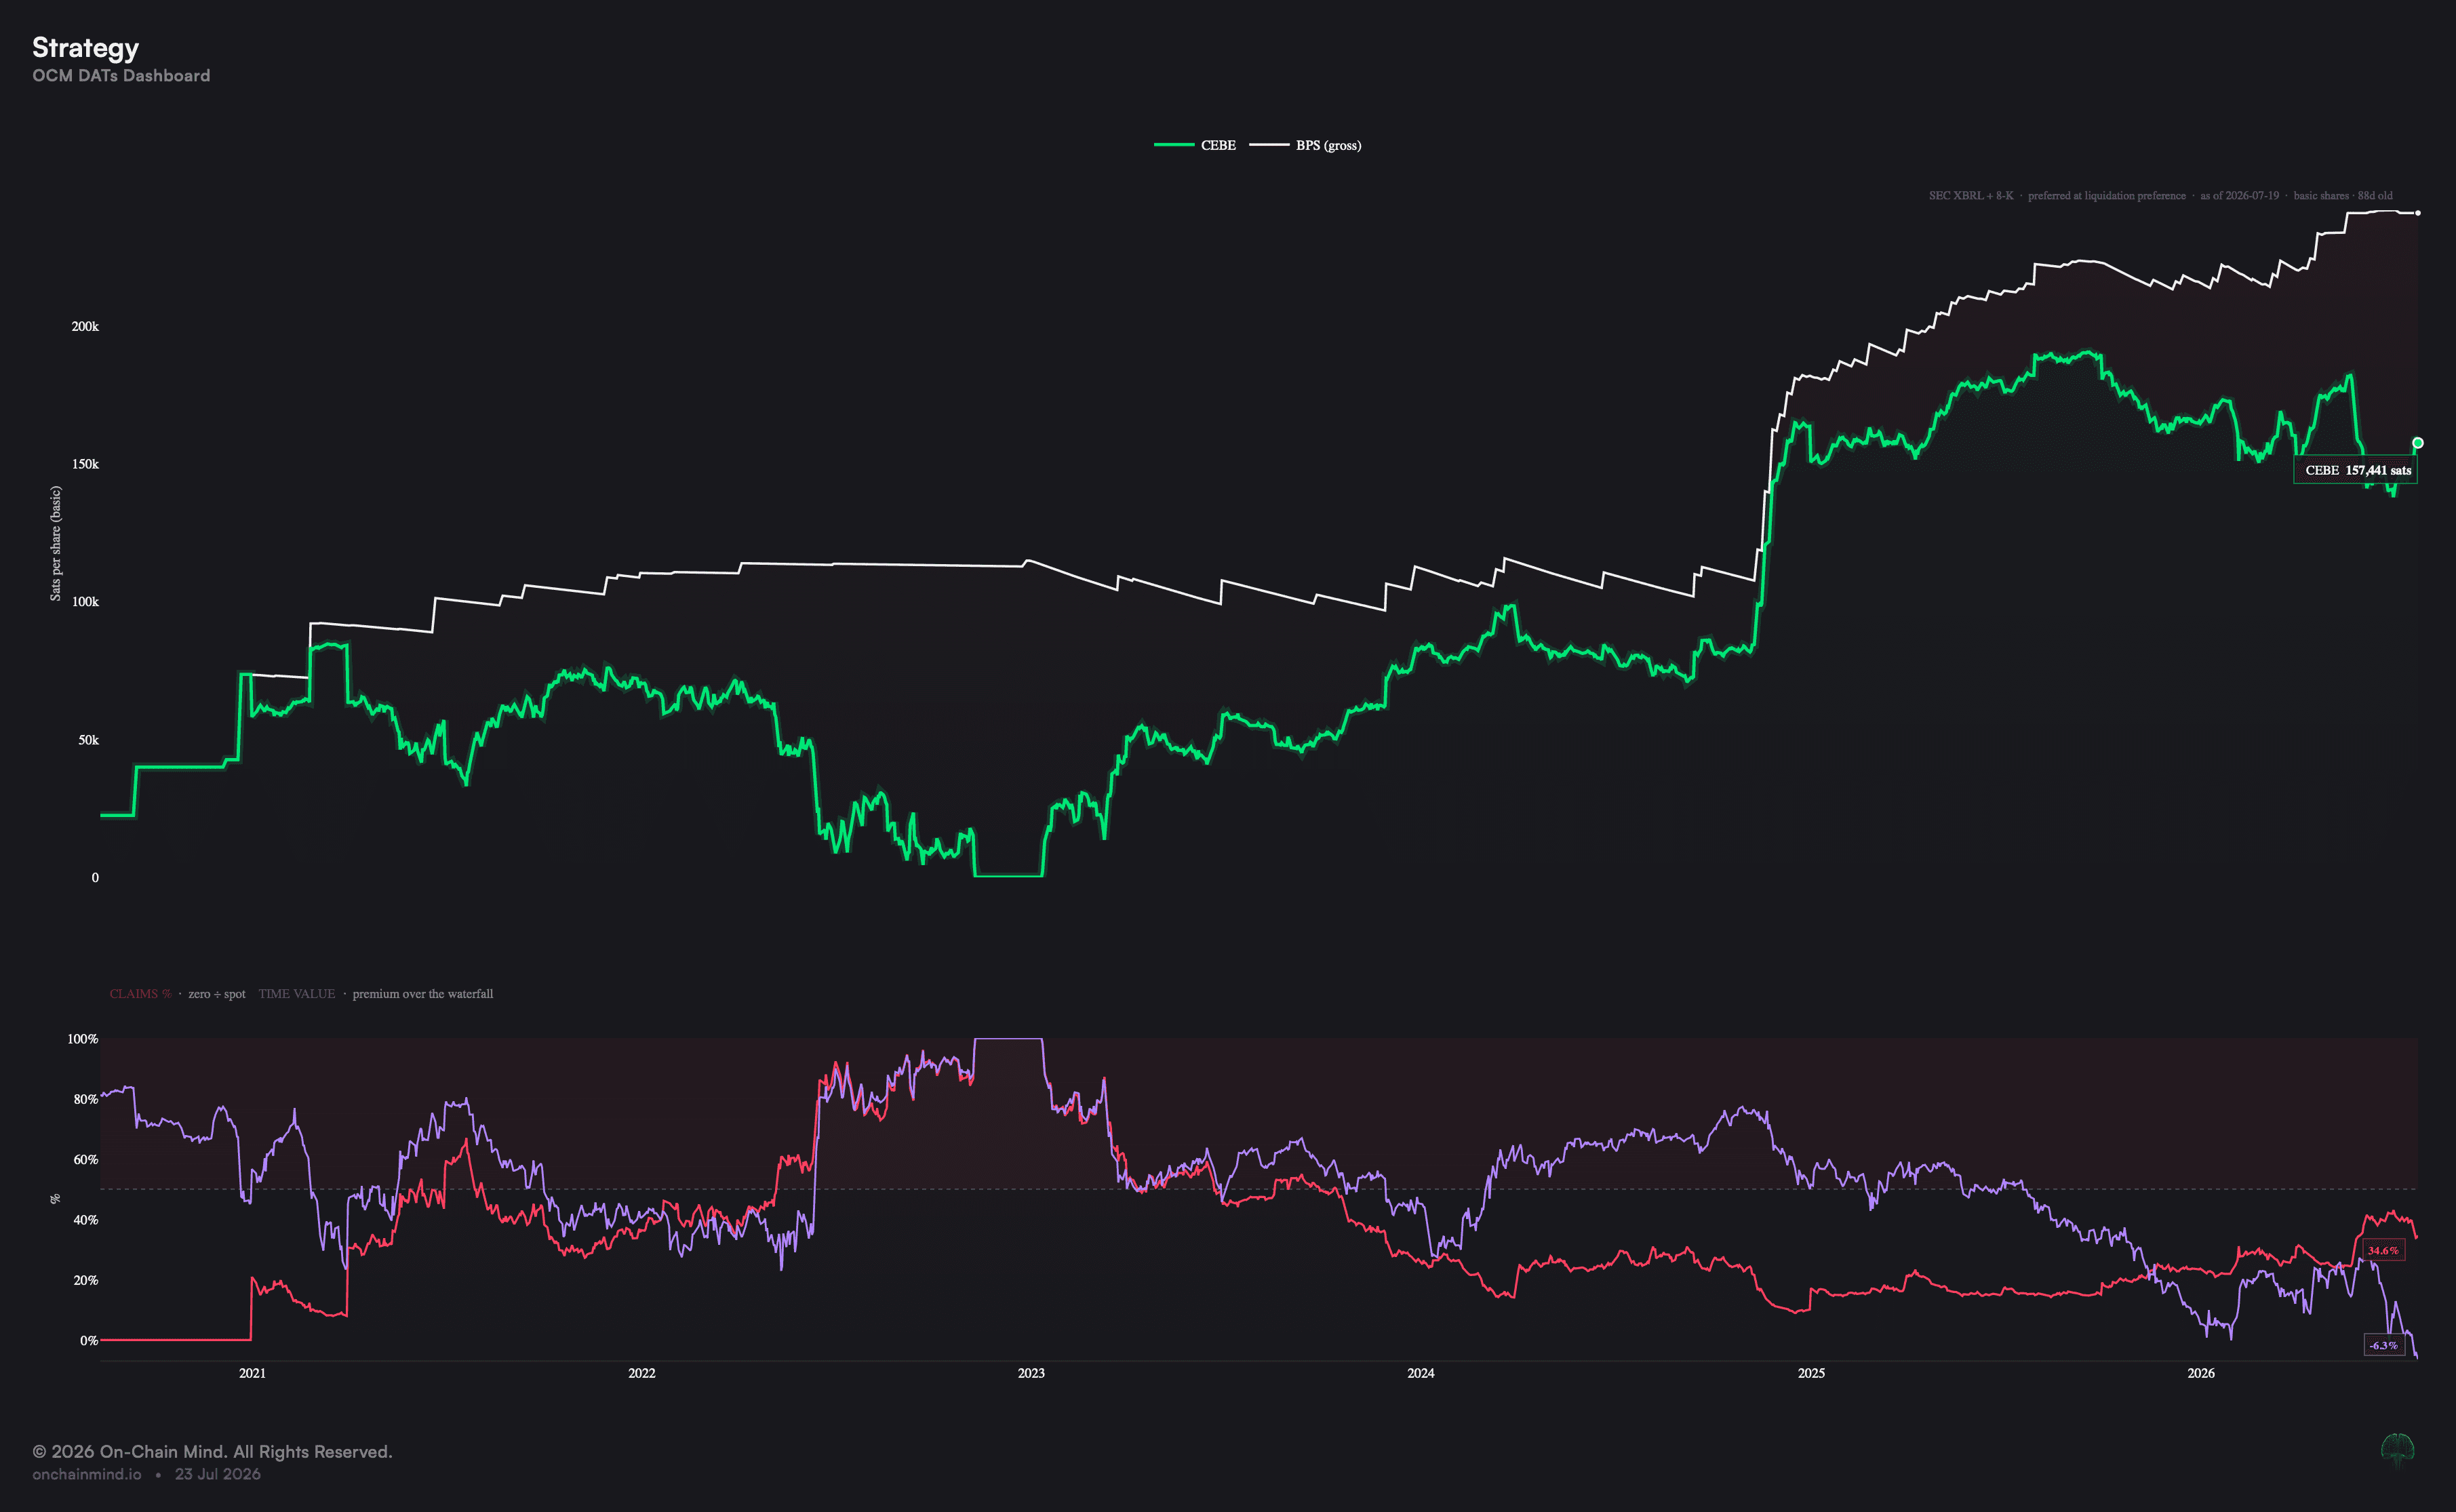
So is the strategy actually broken? The metric that answers that best is Shares per BTC, and it is quietly emphatic. It sits at 412, down from 464 a year ago and 551 the year before. Falling shares per BTC is the whole game: despite all the issuance, each share now lays claim to more Bitcoin than it used to. Accumulation is outpacing dilution.
View live in OCM Studio: MSTR Shares per BTC
One caveat, because it matters later. That climb only works above 1.0. Above NAV, every share sold lifts the per-share claim. Below it, the machine reverses: cheap stock, full-price Bitcoin.
The 412 is a year spent mostly at a premium. At 0.59, fresh equity dilutes. Which is exactly why the pivot to preferred, hand-wringing aside, is the rational move, not vanity. At a discount, you fund with anything but cheap stock.
And it has paid off. Since inception, MSTR has still delivered 108% of cumulative outperformance over Bitcoin. Through brutal price weakness, the company has still out-returned spot BTC. The strategy is working.
Running the Projections
This is where the maths gets specific. Four cases, four price targets, and the one in the middle that made me write this. Then what I am actually doing about it and the position I am taking.
Continue reading with OCM Premium
You have been reading the free preview of this article. The rest of it (about 1,100 more words and 4 more charts) is for OCM Premium members. See OCM Premium plans.