
MSTR price is collapsing and the market sentiment has flipped faster than anyone expected.
Over the past year, we’ve seen Strategy lose almost 60% of its value in Bitcoin terms, and the technical signals are now flashing bear market warnings for the first time this cycle. But before you panic, there’s also massive upside potential if Bitcoin rebounds and MSTR’s premium recovers.
In this article, I’m going to break it all down: why MSTR has underperformed, what the collapsing mNAV really means, the bearish and bullish technical scenarios, and exactly how I’m positioning my portfolio in the midst of all this carnage.
Key insights
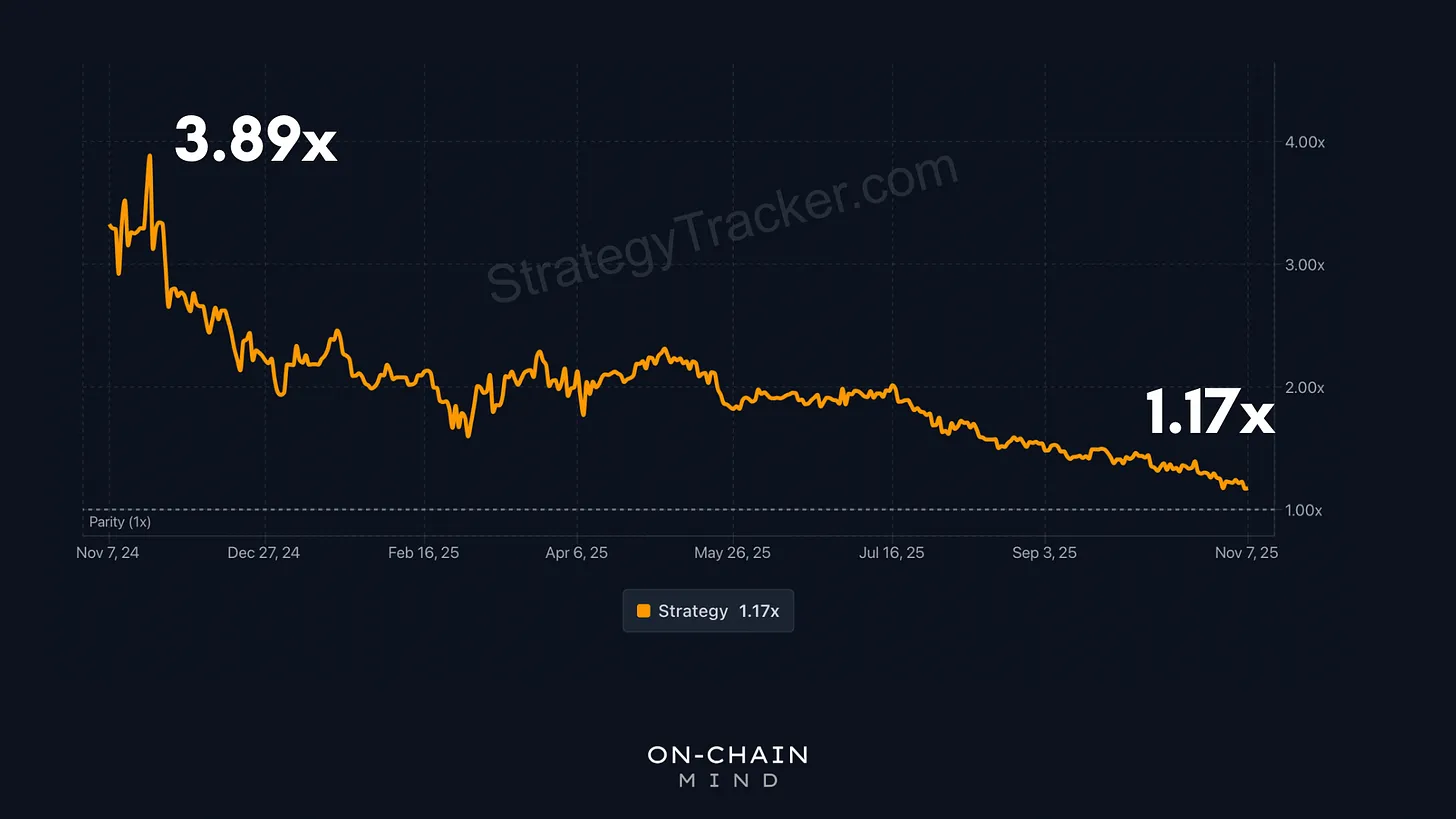
Extreme mNAV Compression: MSTR has lost 60% in Bitcoin terms, outpacing Bitcoin’s 13% drop as its mNAV has crashed from 3.89x to 1.17x.
Bearish Technical Signals: Indicators like the Moving Average Cloud, MomentumCoalescence and Alpha Flow suggest a potential bear market ahead.
Bullish Upside Potential: If Bitcoin rallies and mNAV expands, MSTR could see 2x–4x returns from current levels in the medium-term.
My Current Strategy: I reveal my exact game plan with MSTR and how I aim to pragmatically manage my risk.
MSTR’s Underperformance: The Harsh Numbers
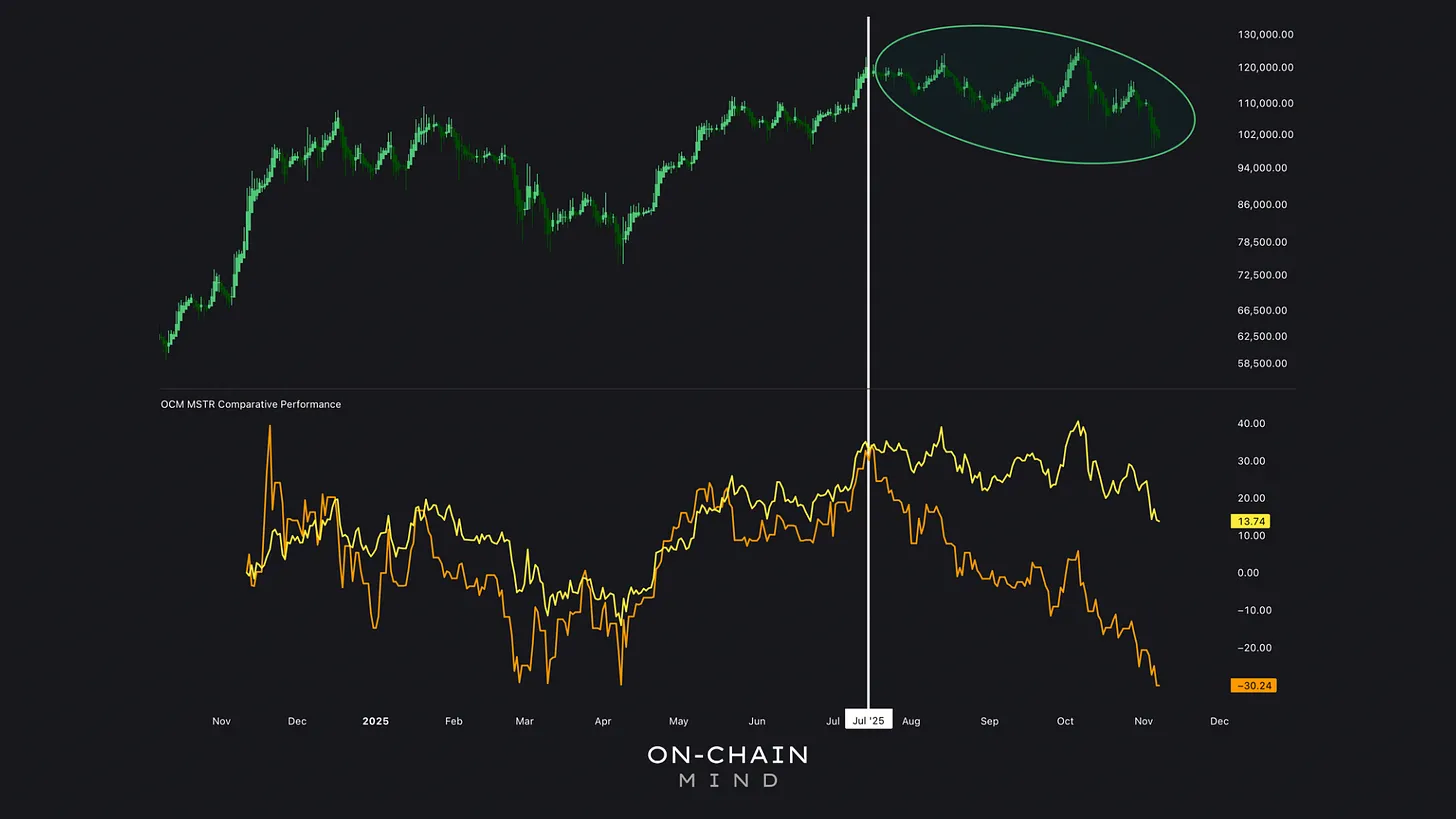
Let’s start with the hard truth: MSTR has lost nearly 60% in Bitcoin terms over the past year. Brutal. And yet, when we frame its performance in the context of the broader bull cycle, it’s a little more nuanced.
Since the start of this bull market, even with the recent decline, MSTR has more than doubled your Bitcoin-denominated wealth. At its peak, it even offered over 5x returns relative to a Bitcoin-only position. That’s a massive win for those of us who understood the asymmetric potential early on.
But the recent divergence cannot be ignored. From November 2024 until July 2025, MSTR tracked Bitcoin almost perfectly on a one-to-one basis. Then something changed. The extended chop and consolidation in Bitcoin shook sentiment hard. MSTR diverged dramatically: Bitcoin fell roughly 13% in USD terms over the past year, while MSTR fell over 30%, a more than 2.3x underperformance.
The question is why.
The mNAV Meltdown
It’s tempting to blame execution, but that’s actually not the story here. MSTR’s “Satoshis per share” metric, the ultimate measure of Strategy’s success, has continued to increase quarter over quarter. Execution hasn’t failed.
The real culprit is mNAV, or market-to-net-asset-value premium. Back in November 2024, mNAV sat at 3.89x. Now, it’s collapsed to 1.17x. This compression explains almost all of MSTR’s Bitcoin-denominated losses.
The stock’s premium was its key driver of its outperformance, but it has now evaporated. Even if Bitcoin was reaching new highs today, the mNAV collapse would have negated those gains.
Why is mNAV Falling?
There are a few potential explanations:
Preferred Share Adoption Lag: MSTR’s preferred instruments (the various STRx products) are designed to generate Bitcoin yield without relying on ATMs. They’re still relatively unproven, which may be limiting investor confidence. Skeptics argue they are unsustainable, though that might be overly pessimistic.
Credit Market Pressure and Whale Participation: Fewer institutional players are willing to engage with MSTR’s leveraged Bitcoin strategy, and tighter credit conditions exacerbate the compression. This lack of demand contributes to mNAV suppression.
Cycle Timing Concerns: MSTR is inherently tied to Bitcoin. If investors sense that the bull market is maturing (or even that a bear market is imminent), they are naturally less willing to pay a premium. The mNAV reflects this market-wide fear.
The Monthly vs. Yearly Moving Average Cloud
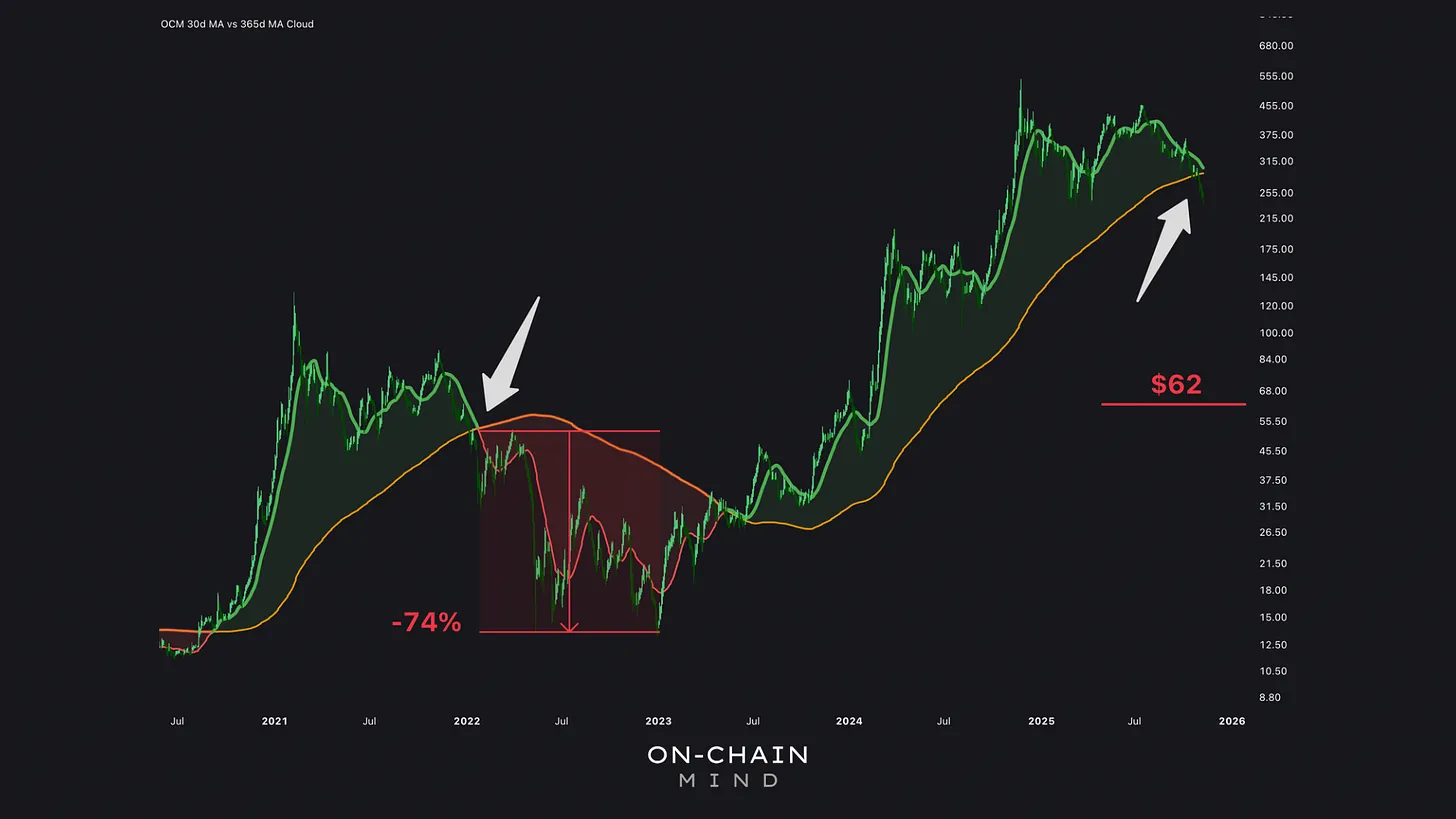
Now let’s talk technicals. There are clear warning signs emerging that suggest MSTR could face a significant drawdown in the medium-term.
This here is my go-to macro indicator for identifying bull vs. bear markets. Comparing monthly and yearly moving averages provides a clear view of long-term trends.
Currently, the monthly line is rolling over rapidly, and if the trend continues, the cloud will flip red within weeks.
Momentum Coalescence
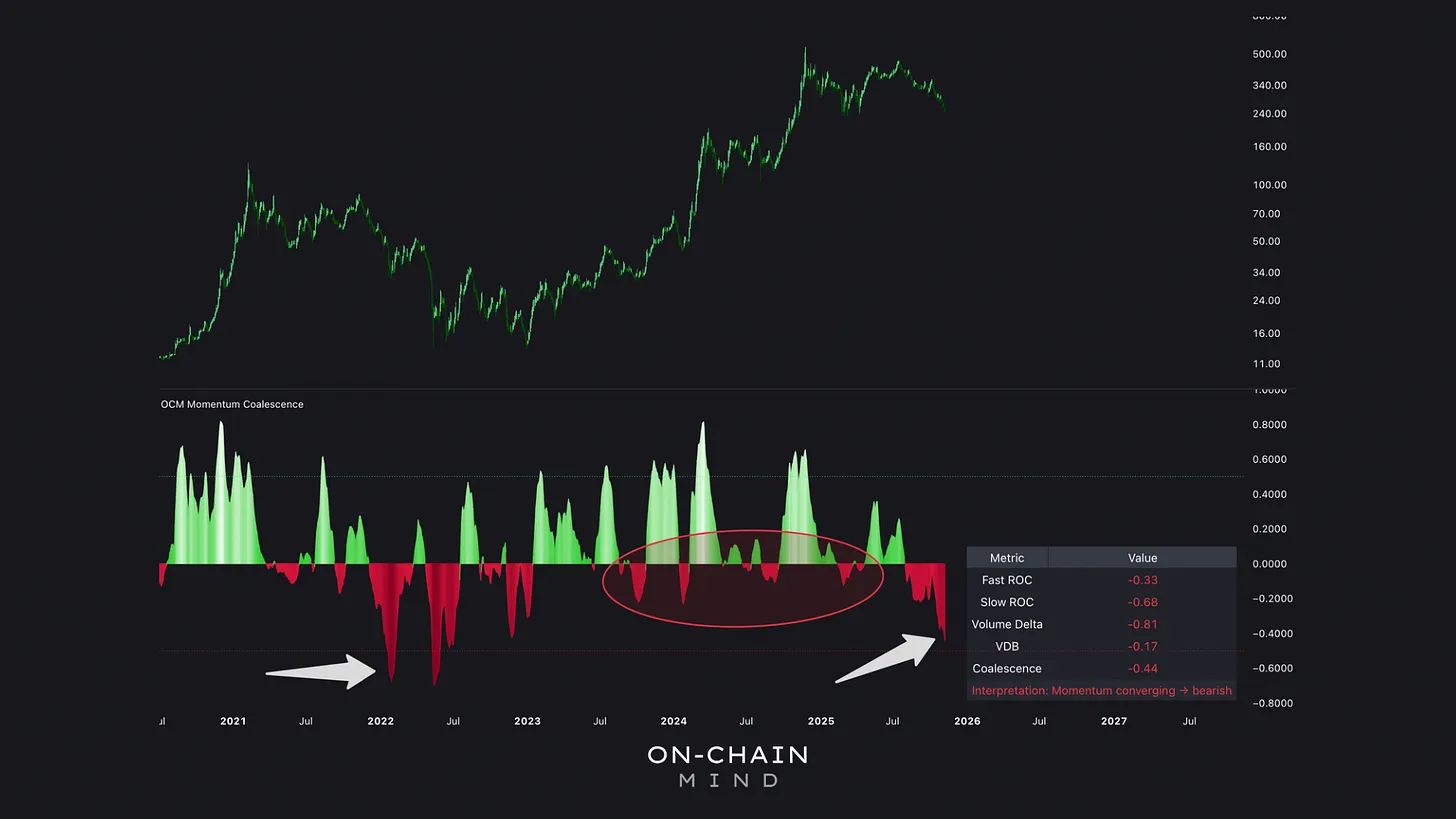
I developed this to cut through noisy signals by fusing price acceleration, trend persistence, volume pressure, and volatility bias into a single metric. When all these forces align, we get a powerful macro signal.
Currently, the Coalescence is showing the largest negative spike since the last bear market began. In simpler terms: momentum is decisively bearish. This is a major signal that cannot be ignored.
Alpha Flow
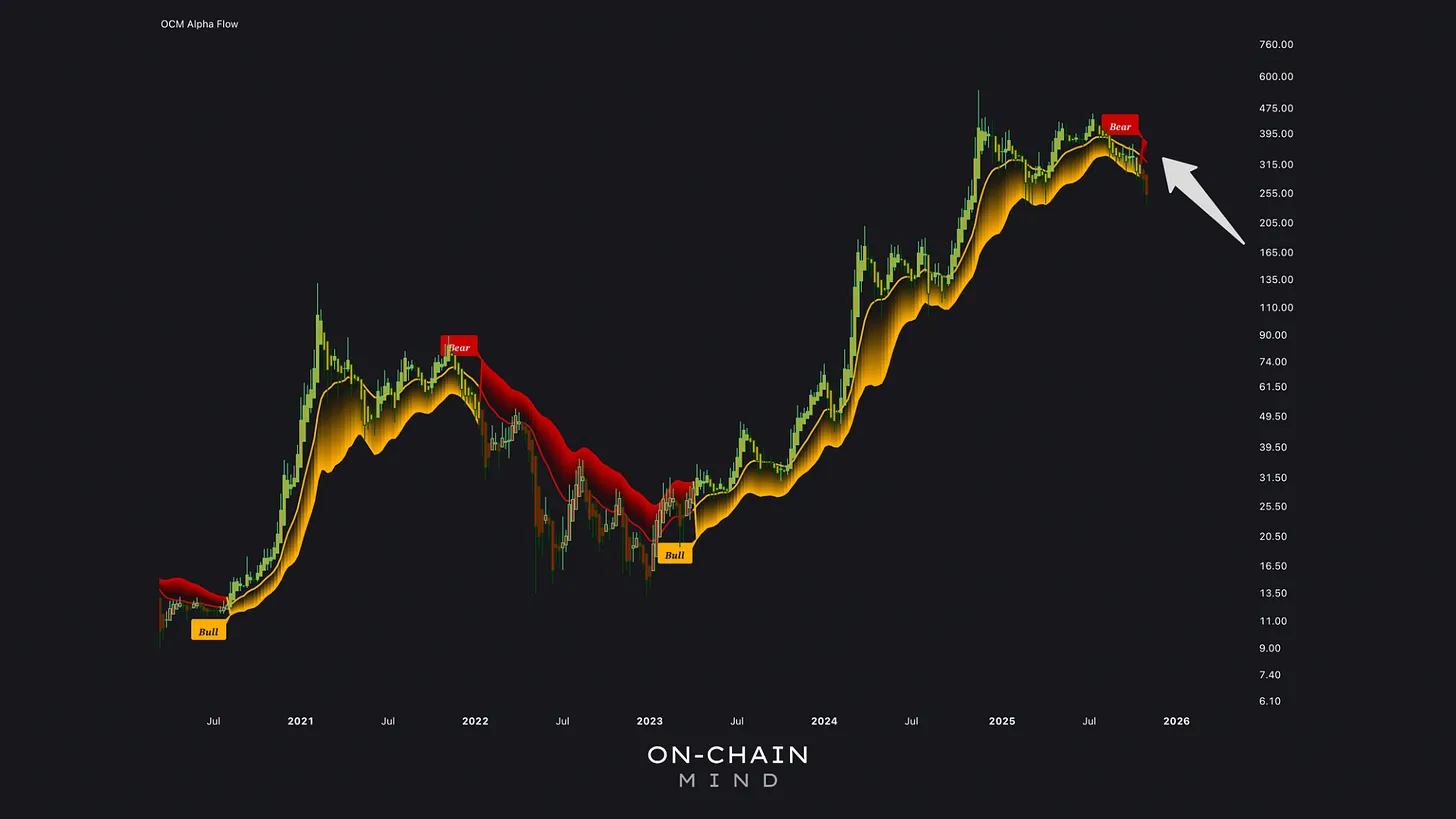
This identifies trend switches by tracking price movement relative to volatility-adjusted bands. Historically, it has been reliable for both Bitcoin and MSTR.
Right now, for the first time this cycle, it’s signalling a bear market ahead. This is a full alignment of market forces indicating the start of a potential massive medium-term correction.
How Low Could MSTR Go?
If Bitcoin enters a bear market from here, the downside is largely dictated by two factors: Bitcoin’s price action and MSTR’s mNAV.
Bearish Bitcoin Scenario: Suppose Bitcoin drops 50% from its all-time high of $126,000, landing near $63,000.
Bearish mNAV Scenario: If mNAV compresses further to 0.7–0.8, like in the previous bear, MSTR could trade between $95 and $101, which is roughly a 60% decline in USD terms.
While less extreme than the 74% drop suggested by the Moving Average Cloud, this scenario is still significant, especially relative to Bitcoin.
The Upside Potential
Even with these warning signs, MSTR remains highly leveraged to Bitcoin’s future performance. And this is where the risk-reward asymmetry becomes fascinating.
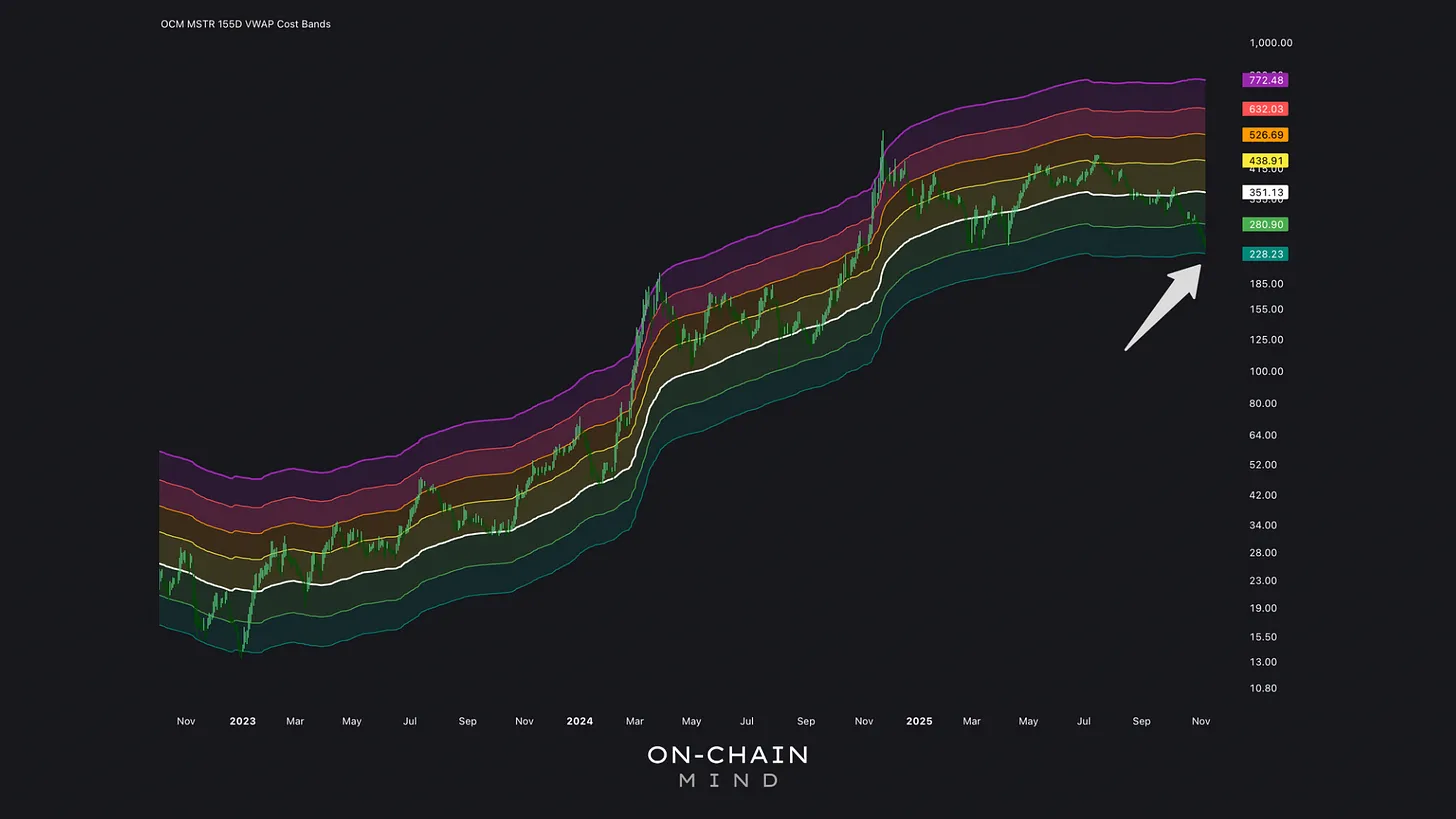
I use the 155-day VWAP Cost Bands indicator as a proxy of MSTR’s short-term holder realised price. Right now, MSTR’s 155-day VWAP sits at $351, while the current price is around $240. In other words, the stock is in probably the best buying zone of this bull cycle if you’re bullish on Bitcoin’s continued upside into 2026.
mNAV Expansion Potential
On the bullish side, mNAV could recover toward historical norms:
Historical norm: ~2.0
Peak sentiment scenario (November 2024): ~3.8
Assuming Bitcoin breaks its all-time high to a modest $130,000 and mNAV expands to these levels, MSTR could trade between $550 and $1,050.
That’s a 2x–4x return, which is a tantalising amount of potential upside for the bulls. But the key driver here is sentiment. If the market regains confidence in MSTR, the mNAV could rebound very sharply, and the price of Bitcoin would become only a secondary thought.
My Current Take & Personal Strategy
Continue reading with OCM Premium
You have been reading the free preview of this article. The rest of it (about 750 more words) is for OCM Premium members. See OCM Premium plans.