
Most investors think something broke with MSTR. The price lagged. mNAV collapsed. Sentiment turned sour. But that conclusion says more about emotional anchoring than it does about what actually happened under the hood.
In this article, I walk through why MSTR executed exactly as designed, why mNAV compression (not strategy failure) drove the underperformance, why momentum signals are now at historic extremes, and how the risk profile of this trade has quietly but materially reset here in 2026.
Key insights
Satoshis Per Share Dominance: Strategy’s core yardstick keeps climbing relentlessly, delivering a 35.8% BTC yield in 2025.
mNAV Compression Complete: The massive valuation premium that fuelled earlier outperformance has largely evaporated, leaving far more upside than downside risk.
Extreme Oversold Signals: The Velocity RSI (priced in BTC) has never been this oversold, even versus the depths of the previous bear market.
Asymmetric Payoff Structure: Bitcoin downside is now the primary risk, while mNAV expansion offers leveraged upside that could prove spectacular.
The Uncatchable Bitcoin Juggernaut
I think 2026 could be a brutal year for many Bitcoin corporate treasury companies. Some will underperform badly. Some may quietly unwind. A few could even go bust. And if that happens at scale, it won’t be particularly helpful for short-term Bitcoin price action either.
But Strategy sits in a completely different category.
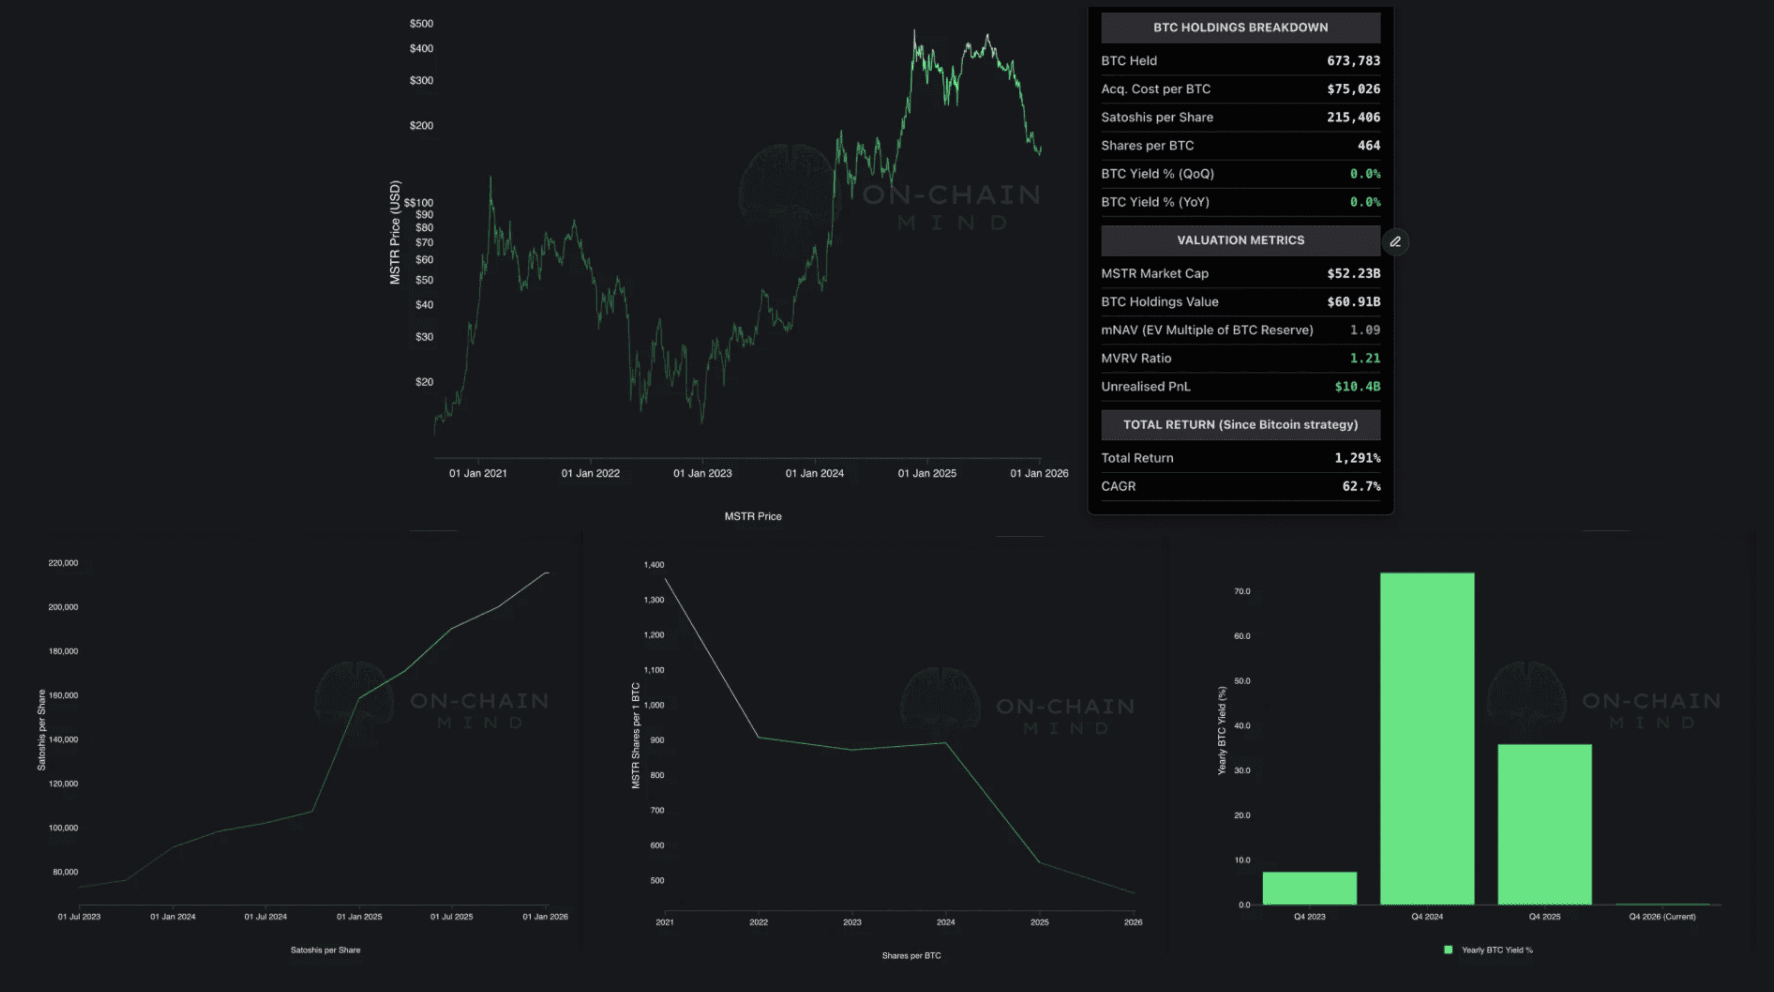
With 673,783 BTC now on the balance sheet, MSTR is not just ahead, it is uncatchable. There is no plausible path where another public company closes that gap. Not through capital markets. Not through operating cash flow. Not through timing luck. That race is over.
And this matters, because Bitcoin treasury strategies are not equal. In stressed conditions, size becomes defence. Liquidity becomes survival. Credibility becomes optionality.
MSTR has all three.
More importantly, their strategy is still executing exactly as designed. You have to anchor on that fact, because it gets lost when price underperforms.
Let’s look at what actually happened in 2025.
Their primary performance metric is not share price. It’s Satoshis Per Share. And on that front, they delivered.
Satoshis per share increased from 158,600 at the end of 2024 to 215,406 at the end of 2025.
That equates to a BTC yield of 35.8% for the year.
In practical terms, MSTR generated more Bitcoin per share than the year before.
To put that into perspective, in 2024 you needed 551 shares of MSTR to equate to 1 Bitcoin. By the end of 2025, that number dropped to 464 shares. That is not failure. That is mechanical execution.
And this is where many investors lose the plot. They look at relative performance, feel pain, and conclude something broke. It didn’t. The engine did exactly what it was supposed to do. The valuation layer on top of it is what moved violently.
Which brings us to the uncomfortable but necessary question.
Introducing Liveliness
To truly grasp the Active Supply, we need to introduce a critical concept: liveliness. Liveliness tracks whether Bitcoin is being spent or held, and it does so through a metric called the coin days destroyed.
Here’s how it works. Coins accumulate “days” while sitting idle:
If you hold 1 Bitcoin for 10 days without moving it, you have 10 coin days.
If 10 Bitcoin coin hasn’t moved in 5 years, that’s 18,250 coin days.
When that coin finally moves, all those accumulated days are “destroyed”. That destruction is significant because it reflects the behaviour of long-term holders and can indicate major shifts in market psychology.
When liveliness rises → older coins are moving, and long-term holders are spending. This is usually a distribution phase.
When liveliness falls → coins stay dormant, and accumulation is happening.
Active Supply essentially applies liveliness across the entire Bitcoin supply, measuring how much of the network is “alive” and circulating versus how much is locked away in the vaults of the conviction-rich.

Why did MSTR Suffer?
Continue reading with OCM Premium
You have been reading the free preview of this article. The rest of it (about 1,100 more words and 3 more charts) is for OCM Premium members. See OCM Premium plans.