
Today, we’re diving into 10 great questions submitted by you, covering everything from long-term holder behaviour and ETF flows to defining Bitcoin’s true “fair value” and navigating prolonged periods of sideways price action.
A lot to unpack in this one, so let’s get straight into it.
1. Are Long-Term Holders Distributing Into This Range?
Question: Do you see any signs that long-term holders are distributing into this consolidation?
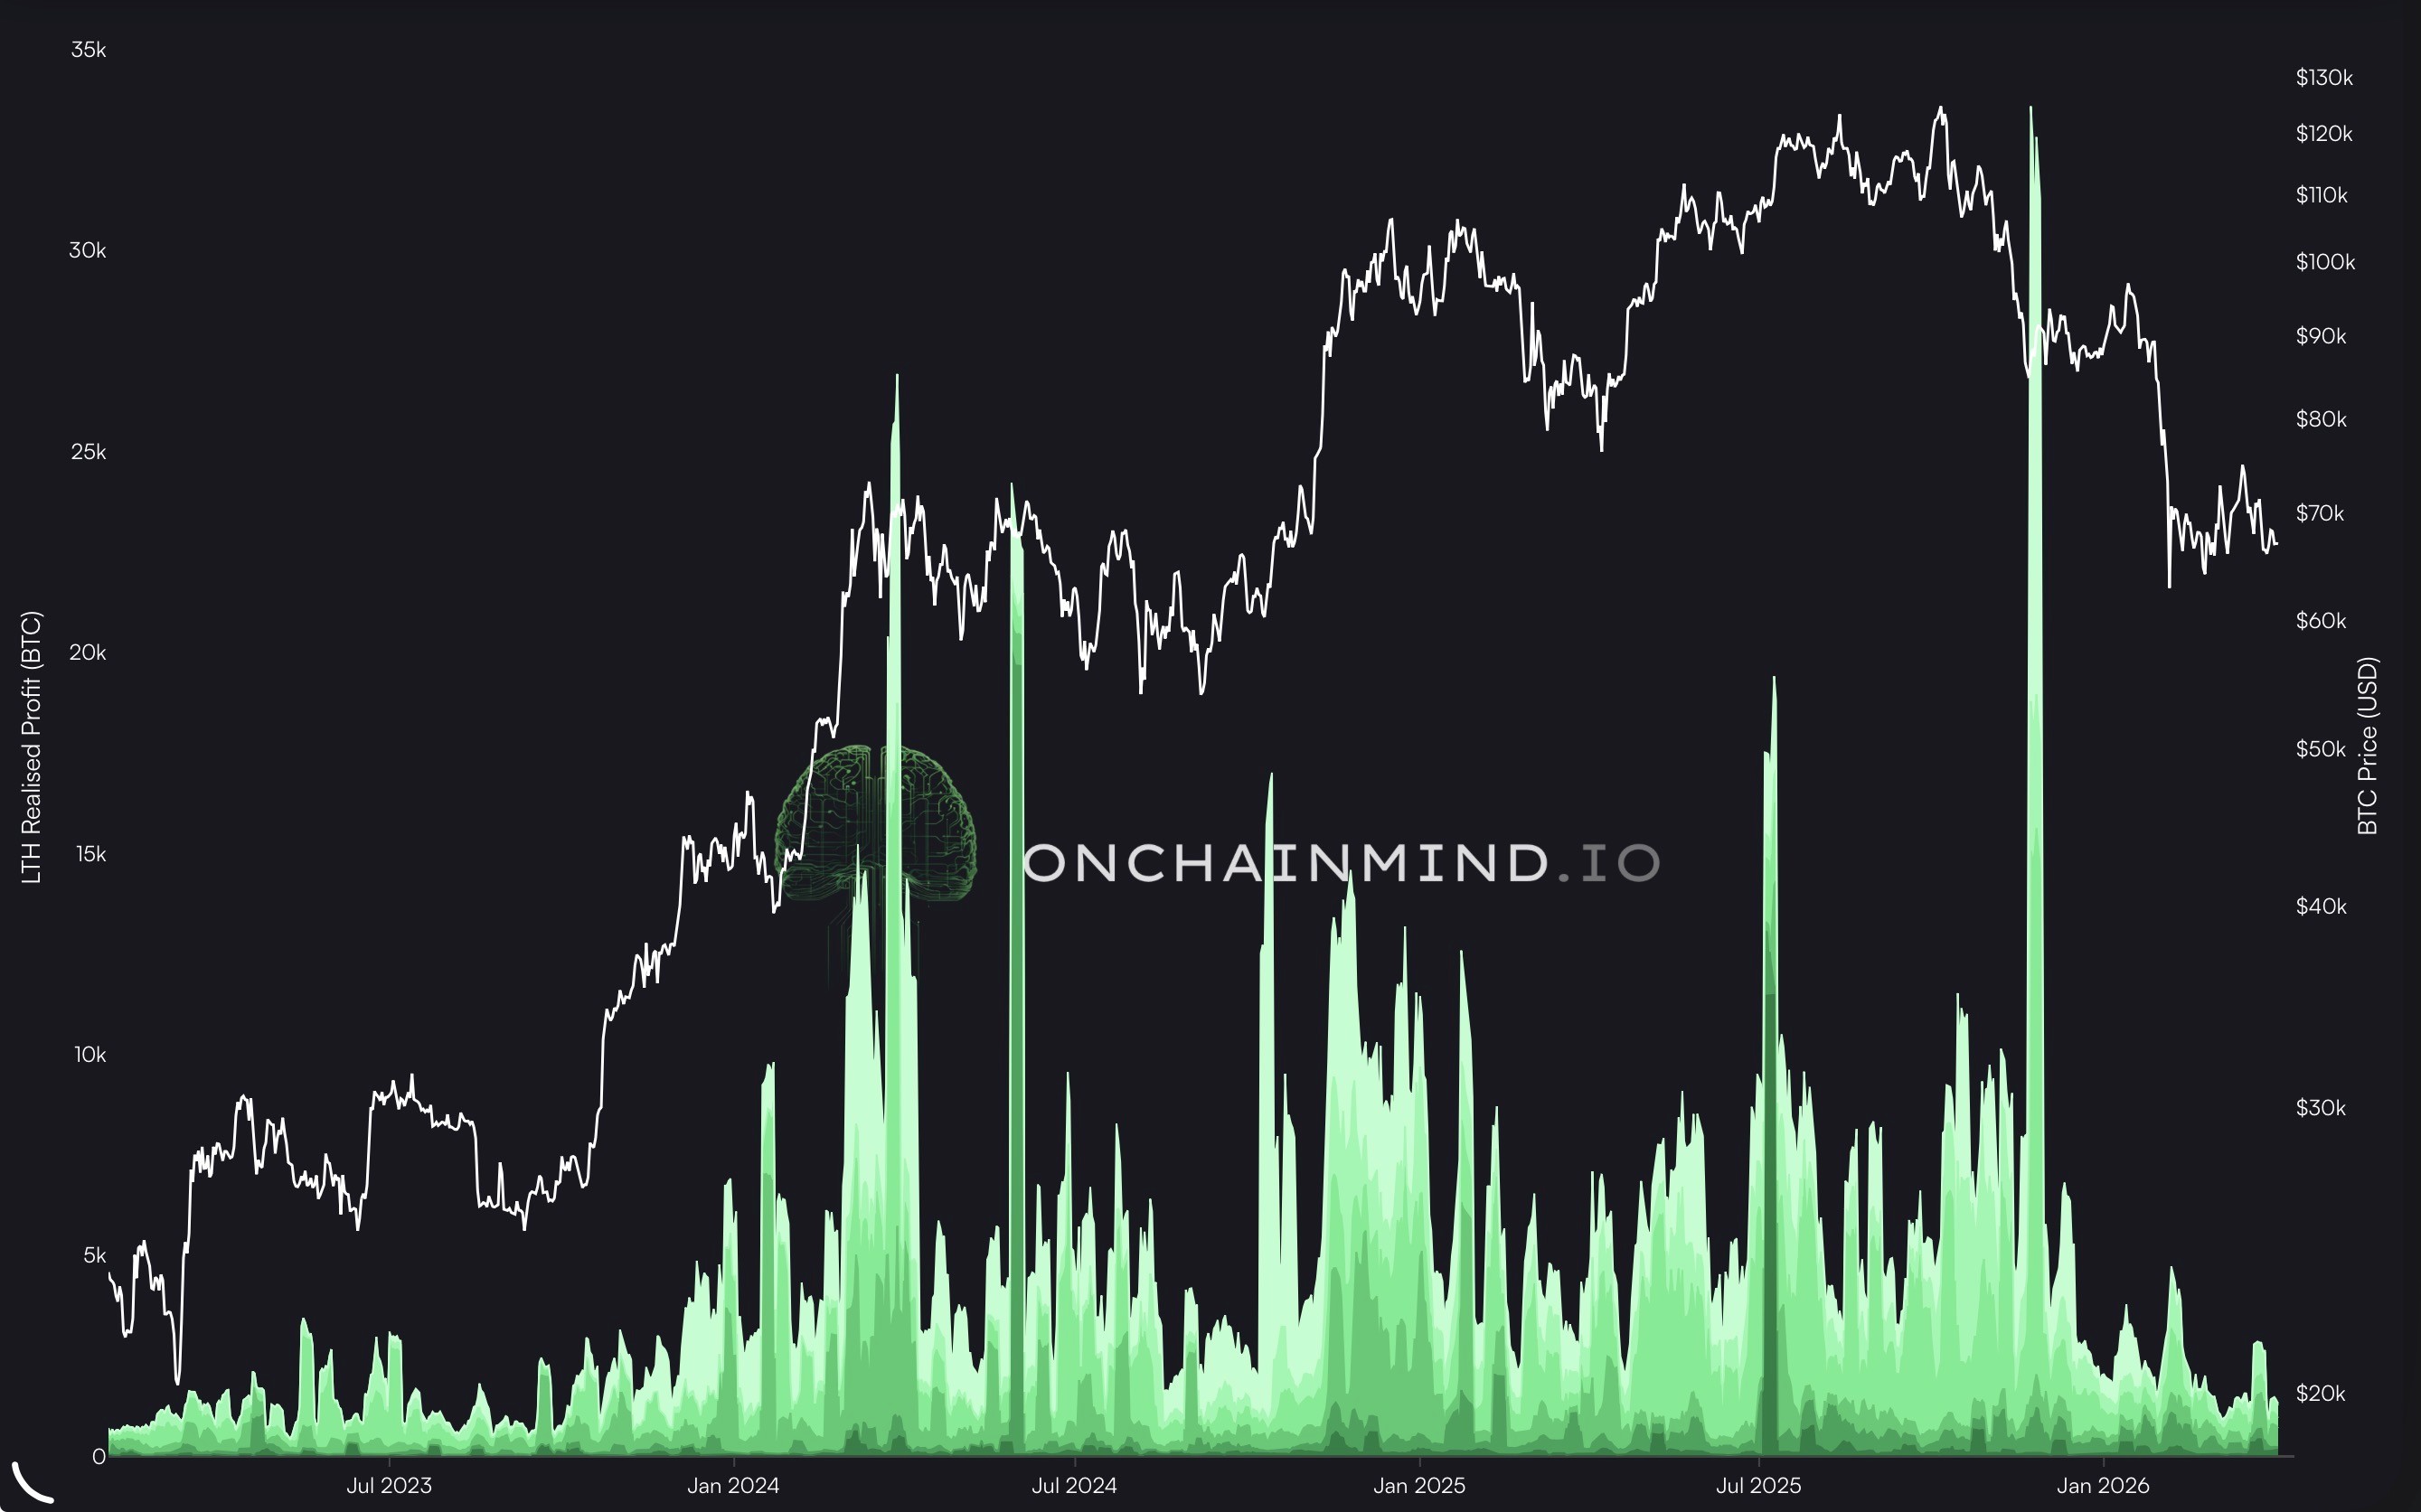
My Thoughts: At the moment, distribution across the network remains relatively controlled. We are simply not seeing the kind of aggressive long-term holder selling that we saw at this cycle’s top.
When we look at the various LTH cohorts, ranging from those holding for 155 days up to a decade, the amount of profit being realised is actually at some of the lowest levels we have recorded since the previous bear market. High-conviction investors appear perfectly content to sit on their hands rather than rushing for the exit.
Also, LTH supply as a percentage of the total supply has been rising again, moving from 70% to 74% since December. While this suggests a reduction in selling from older hands, it also reflects a significant number of top-buying Short-Term Holders from last year finally graduating into LTH status after 155 days.
This maturation of the holder base is a healthy structural shift, as it effectively builds a more robust floor of conviction beneath the current price action.
2. Are ETFs Masking True Market Weakness?
Question: Could ETF inflows be artificially supporting price and actually masking the underlying price weakness?
My Thoughts: They are definitely influencing the market structure, but I would not say they are masking weakness.
What the ETFs are actually doing is providing a consistent, programmatic bid. This naturally dampens downside volatility and fundamentally changes how our macro corrections unfold compared to previous cycles. To put this into perspective, we have only seen a 10% drawdown in cumulative ETF flows versus a much steeper 47% drawdown in the underlying spot price.
The data shows that the average ETF investor is actually holding up incredibly well. Their average cost basis is sitting around $82k, meaning they are only down roughly 19% in a market that has seen significant structural chop. They are simply not panic selling. Also, the ETF flow momentum is now turning positive again after registering its second-largest negative reading. This signals renewed institutional appetite, not an artificial propping up of a weak market.
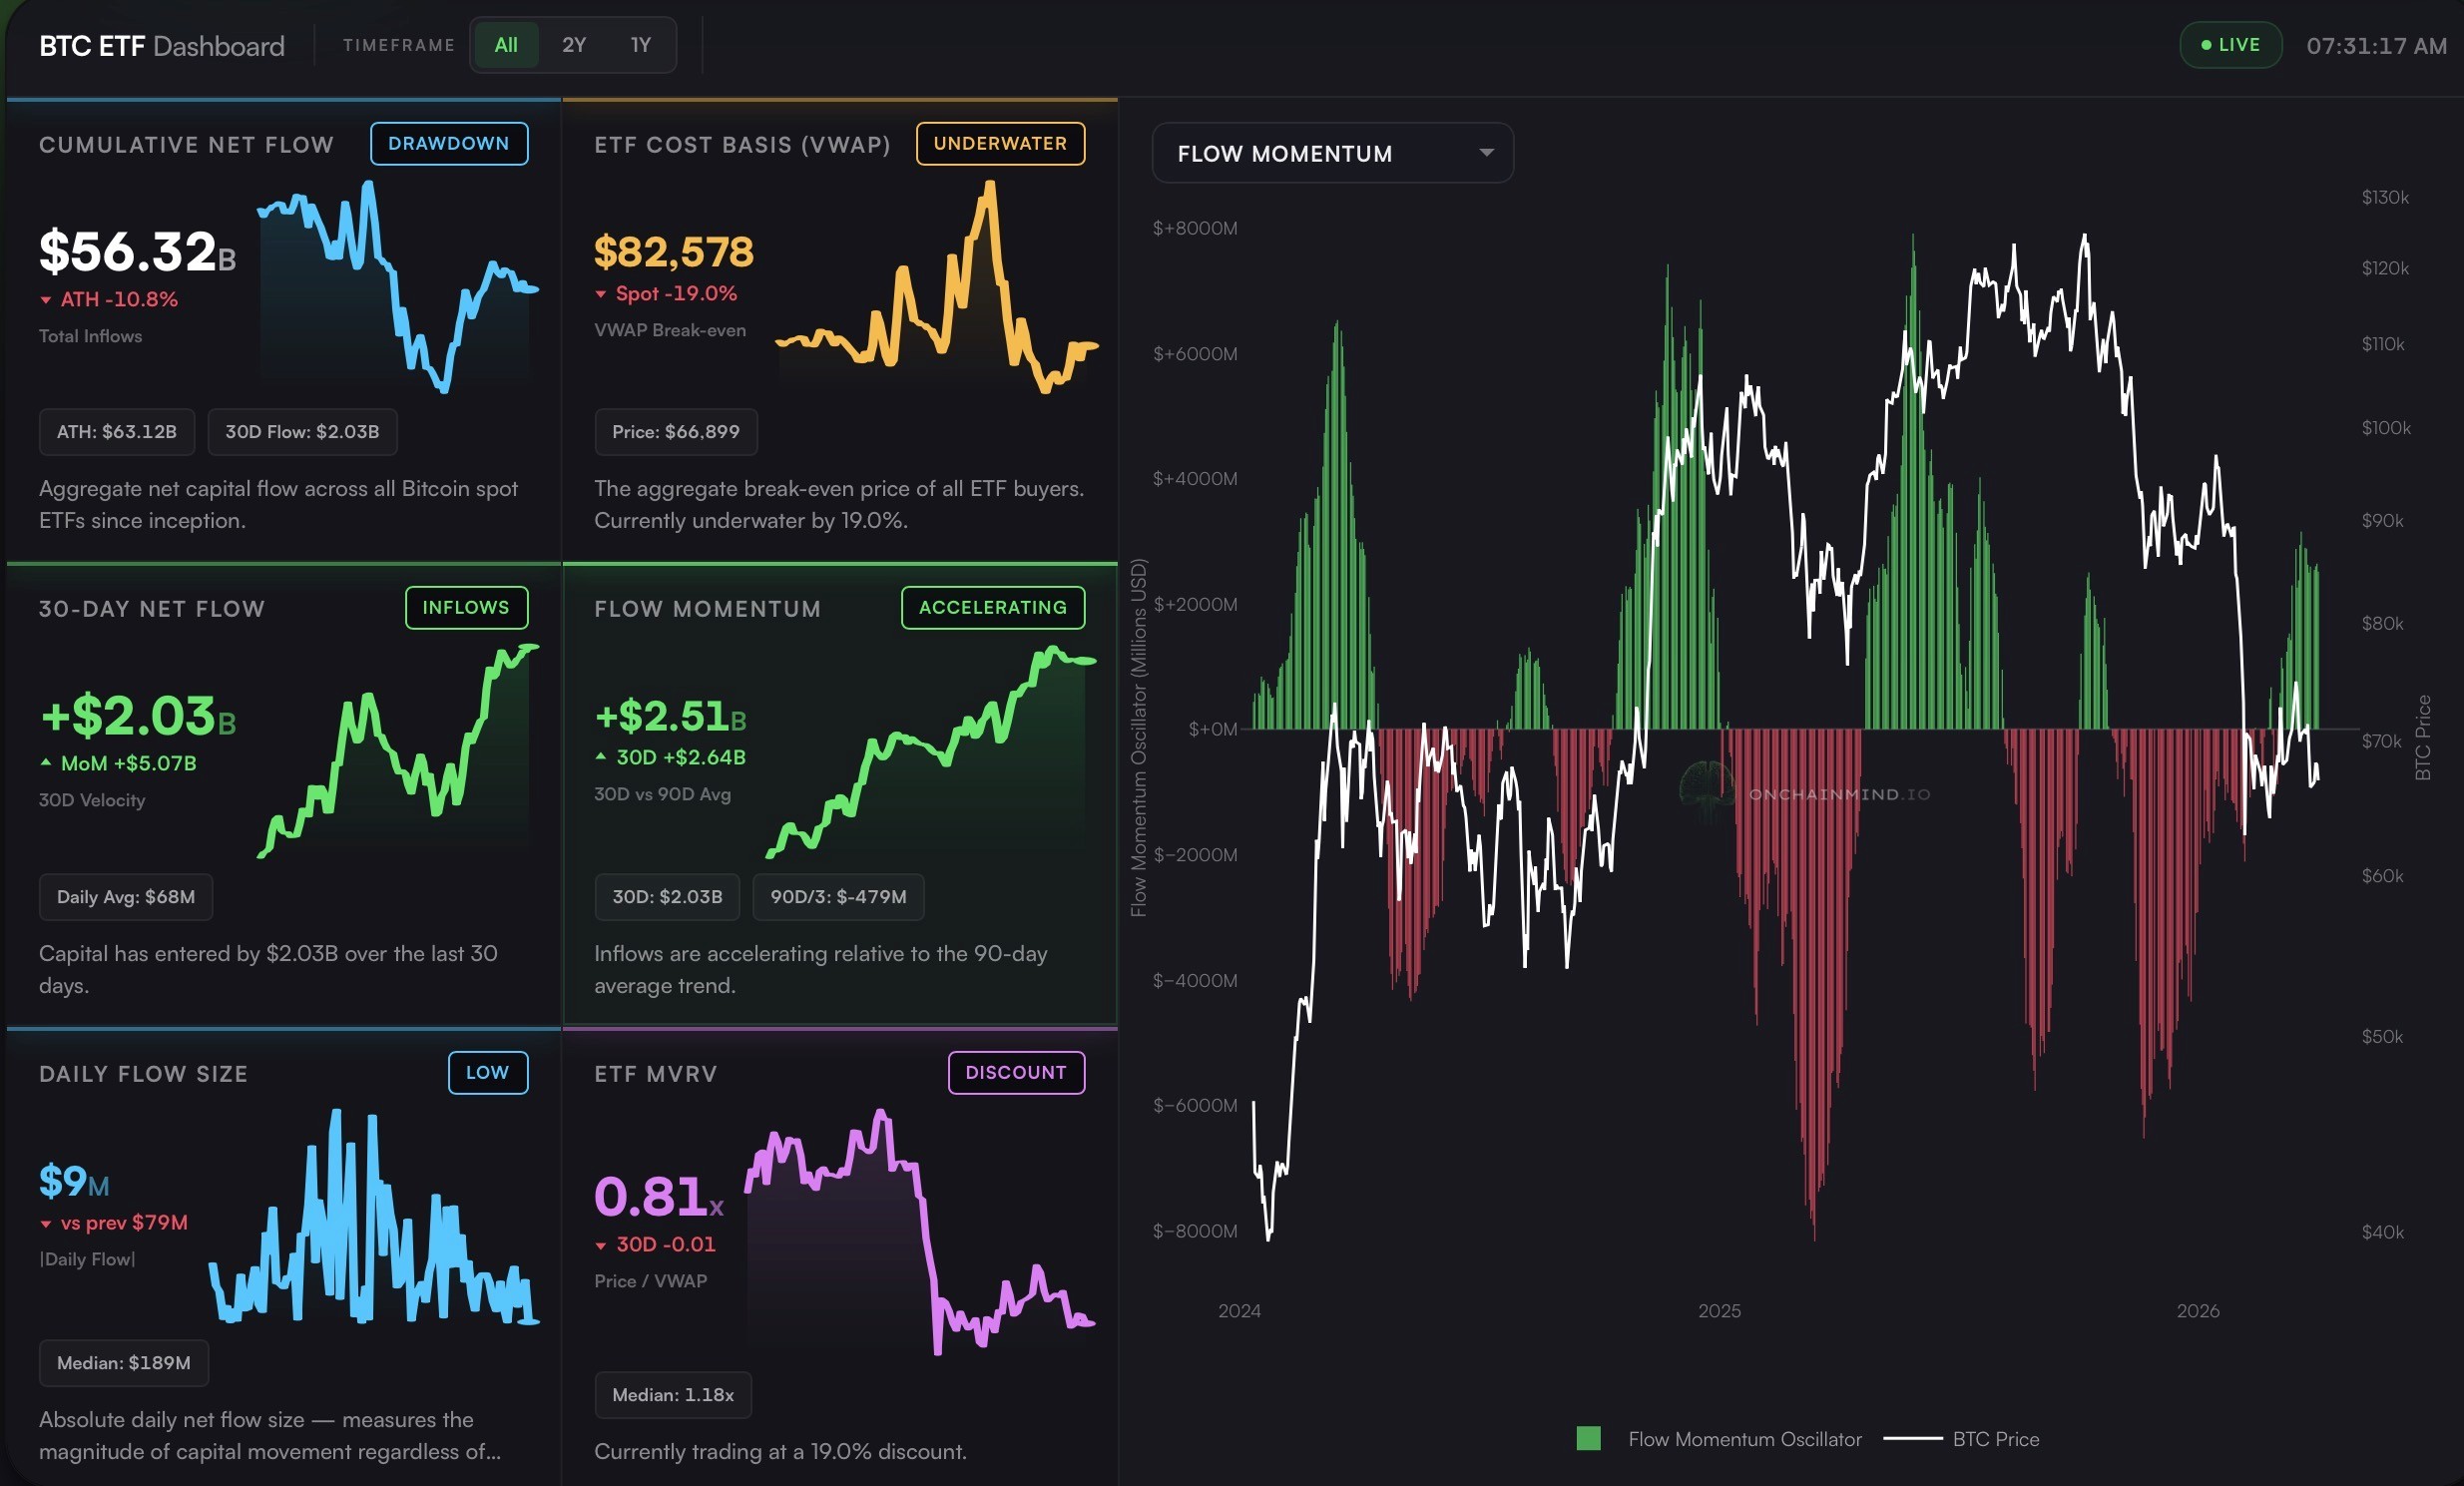
View live in OCM Studio: ETF Dashboard
3. Realised Price as the Ultimate Floor
Question: If we see a catastrophic macro event in 2026, could Bitcoin realistically fall back to its Realised Price?
Continue reading with OCM Premium
You have been reading the free preview of this article. The rest of it (about 1,300 more words and 3 more charts) is for OCM Premium members. See OCM Premium plans.