
This has been one of the more uncomfortable months we’ve had in a while. Bitcoin had a classic bear market rejection from its key pricing levels back down to around $73k, and the macro picture has flipped from “patiently waiting for easing” to a genuine risk-off oil shock out of the Strait of Hormuz. On top of all that, the Fed chair handover I wrote about in January has actually happened.
There’s a huge amount to unpack, and you’ve sent in some brilliant questions, so let’s get straight into it.
1. The Wall of Resistance Played Out. What Flips the Bias Now?
Question: You called the multi-layered wall of resistance perfectly. We rejected the confluence and we’re now eyeing new lows. So now that we’re below all three tiers, when does fading strength at resistance stop being the play and buying weakness at support take over? What actually flips your structural bias bullish?
My Thoughts: It played out almost exactly as the base case suggested, and the satisfying thing is that the framework is completely symmetrical, so it still tells us what to do from here.
On the way up, nothing has changed. The same tiers that capped us, mainly the STH Realised Price around $78k and the 200-day near $83k at the time, now form the ceiling on any bounce. My single, non-negotiable signal to flip structurally bullish remains unchanged: a clean reclaim and hold above the yearly moving average, with multiple daily closes proving acceptance. Until that happens, fading strength stays the higher-probability play, and new lows are entirely consistent with the bearish structure I laid out, not a violation of it.
So the honest answer is that we’re in the awkward middle right now, below resistance but above true support. That’s precisely the zone where I sit on my hands and let the market come to me at one of the two edges. See question 3 for exactly what I’m doing with my dry powder while we wait.
2. When Does “Sticky Capital” Stop Being Sticky?
Question: You’ve repeatedly called ETF money sticky capital. But at what point does sticky capital stop being sticky? What outflow pace would actually worry you?
My Thoughts: Fair challenge, and I want to be precise rather than defensive, because “sticky” has never meant “never sells”. It means outflows that stay small relative to the price stress being applied. So let’s look at the actual magnitude.
The 60-day net flow turning negative for the first time since 17th April, at roughly -$81 million, is, frankly, a rounding error in this context. And the holdings tell the real story: ETFs now hold around 1.31M BTC versus 1.38M BTC at the all-time high, a decline of only about 5% in BTC terms, while their share of total supply has barely budged from about 7% to 6.6%. That is an astonishingly shallow drawdown in holdings against a roughly 42% fall in spot. If this were tourist capital, we’d have seen a far larger unwind by now. This is the opposite.
What would genuinely worry me is not a single negative print, it’s a sustained acceleration: flows going deeply and persistently negative, especially if it happened while price was stable or recovering, because that would signal a loss of conviction rather than macro-driven de-risking. The plumbing cuts both ways. Strong demand mechanically sources real BTC, and heavy redemptions would mechanically sell it. But at this pace, the creation and redemption engine is barely ticking over. $81 million doesn’t break a thesis built on conviction. A multi-billion-dollar capitulation would, and we’re nowhere near that.
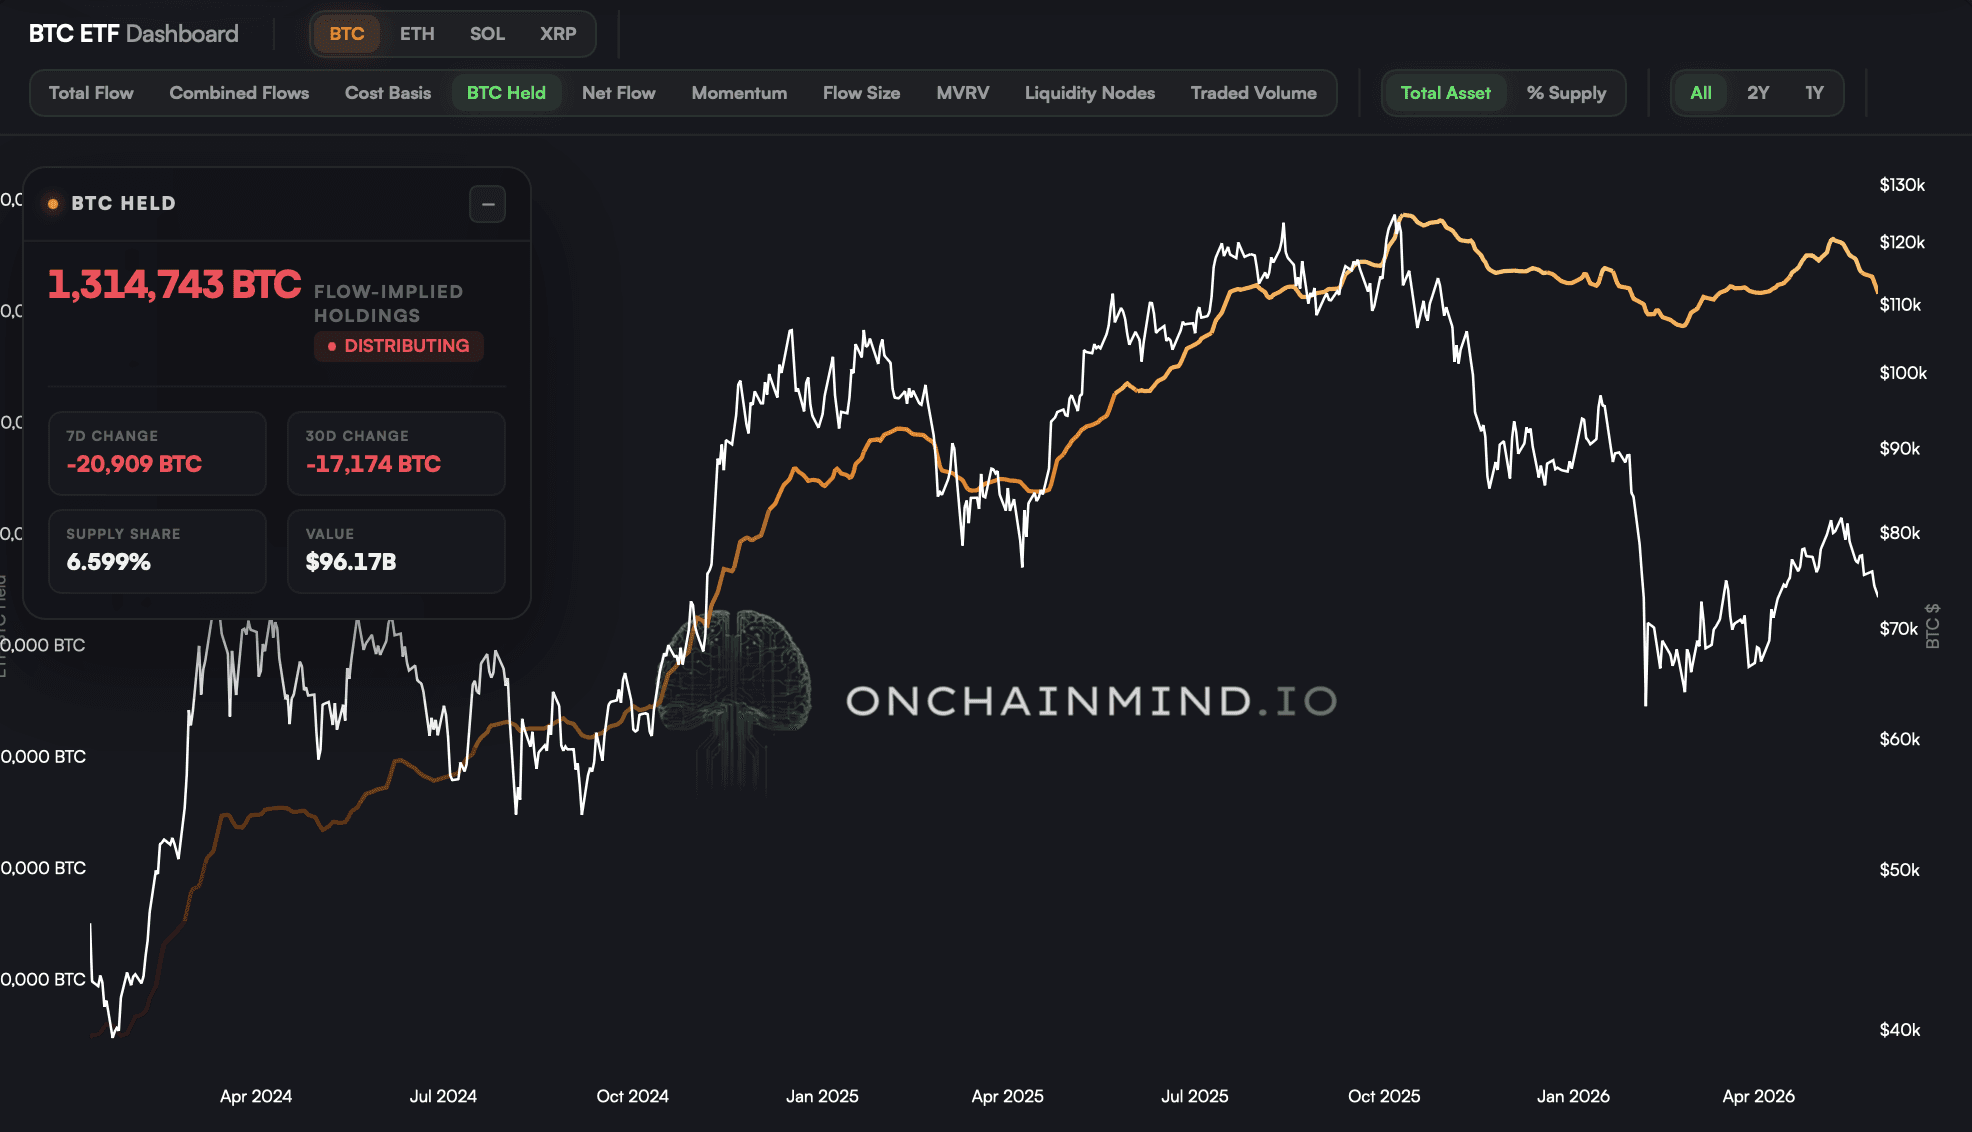
View live in OCM Studio: ETF Holdings
3. How Are You Actually Positioning Your Dry Powder Right Now?
Continue reading with OCM Premium
You have been reading the free preview of this article. The rest of it (about 1,800 more words and 3 more charts) is for OCM Premium members. See OCM Premium plans.