
Two things are true at the same time right now, and most people are only willing to hold one of those views.
The first is that Bitcoin’s structure is bearish, the recent bounce means almost nothing, and the path of least resistance points lower.
The second is that we have just entered the zone where on-chain data says systematic accumulation has historically been rewarded in every single cycle.
Today I want to walk you through what our Cost Bases Dashboard is showing, why two specific lines on it have called every bear market bottom in Bitcoin’s history, and how I’m personally framing the risk-reward from here.
Let’s get into it.
Key insights
The Three-Tier Battleground: Three key pricing levels are stacked above us right now, and reclaiming the first one is non-negotiable for any bullish thesis.
The Two Lines That Matter Most: The Investor Price and CVDD are the most powerful on-chain floor indicators, and the maths behind why is genuinely elegant.
The DCA Channel: A statistically grounded zone for accumulation that removes the need to time the exact bottom, and where we sit within it today.
The 23% Question: How much downside is actually on the table, and why the “we won’t revisit Realised Price” narrative deserves more scrutiny than it usually gets.
The Immediate Battleground
Let’s start with the simple, brutal picture. The easiest way to misread this market is to focus on the recent bounce and assume strength is returning.
It does not seem to be.
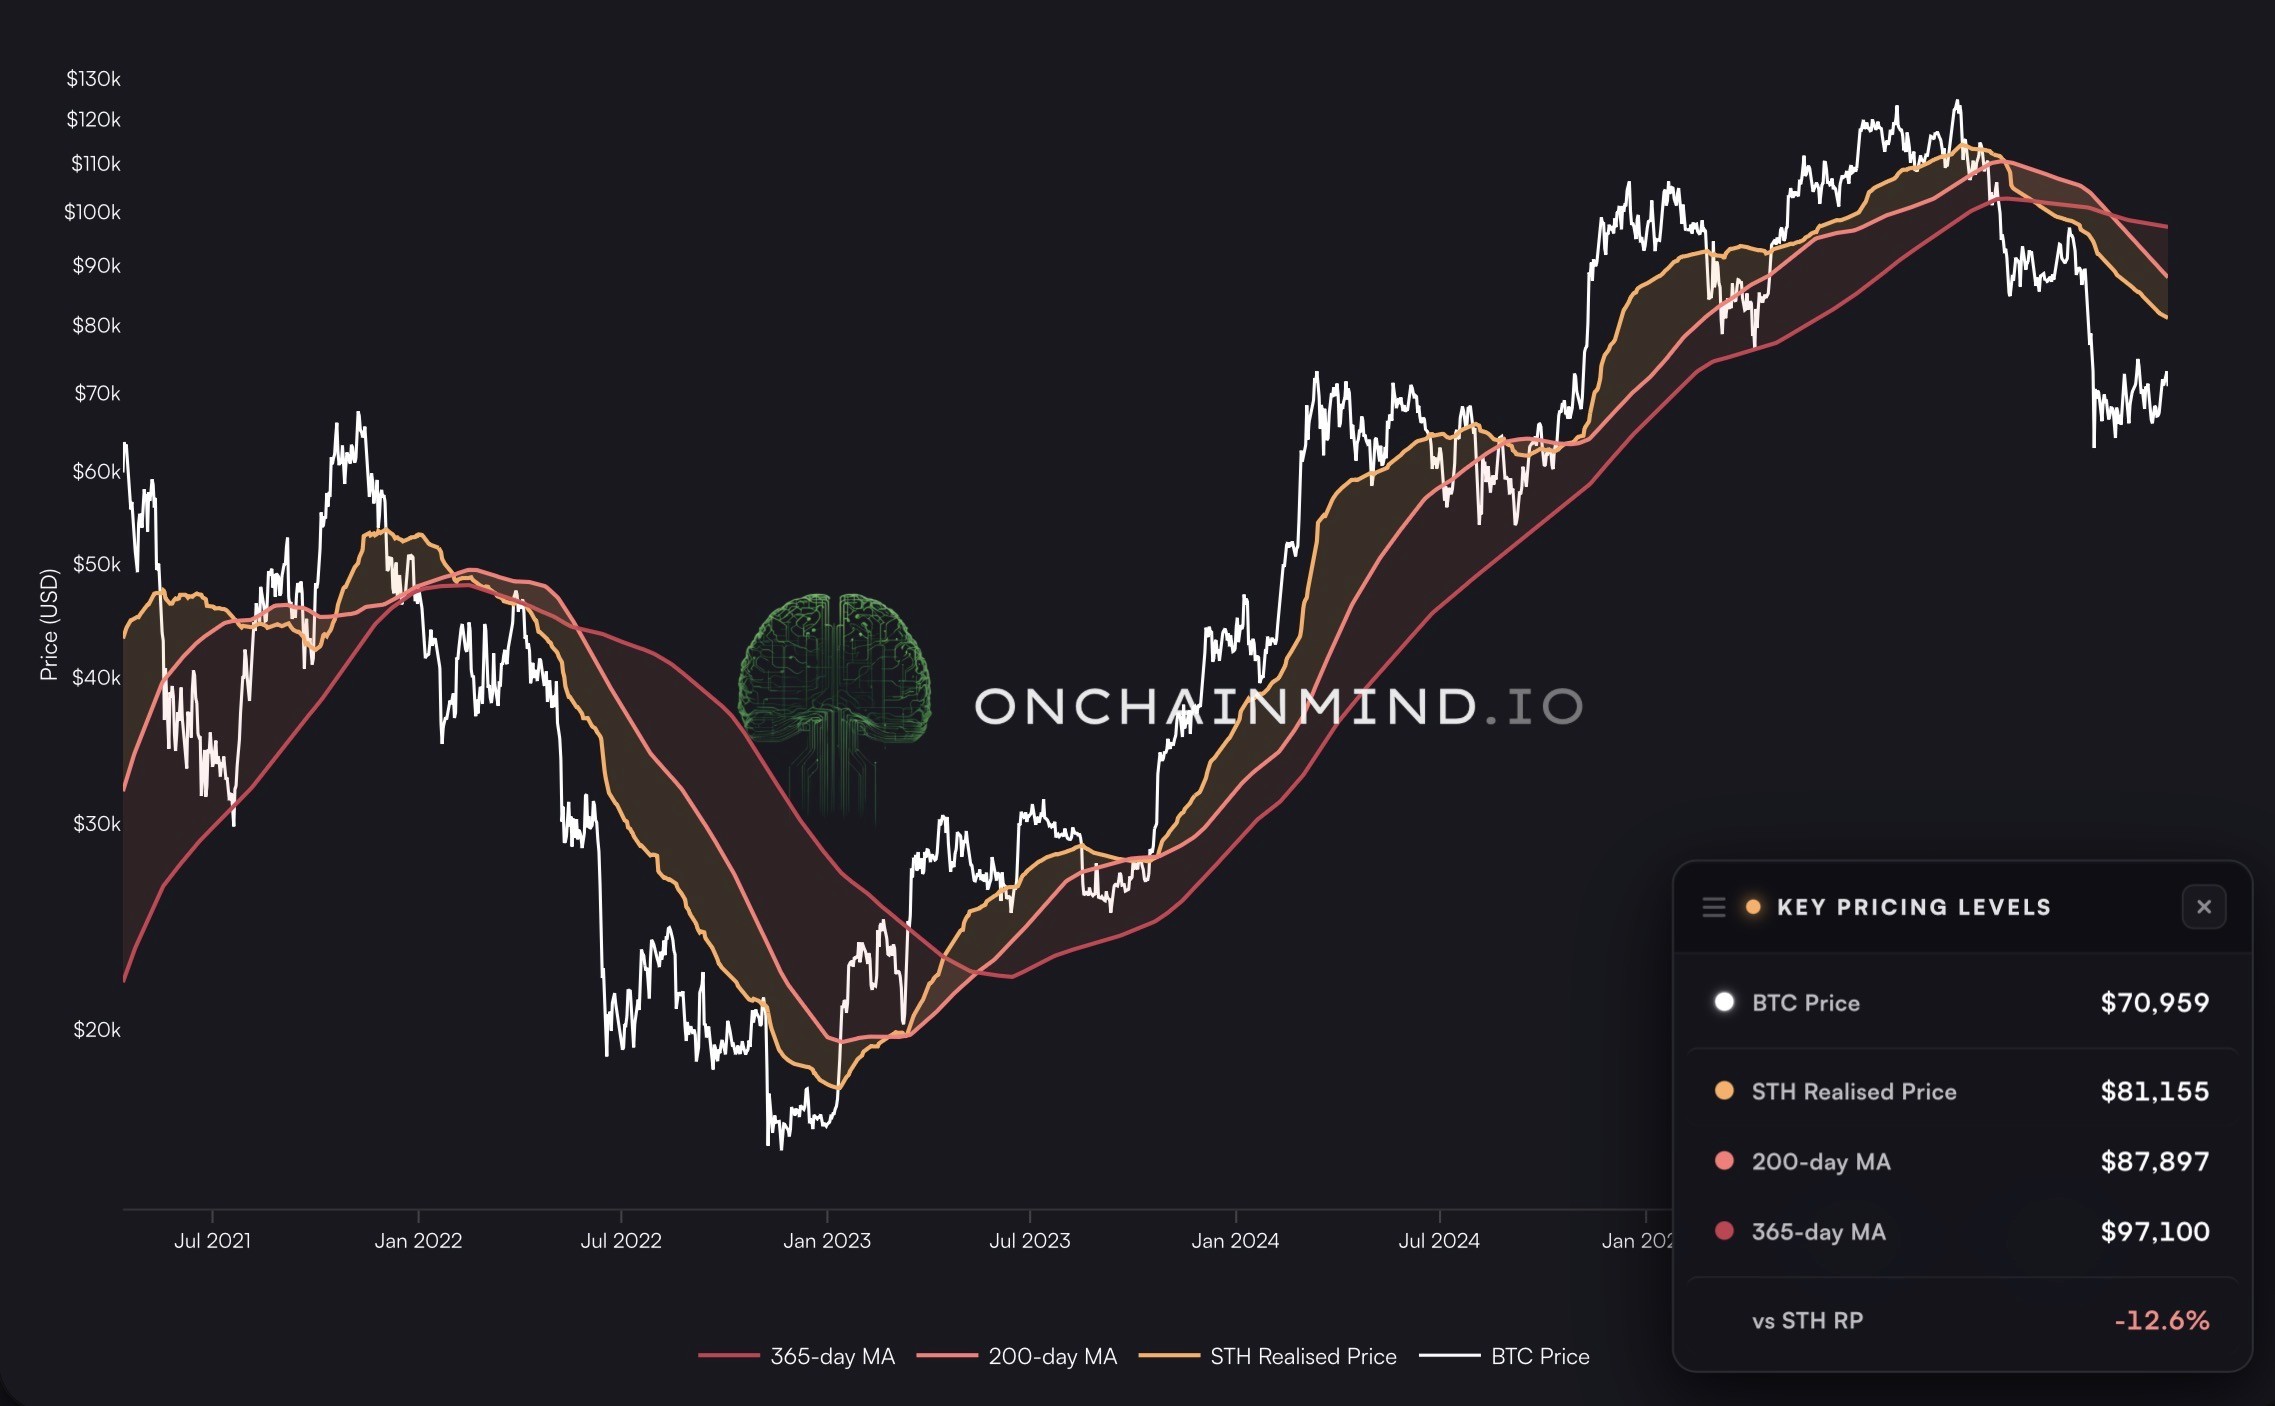
Looking at our Key Pricing Levels:
Short-Term Holder Realised Price: $81,000
200-day moving average: $87,000
365-day moving average: $97,000
Together they form a regime filter. Above all three, the path of least resistance is up. Below all three, the path of least resistance is down. There’s nothing more to it than that, and yet very few people actually respect what the chart is saying when it stacks against them.
And right now, we are still below all of them.
The recent bounce has been encouraging in tone but completely meaningless in structure. We are still 12.6% beneath the STH Realised Price, which is the first and most important battleground the bulls have to reclaim before any rally has earned the right to be taken seriously.
When price trades well below it, the majority of that cohort is in unrealised loss, and historically that is the condition under which downside accelerates rather than resolves. Reclaiming the STH RP doesn’t guarantee a new uptrend, but losing it almost always guarantees more pain.
Until price reclaims that level and holds above it, any rally should be treated with caution. We are likely not seeing strength. We are seeing temporary relief within a broader weak structure, until proven otherwise.
View live in OCM Studio: Key Pricing Levels
The Two Lines That Matter Most
While our Key Pricing Levels tell us the immediate direction, the long-term cost bases tell you where the market is likely to end up when the selling is done.
Among all the available on-chain metrics, two stand out consistently when identifying macro bottoms: the Investor Price and CVDD.
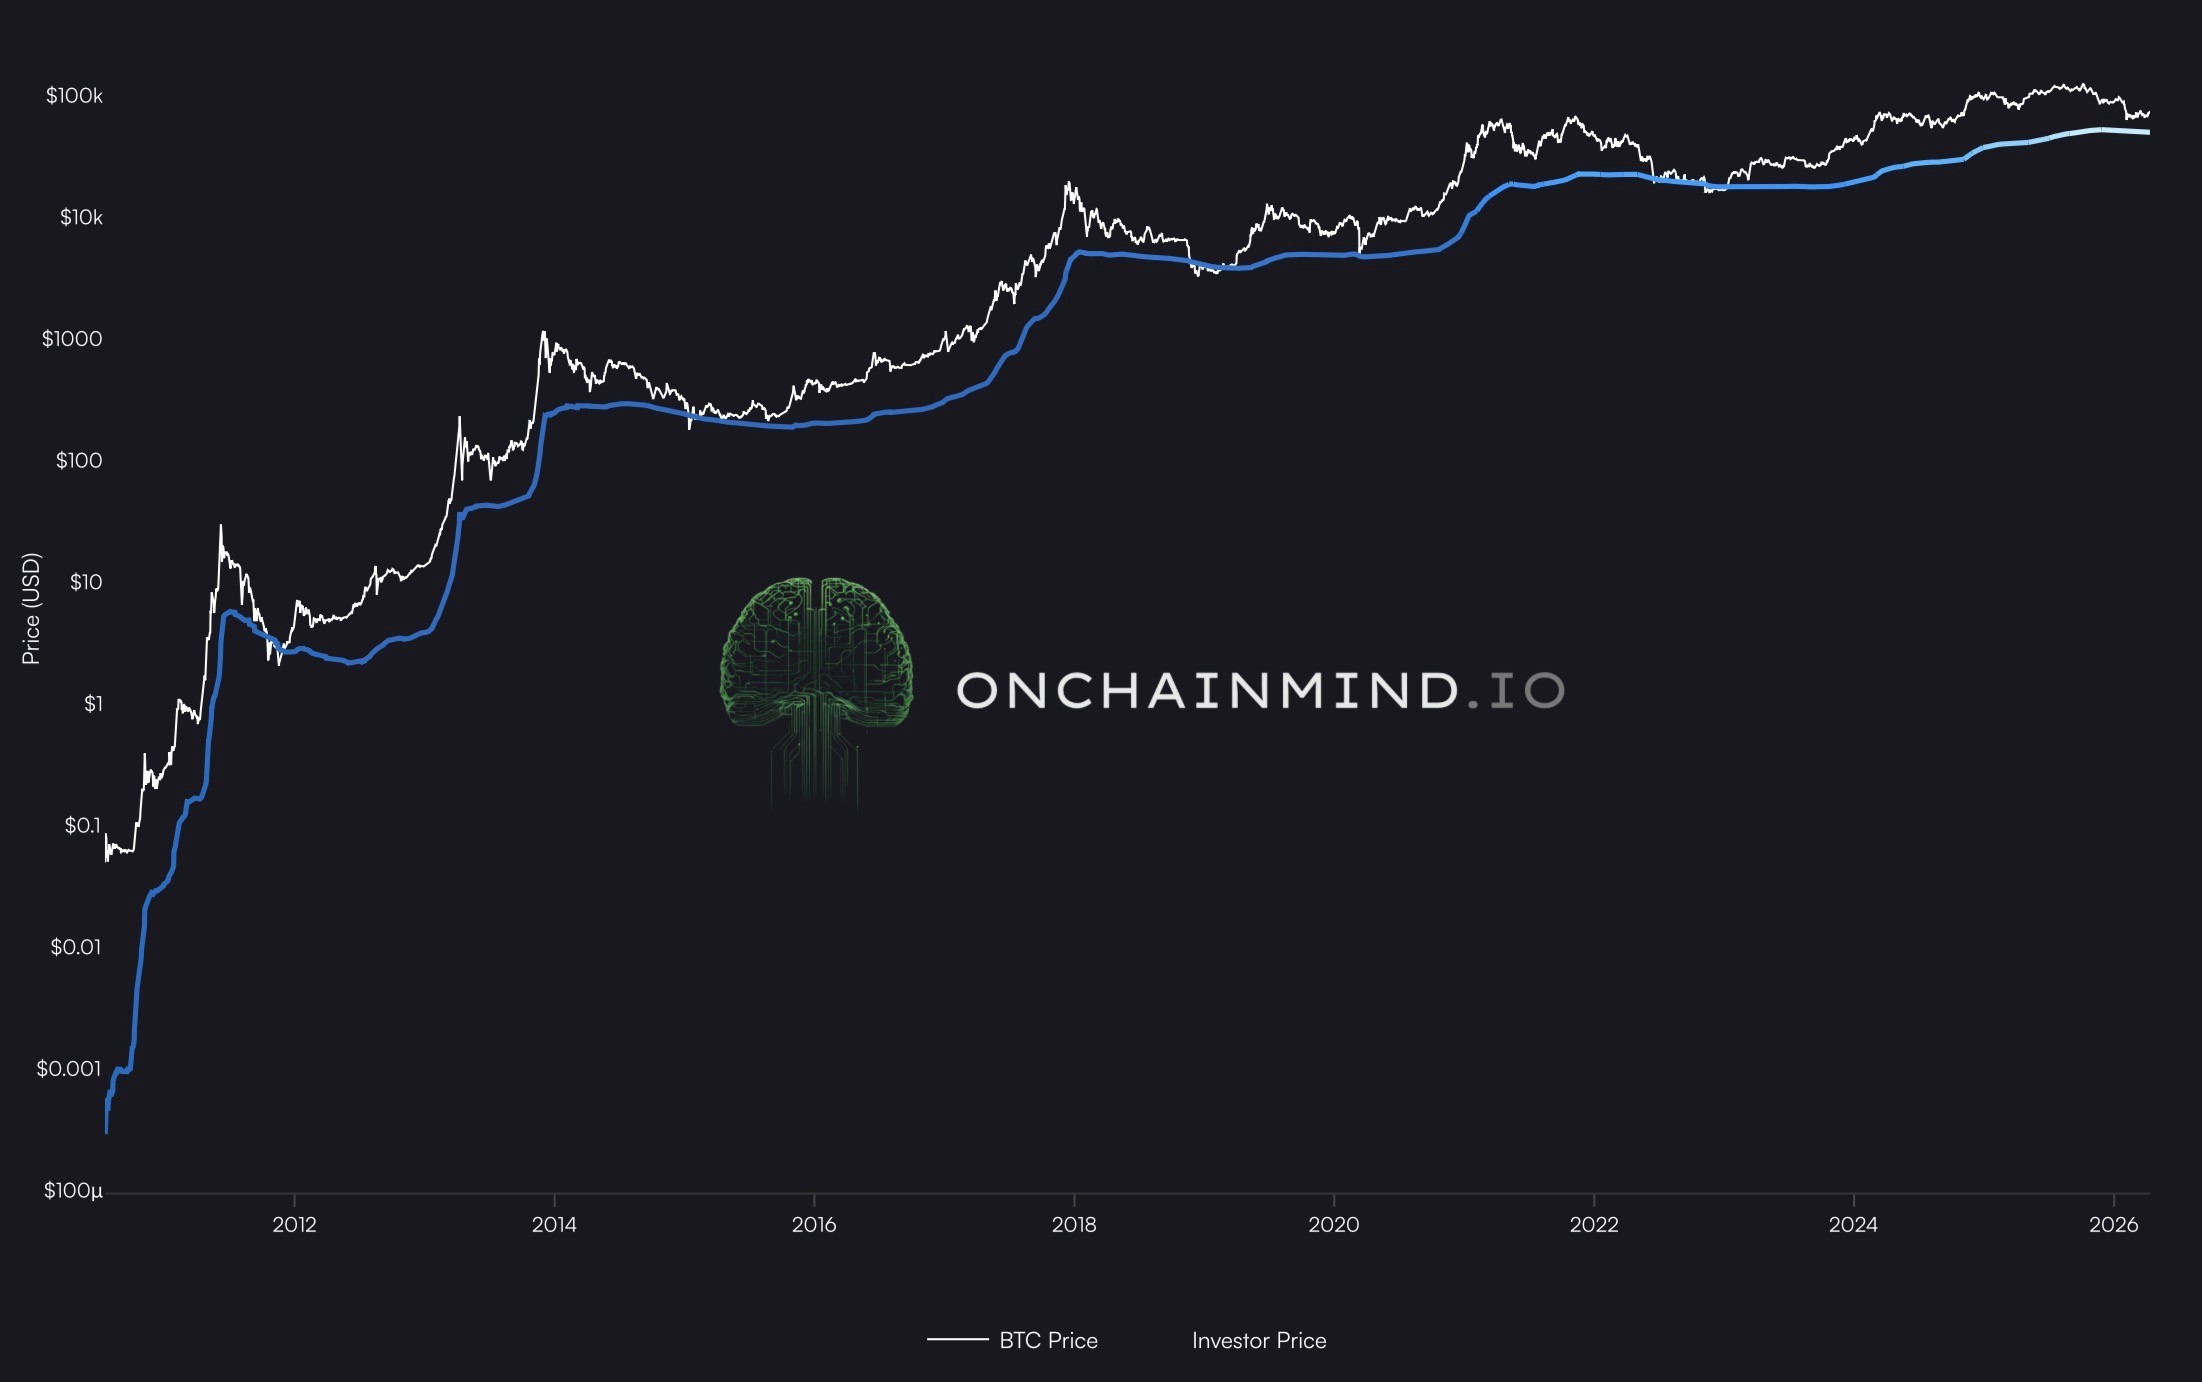
The Investor Price is constructed by stripping miner-issued supply out of the Realised Price calculation. The Realised Price values every coin at the price it last moved on-chain, which gives you the aggregate cost basis of the entire market.
The Investor Price asks a sharper question: what is the cost basis of the non-mined float, the coins held by people who chose to buy, rather than coins that were issued as block rewards?
By removing miner subsidy from the equation, you isolate the cost basis of conviction holders. This matters because miners are forced sellers by economic necessity; investors are not.
The Investor Price therefore tracks the true psychological floor of the market participants who actually allocated capital to acquire their coins.
It currently sits at $49,700, having declined from around $52,000 since November. For context, at the previous cycle bottom it was at $17,900, and price bottomed remarkably close to it.
That historical proximity is the entire point. The Investor Price has tagged or come within touching distance of the cycle low in every major drawdown. It is one of the most reliable structural levels on-chain.
View live in OCM Studio: Investor Price
The CVDD (Cumulative Value Days Destroyed) metric takes this one step further.
While the Investor Price tells you where capital is sitting, the CVDD tells you when long-term holders have effectively completed their distribution. It is built on the Value Days Destroyed concept, which tracks the economic weight of coins being spent relative to how long they have been held.
When coins that have been dormant for long periods finally move, it signals meaningful behaviour. The CVDD takes the value of every coin moved, weighted by how long it had been held and divides the cumulative sum by the number of days since genesis, then scales it by a constant.
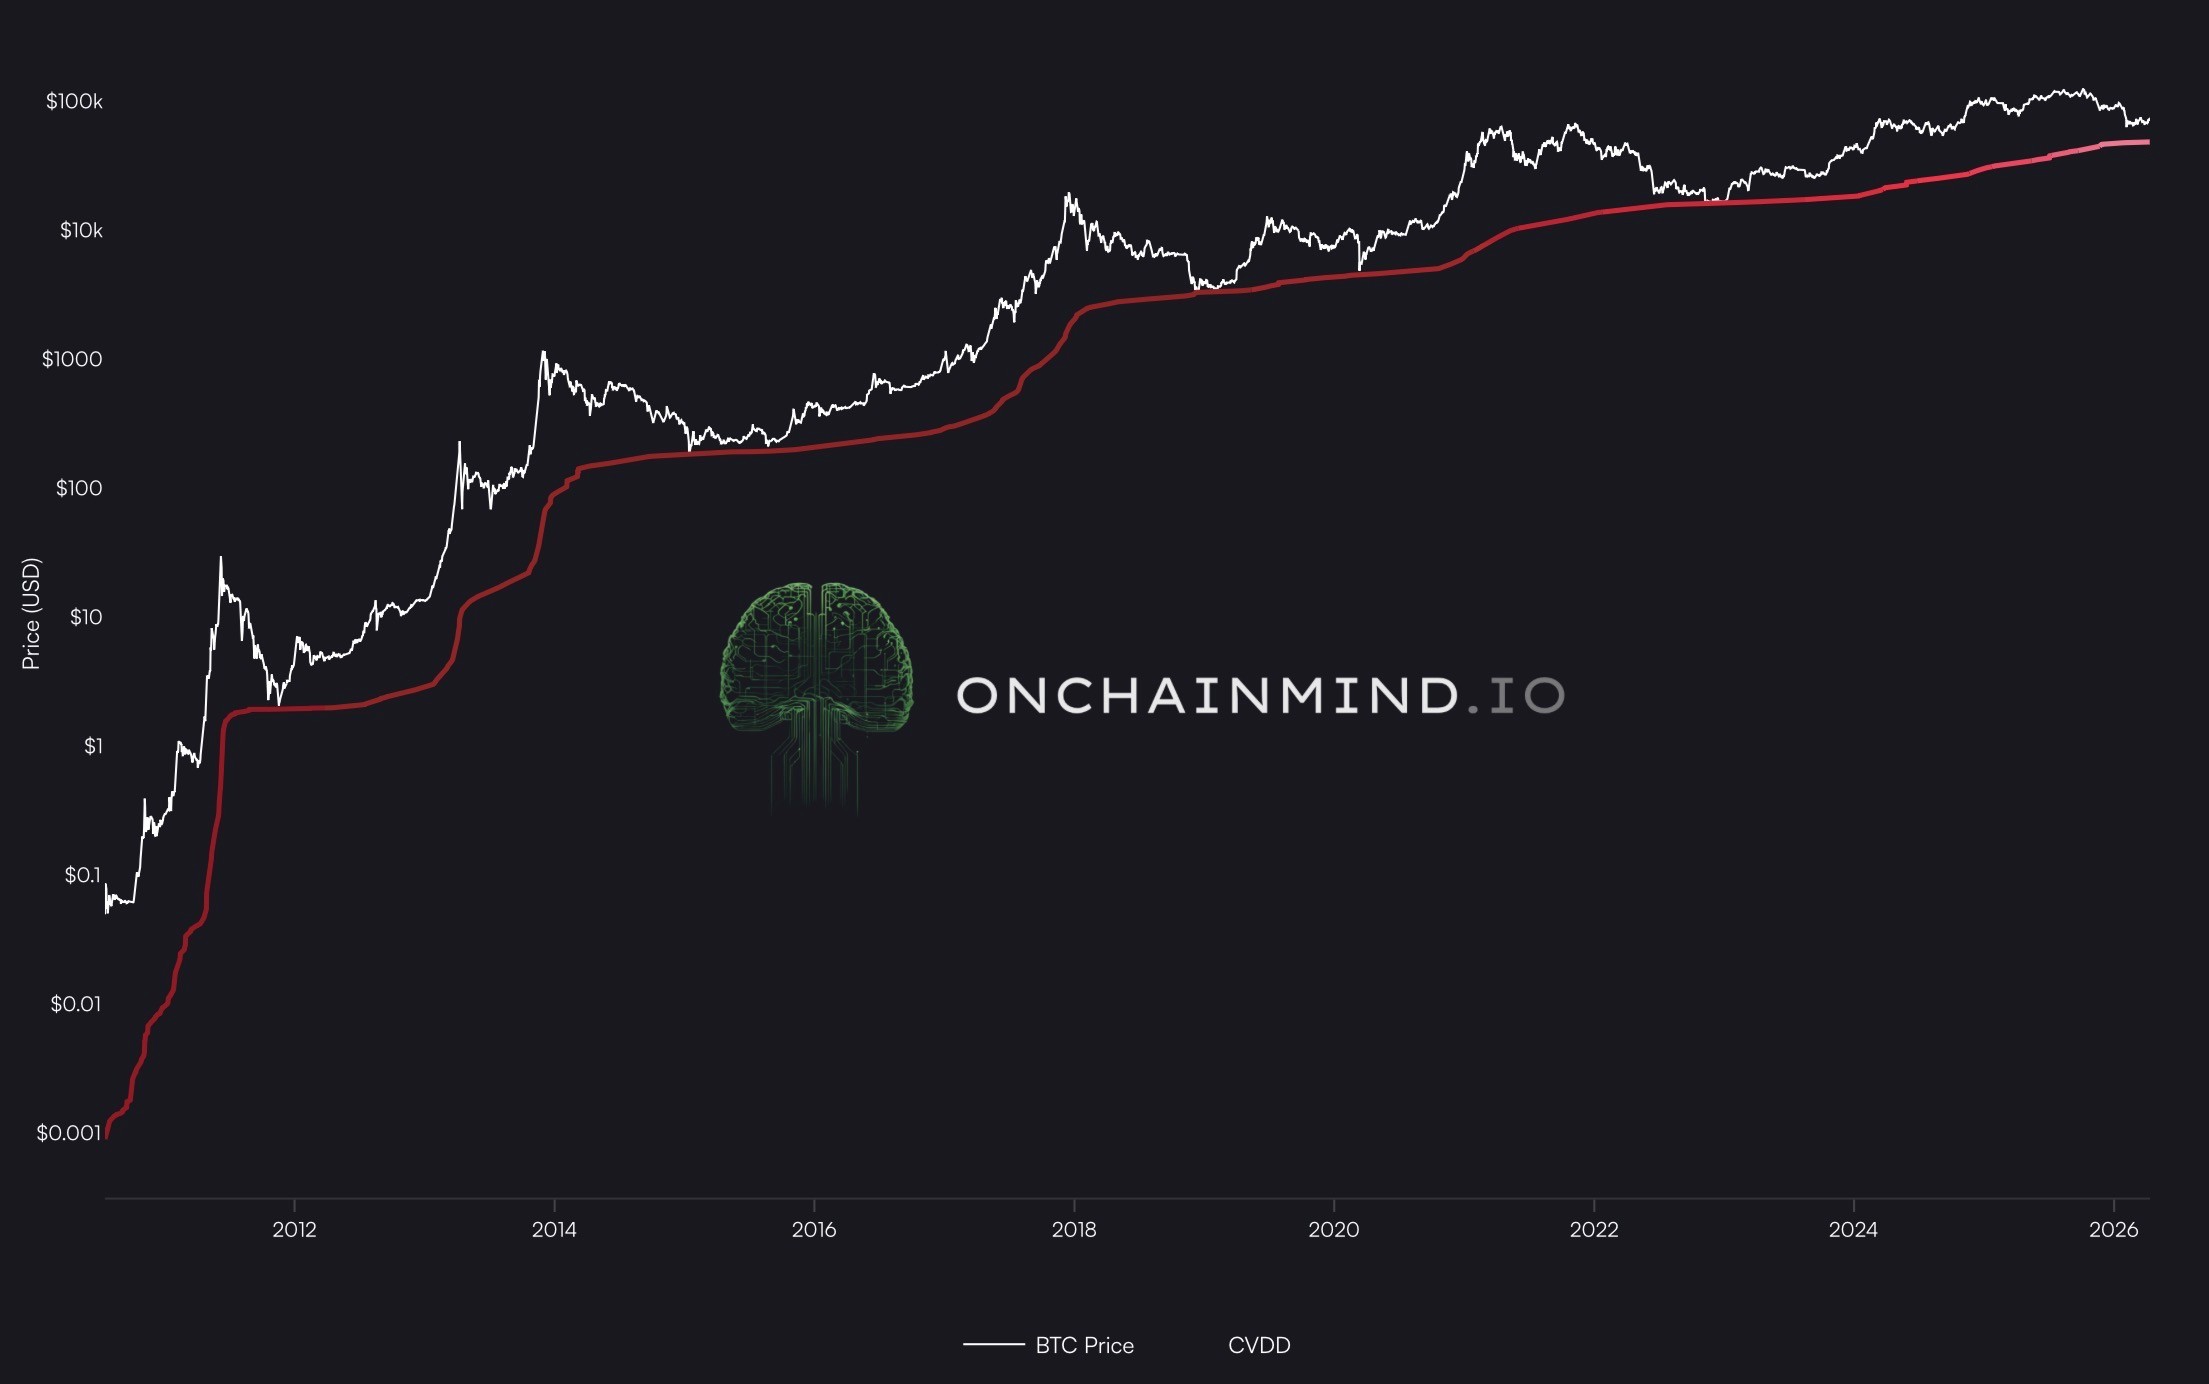
What you end up with is a slow-moving line that captures the long-term economic floor of the network, the price at which long-held coins, on aggregate, have been transacted across Bitcoin’s entire history.
It rises monotonically and very slowly, which is precisely why it works as a floor: it cannot be deformed by short-term volatility or sentiment, only by the genuine destruction of long-held value.
That is why it has been so accurate. And it has, without exaggeration, been the most accurate bottom-caller in Bitcoin’s history, including the COVID crash to almost the dollar.
It currently sits at $48,100. Buying anywhere near the CVDD is, historically, golden. There has never been a sustained period in Bitcoin’s history where price has remained below it for long.
So if price ever meets the CVDD again, consider it a generational buying opportunity.
View live in OCM Studio: Cumulative Value Days Destroyed
The DCA Channel: A Better Way to Play It
Trying to buy the exact bottom is one of the fastest ways to underperform.
Even if you get it right once, it is not a repeatable strategy. The better approach is to identify zones where the balance of risk and reward is consistently favourable and operate within them.
This is the thinking behind the DCA Channel.
Continue reading with OCM Premium
You have been reading the free preview of this article. The rest of it (about 500 more words and 1 more chart) is for OCM Premium members. See OCM Premium plans.