
Bitcoin isn’t following the script most people expect. If you’re still banking on the classic 4-year cycle to deliver a 2025 top, you could be stuck reading from the old playbook.
The reality is: this cycle appears to be stretching longer than historical patterns suggest, and the most explosive phases may still be ahead of us.
In this article, I’m exploring why the traditional 4-year cycle may be obsolete, projecting potential dates and price targets for this bull market peak, and explaining how market psychology interacts with these extended cycles.
Key insights
The Classic Cycle Is Shifting: Bitcoin’s historical 4-year pattern no longer aligns with current price action, suggesting longer cycles ahead of us.
Linear vs. Quadratic Modelling: Different ways of projecting the next peak produce varying dates and price ranges, offering a conservative vs. aggressive outlook.
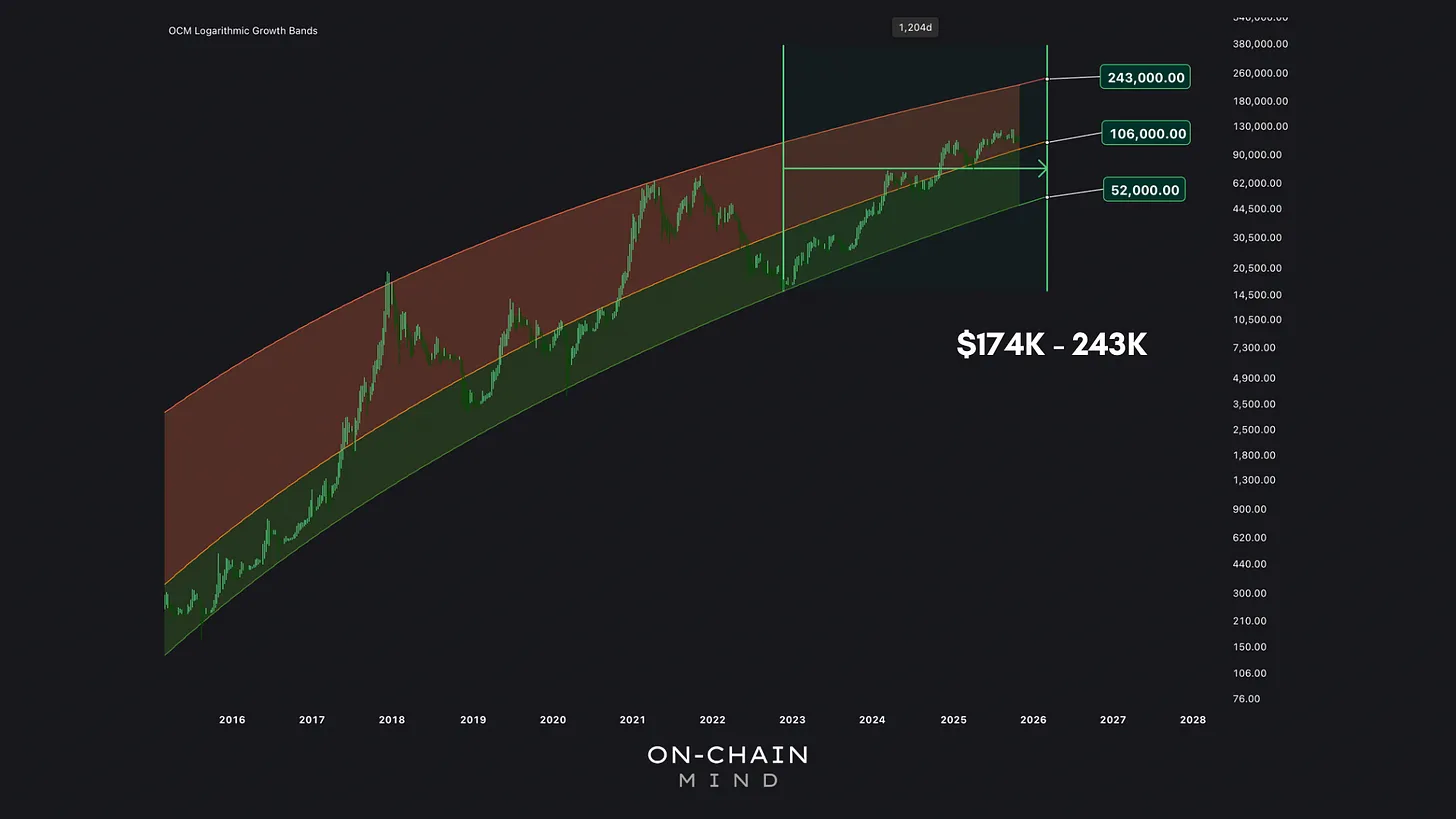
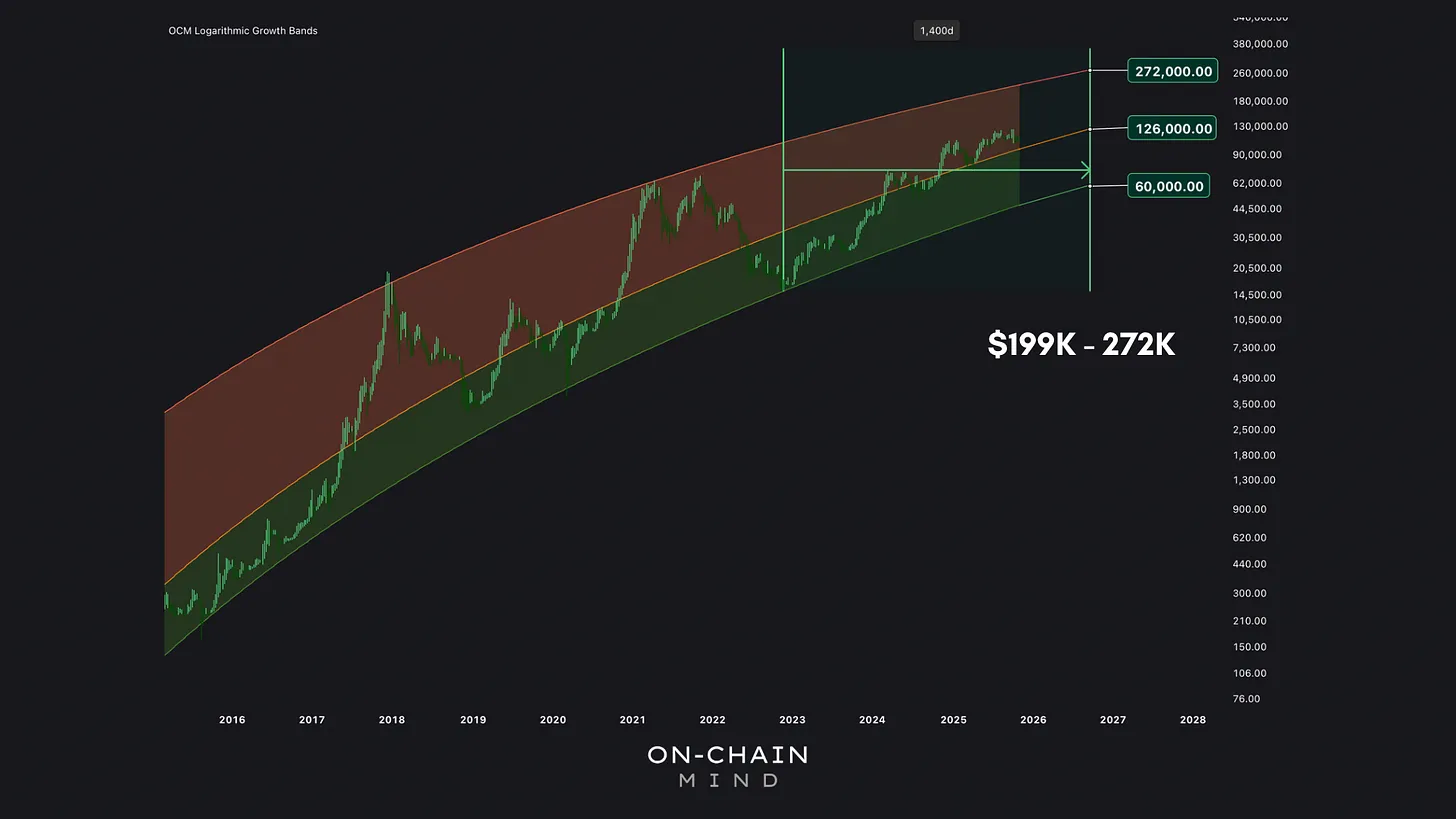
Price Projections: Linear models forecast peaks between $174,000 and $243,000; quadratic ones up to $272,000 in an extended, euphoric scenario.
Psychological Shift: Longer cycles build investor conviction, increasing chances of a dramatic blow-off top as patience erodes.
Rethinking the 4-Year Cycle
For years, the Bitcoin community has clung to the idea of a neat 4-year cycle, often tied to halving events that slash mining rewards and theoretically spark scarcity-driven rallies.
It’s a comforting narrative, sure. Every 4 years, like clockwork, we gear up for a bull run, peak, and inevitable correction. But as someone who’s spent many years now poring over charts and on-chain data, I can tell you this: the market doesn’t care about our tidy theories. It’s evolving, heavily influenced by institutions and global liquidity flows that weren’t factors in Bitcoin’s early days.
To understand why I believe the classic cycle is fading, we need to step back and examine how cycles are defined. And there’s actually never been a universal agreement on how to measure a “cycle”:
Some track from peak to peak.
Others prefer bottom to bottom.
Halving events are also popular reference points.
Some focus on macroeconomic or liquidity cycles.
I’ve opted for a more comprehensive framework that combines the best elements of these approaches: measuring a cycle from bear market low to bull market peak.
In my view, this method gives the clearest perspective of the full emotional journey of a Bitcoin cycle.
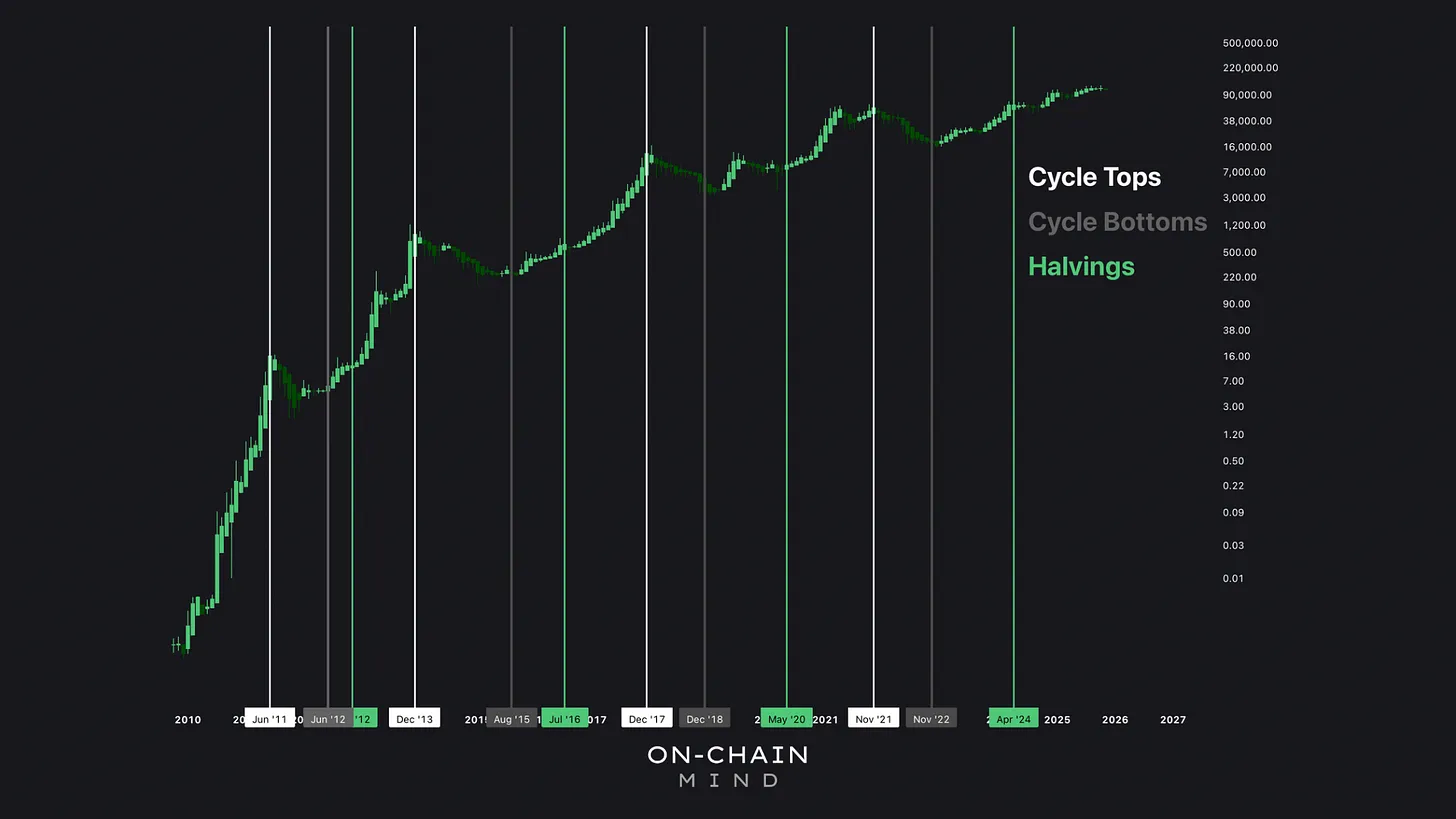
The Ongoing Cycle Expansion
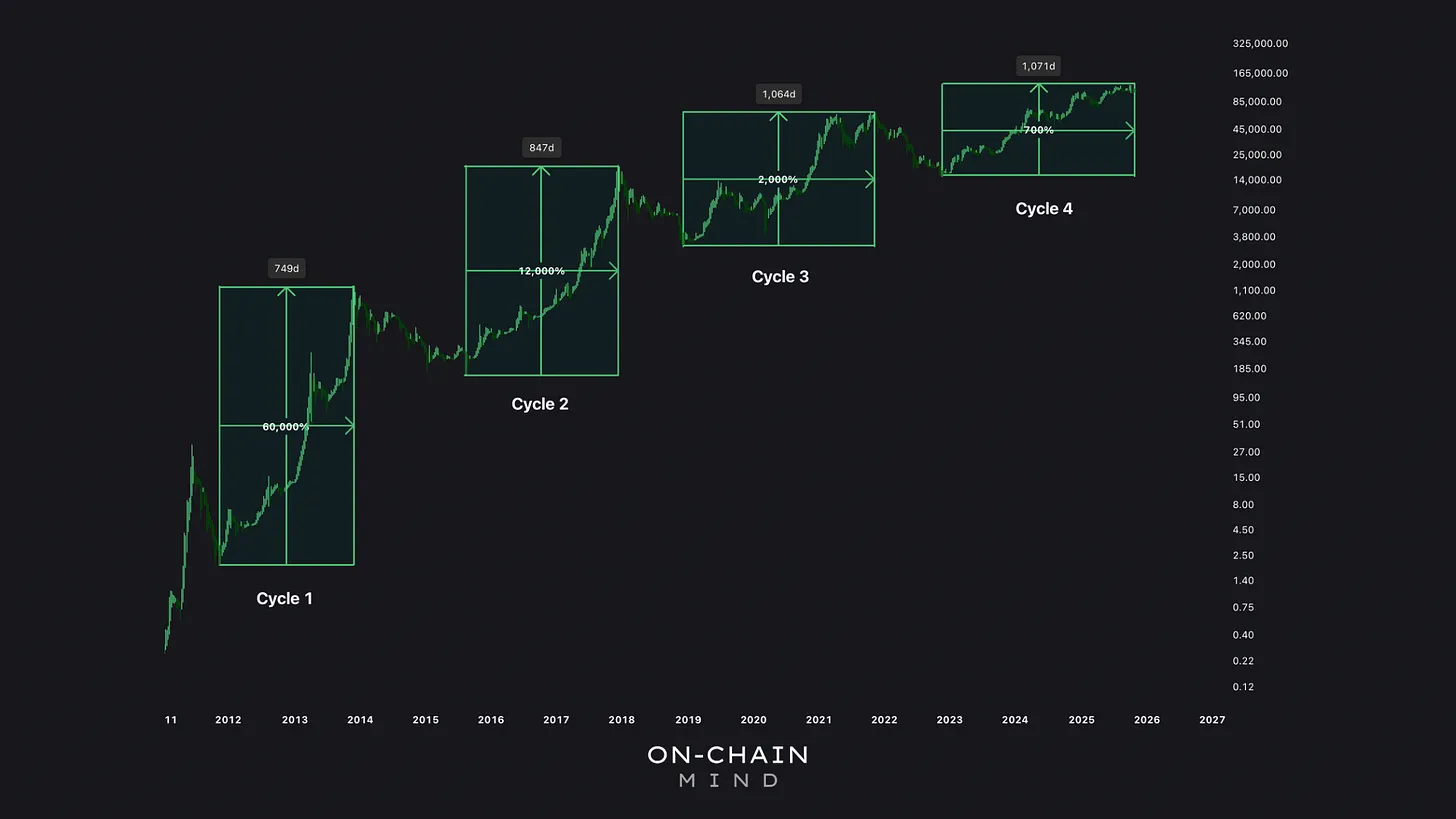
Looking at historical Bitcoin cycles through this lens reveals a striking pattern: each cycle has been gradually lengthening.
Cycle 1: Duration – 749 days; Price increase – 60,000%
Cycle 2: Duration – 847 days; Price increase – 12,000%
Cycle 3: Duration – 1,064 days; Price increase – 2,000%
Bitcoin’s first cycle lasted roughly two years, when it was a niche experiment traded by early adopters on rudimentary exchanges. Gains were astronomical, but the base was tiny. As adoption grew, so did cycle duration: the second ran two and a half years, the third nearly three.
Notice the pattern? Each cycle extends by about six months, and this isn’t random. It reflects diminishing returns and rising market efficiency.
Linear Regression Model
Fast-forward to today, and our fourth cycle has ticked over 1,071 days. That’s squarely in the three-year territory, aligning eerily with the historical trend. If the six-month extension holds, the peak is still ahead.
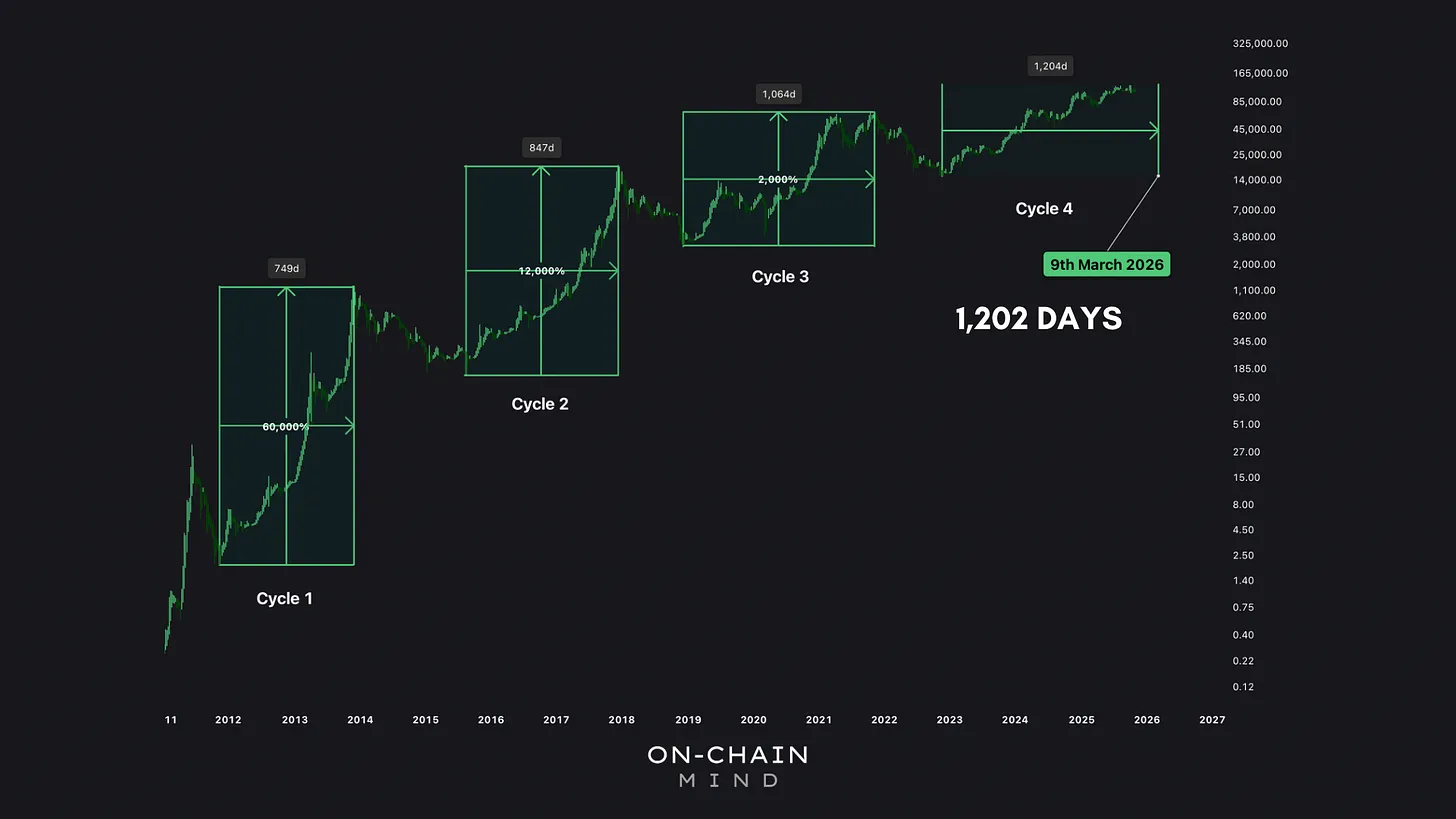
There are two main ways to model where the next Bitcoin peak may land. The first is the linear regression model.
This approach assumes that cycles continue extending at a steady, predictable rate, just like the first three cycles. Using this method, the fourth cycle would last approximately 1,202 days (around 3.5 years). Counting forward from the last bear market bottom gives a potential bull market peak around March 2026.
Linear regression is the most conservative model. It assumes Bitcoin continues along its historical glide path, without significant acceleration.
Quadratic Model
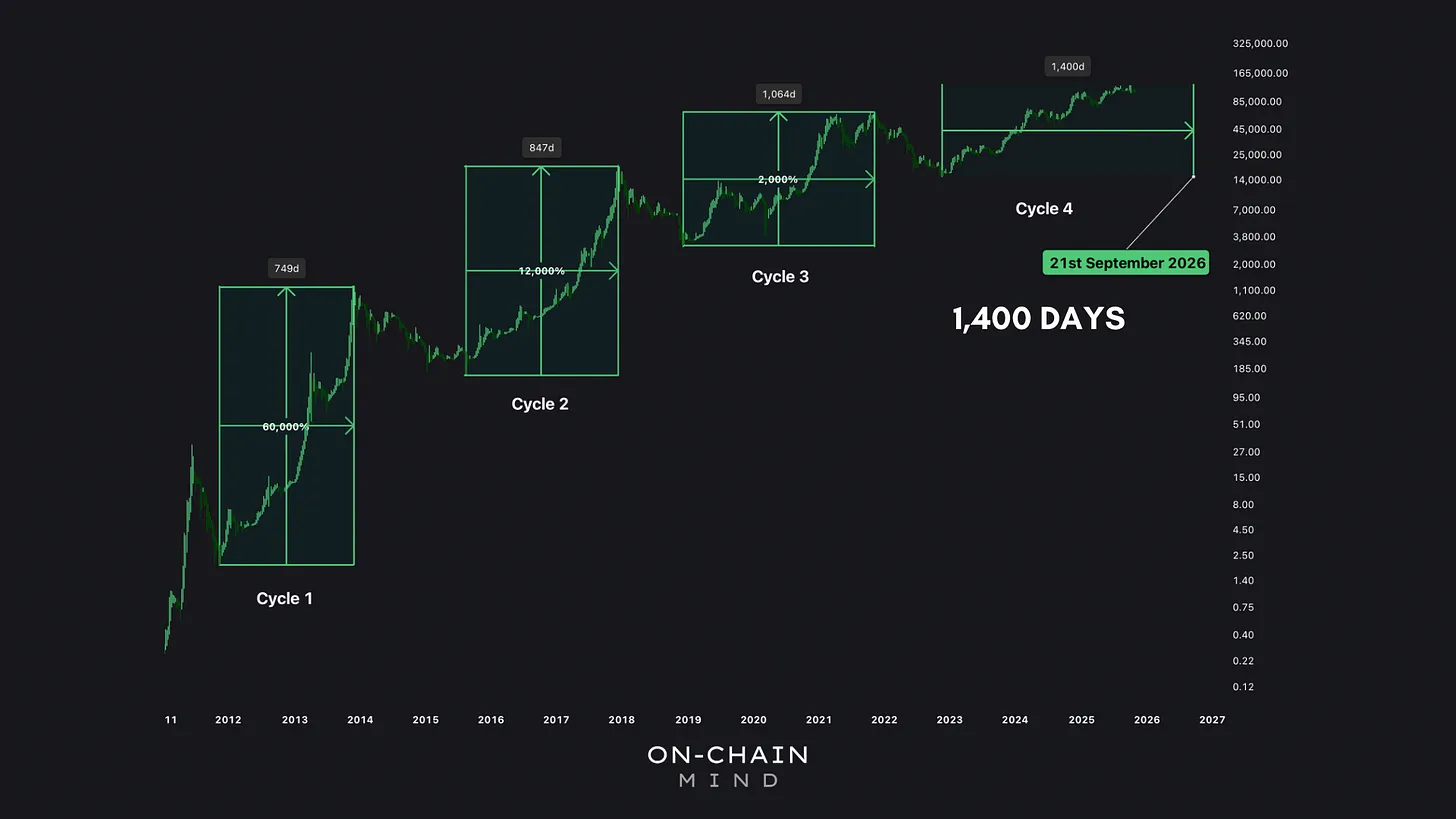
A more sophisticated approach accounts for accelerating cycle extensions. By fitting all three previous cycles, this model projects a fourth cycle duration of around 1,400 days (3.5–4 years), pointing to a possible peak around September 2026.
This method captures the compounding effect of longer cycles: the market not only stretches in time but also absorbs higher prices and investor conviction along the way.
Linear Regression Model Projections
To quantify potential valuations, I’m using my Logarithmic Growth Bands indicator. This tool maps Bitcoin’s long-term trajectory, accounting for diminishing returns as the asset matures.
Extrapolating to the linear regression target for March 2026, the model puts fair value around $106,000, with an upper bound near $243,000 and a lower bound around $52,000. In a classic euphoric bull phase, Bitcoin could trade between $174,000 and $243,000, reflecting how prices often overshoot fair value late in the cycle.
Quadratic Model Projections
Under the quadratic expansion scenario, which accounts for accelerated cycle lengthening, fair value rises to around $126,000, with potential peaks between $199,000 and $272,000.
The Psychology of Extended Cycles
Watch the video walkthrough on YouTube
Continue reading with OCM Premium
You have been reading the free preview of this article. The rest of it (about 250 more words) is for OCM Premium members. See OCM Premium plans.