
Every cycle has its breaking point: the moment the crowd snaps, the weak hands fold, and the market delivers its final reality check.
That moment looks like it’s arrived. Bitcoin has recorded the single largest short-term holder loss event in its entire history. And buried inside that pain is a story that tells us far more about where we are in the cycle than price alone ever could.
This piece is about figuring out which path we’re really on: the final flush of weak hands… or the opening act of something far uglier.
Key insights
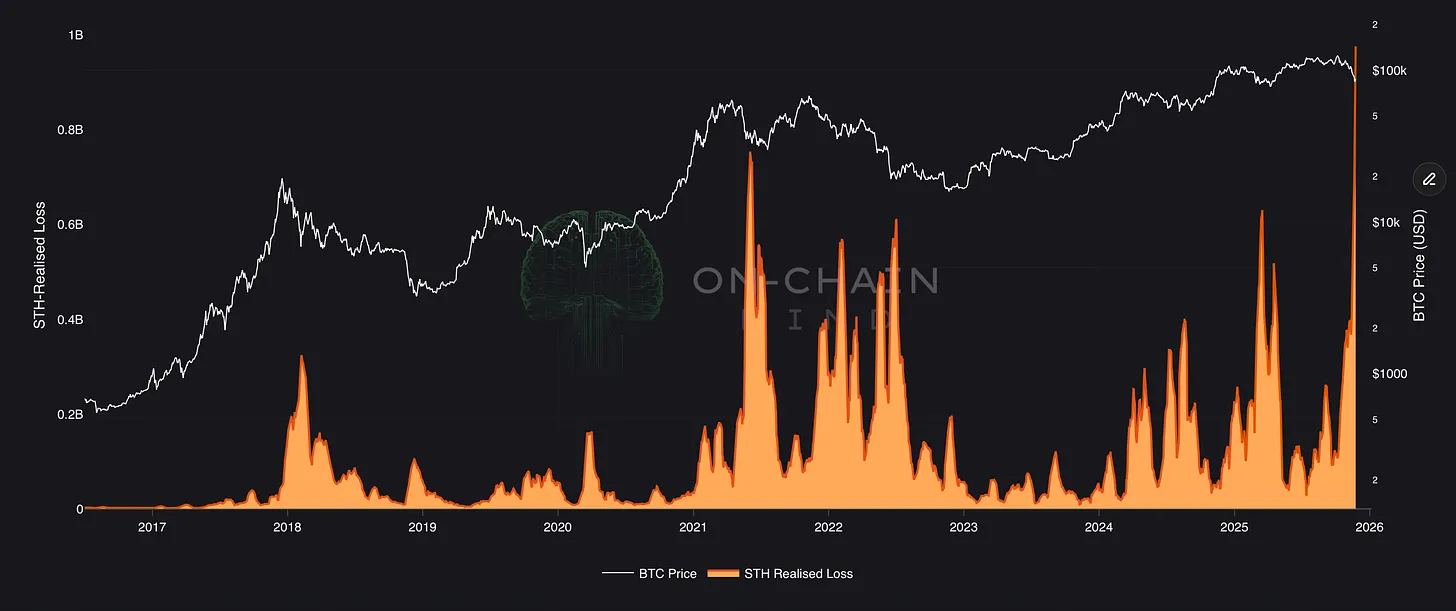
Record STH Pain: Short-term holders are realising >$900 m of losses daily — the biggest capitulation ever seen.
LTH Distribution Overhang: Long-term holders are still extracting ~$1.5 bn profit per day, suppressing the price and delaying a durable bottom.
The 2019 Analogue Is Back: A 6-month “mini bear” followed by a macro-driven rally in 2026 remains a compelling scenario.
Two Historical Paths: We sit at the exact crossroads between a mid-cycle shakeout and the start of a year long bear market.
The Largest Loss Event Ever Recorded
Let’s start with the headline metric: Short-Term Holder Realised Loss.
During this collapse, STHs have been crystallising just over $900 million in losses on a daily basis. To put that in perspective:
China mining ban (May–Jul 2021): peak daily loss ~$700 m
FTX collapse (Nov 2022): peak daily loss ~$500 m
Today (Nov 2025): peak daily loss >$900 m
This is categorically unprecedented.
When we look at the Net Realised Profit/Loss Ratio for the STH cohort, the current plunge into negative territory is almost as deep as the largest profit-taking spikes we have ever seen on the way up.
That is psychologically fascinating. Classical behavioural finance tells us people feel the pain of a loss roughly twice as intensely as the pleasure of an equivalent gain. Therefore profit-taking events are normally sharp and violent, while loss-realisation tends to be slow and reluctant.
Yet here we are watching the mirror image: short-term holders are ripping the band-aid off at warp speed. They are not “hoping it comes back”. They are hitting sell first and asking questions later. That tells us two things:
Fear is overwhelming greed right now.
An enormous volume of weak hands has already been flushed.
And that’s not the end of it.
The $70 Billion Paper Time-Bomb
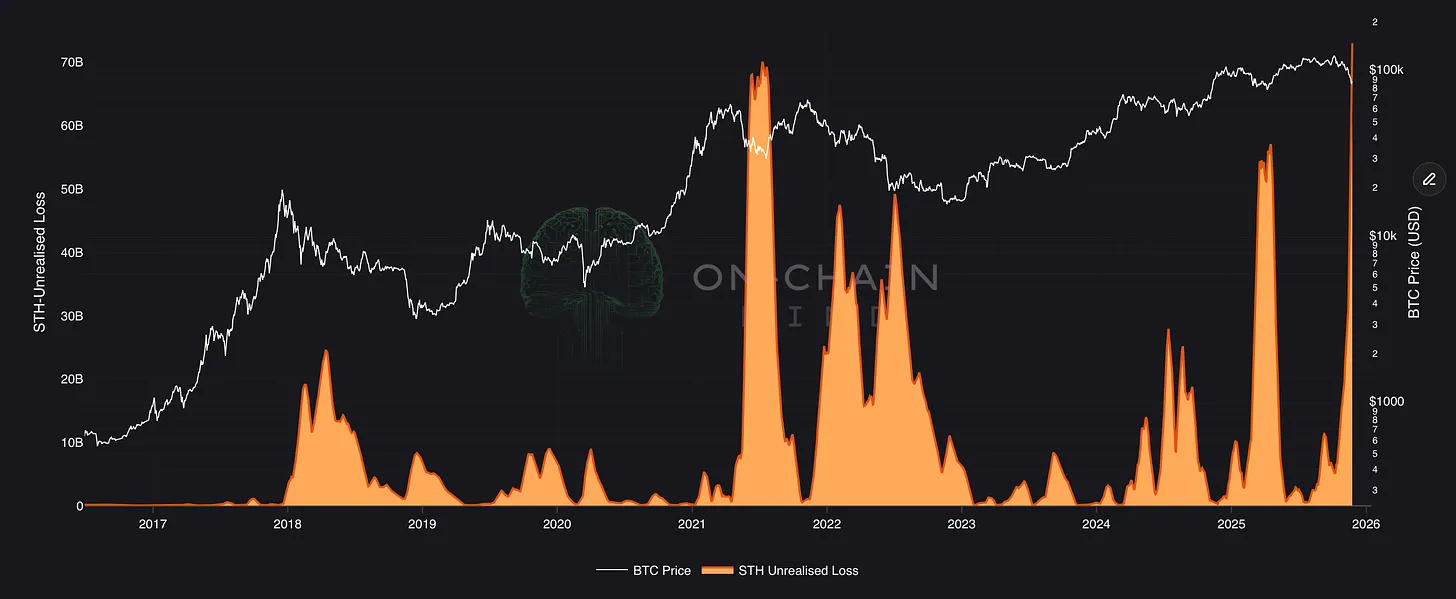
Short-term holders are still sitting on $70+ billion in unrealised losses, which is the largest on-chain paper loss for this group ever recorded. That’s an immense amount of trapped pain still sitting on the books.
If you’re a contrarian, this feels like blood in the streets, and your eyebrows should be hitting the ceiling. Historically, this kind of extreme capitulation is often what precedes meaningful market turning points.
But context matters, and the broader picture complicates things.
The Fork in the Road
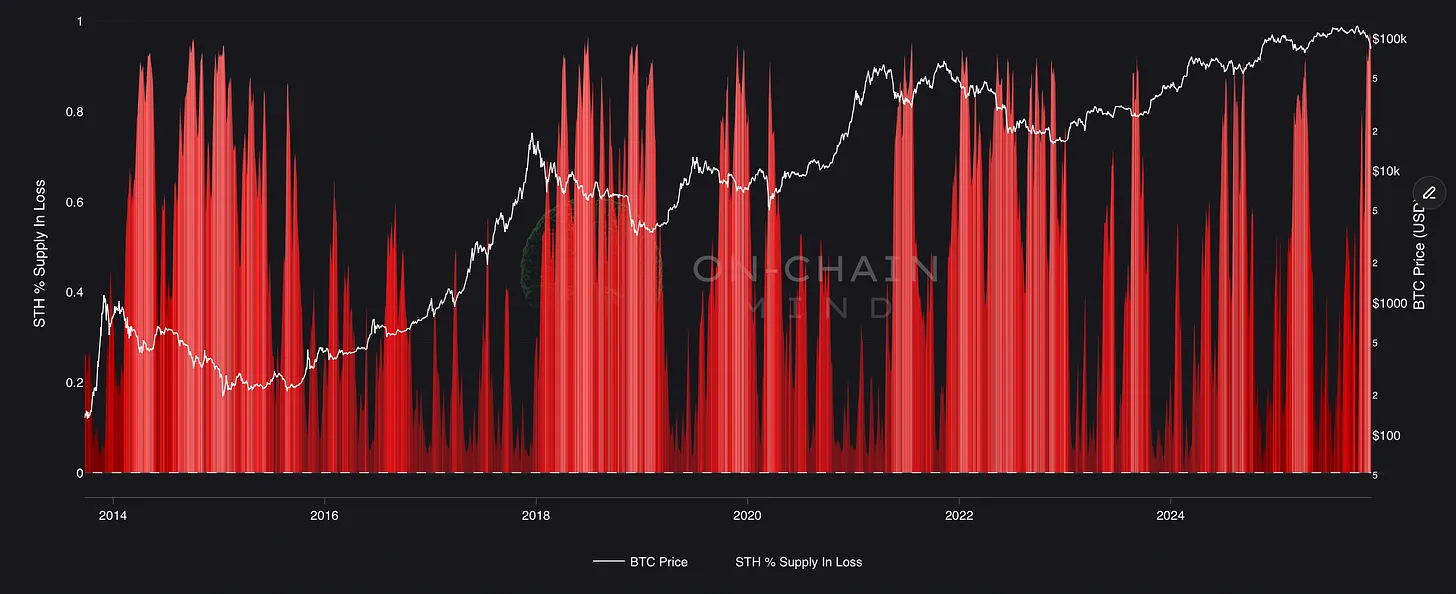
To understand whether this is a short reset or the beginning of a larger structural decline, we need to look at the percentage of short-term holder supply currently in loss. As of now, it’s hovering around 90%.
Across Bitcoin’s history, this metric reliably tracks two very different environments:
Pattern 1: The Mid-Cycle Shakeout
This is what we’ve seen repeatedly in this cycle:
August 2023
August 2024
April 2025
Whenever 80–90% of STH coins go underwater, Bitcoin prints a local bottom within days or weeks. Then the market grinds higher as new demand quietly absorbs the supply glut.
It’s been almost mechanical. Many analysts are still leaning on this pattern and calling the current drop a healthy cycle reset.
Pattern 2: The Start of a True Bear Market
This pattern is the one you don’t want. In 2014, 2018, and 2022, once STH supply-in-loss crossed ~85%, it didn’t bounce. It lingered for months, sometimes for over a year, because new buyers simply refused to step in.
What distinguishes the two patterns is simple but critical: does the rest of the market start drowning too?
Supply in Loss Across the Entire Network
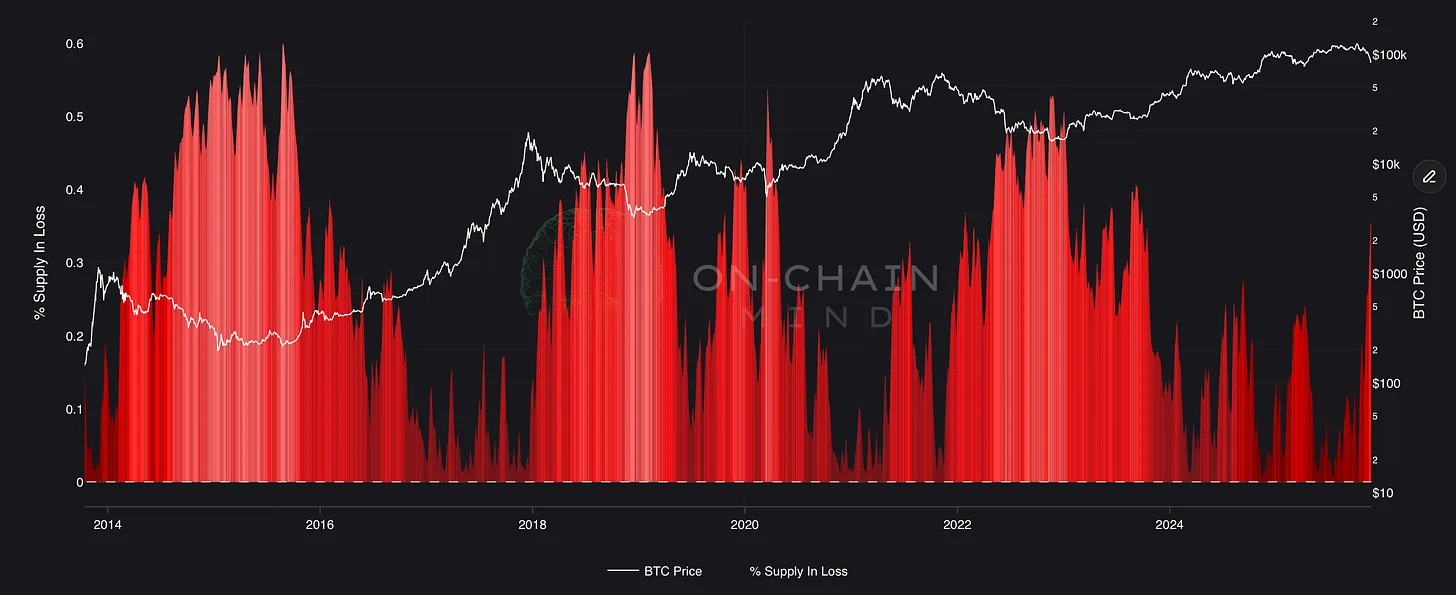
When you look at the same supply in loss metric across all coins (including long-term holders), the cycles separate cleanly:
In bull corrections, total supply in loss rarely breaches 30%.
In bear markets, it grinds between 40–60% for 10–14 months.
We are currently sitting at around 35%.
That puts us right between healthy dip and deep trouble.
We’re in no-man’s-land, where a decisive move either direction determines whether this is a short reset or the start of something more brutal.
If this metric pushes above 40% and stays there, the data would be signalling a genuine, extended bear market.
We’re not there yet. But we’re close.
The 2019 Analogue: A Compelling Middle Path
One scenario I find increasingly plausible is a 2019-style “mini-bear”.
Many macro analysts are now forecasting 2026 as the real liquidity rebirth year (Fed pivot complete, balance-sheet expansion, risk-on regime). Bitcoin historically loves those environments.
That raises a valid possibility:
A 6-month mini bear from now into March/April 2026, followed by another powerful rest of the year once liquidity returns.
Nothing is guaranteed. But the structure fits.
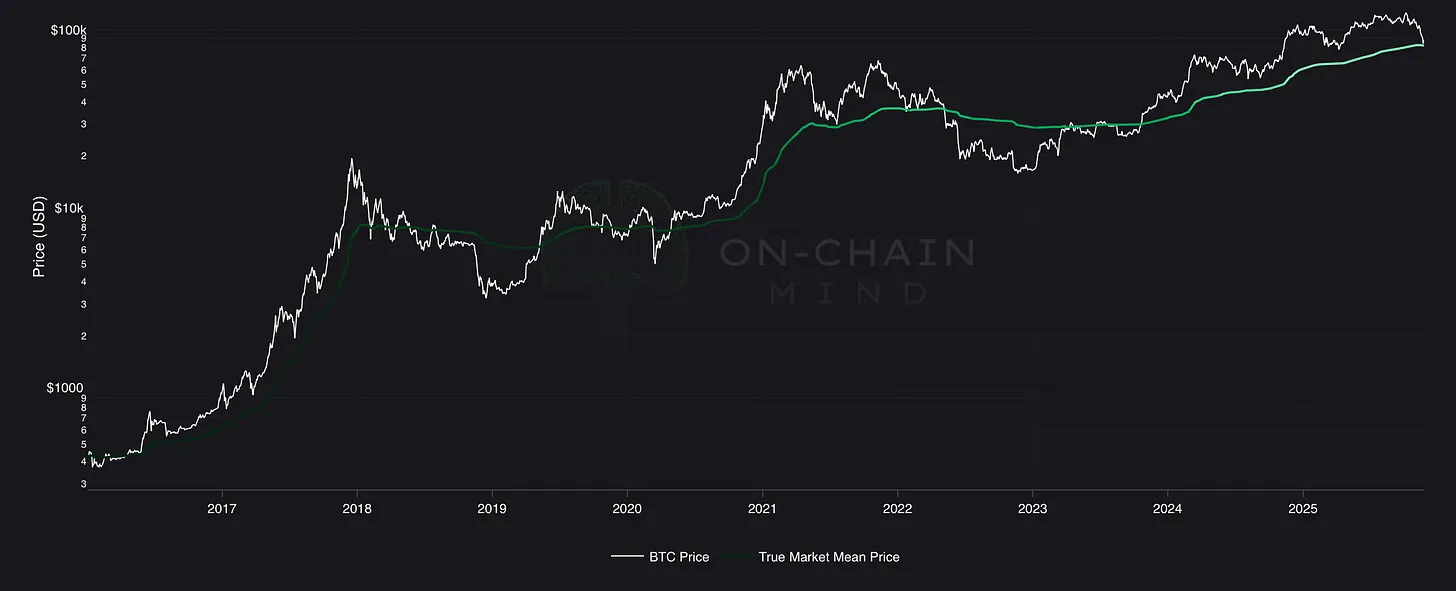
In that world, price would likely orbit the True Market Mean — the average acquisition cost of all Bitcoin in existence (excluding Satoshi-era coins). That currently sits around $81,000. I would expect messy two-sided volatility ±$10karound that level until macro conditions eventually improved.
The Real Dead Weight
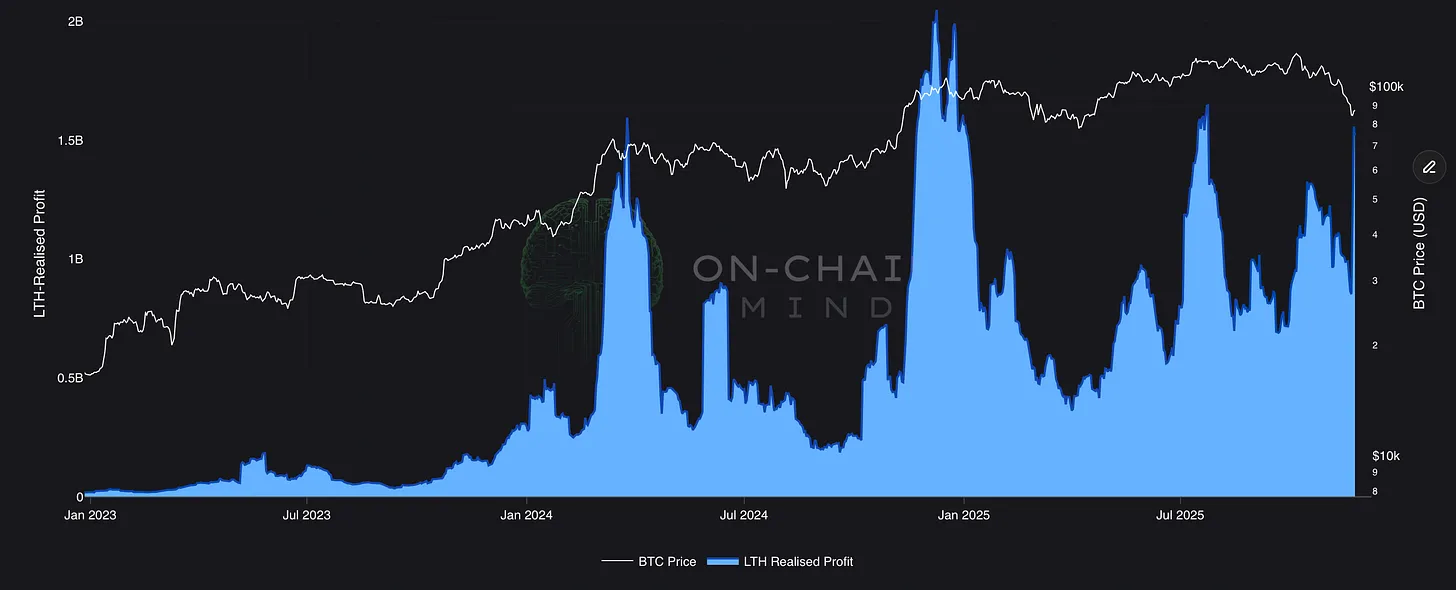
Short-term holder panic is the headline today, but the true weight on price right now is actually the LTH distribution. Long-term holders are still realising roughly $1.5 billion of profit every single day — a volume that rivals the peak distribution phases of the other 2025 local tops.
Every dollar they take off the table is fresh supply that has to be absorbed. Until that flow slows, durable bottoms are mathematically difficult.
There is a silver lining though. The unrealised LTH profit margins are collapsing along with price. At $126k, the average LTH was sitting on ~450% unrealised gain. At current price levels that is down to ~130%. The financial incentive to keep selling erodes with every downtick. That exhaustion mechanism is already in motion and has historically capped sell-offs.
The One Chart That Will Tell Us When It’s Over
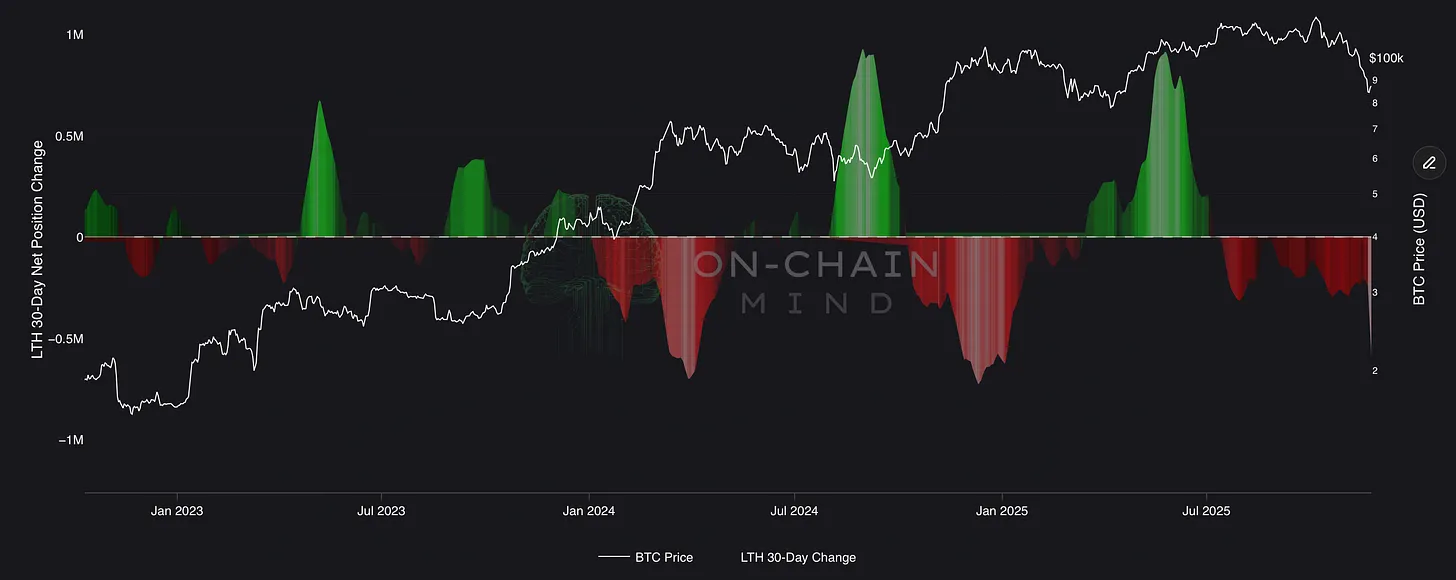
If I had to watch only one indicator right now, it would be the Long-Term Holder 30-Day Net Position Change.
Green bars = LTHs accumulating → incredible buying zones.
Red bars = LTHs distributing → sustained downward pressure.
We are currently bleeding ~600,000 BTC per month net from LTH wallets, which is one of the largest negative readings this cycle. Until this metric flattens or flips green, the path of least resistance remains lower. It really is that binary.
The Futures Market: A Mess That Needs to Clear
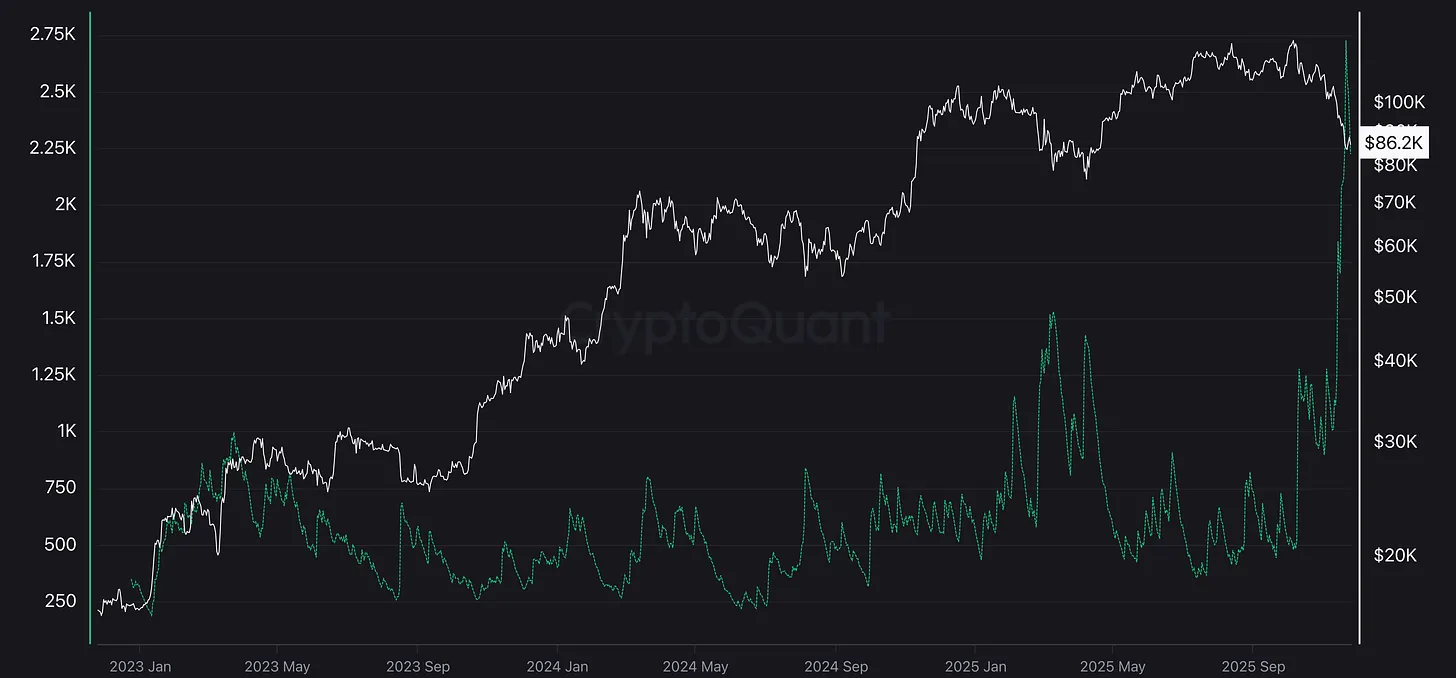
One final piece of the puzzle: perpetual futures markets are still seeing massive long liquidations. Degens continue to ape leveraged longs into one of the cleanest downtrends we have had in years.
Spot dip-buying is rational. Leveraged long hunting the exact bottom is gambling with fire. What we need to see is funding turning deeply negative and the average leveraged punter flipping net short. That sets up the short-squeeze reflex that often marks vicious reversals.
Where I Stand Today
Watch the video walkthrough on YouTube
Continue reading with OCM Premium
You have been reading the free preview of this article. The rest of it (about 300 more words) is for OCM Premium members. See OCM Premium plans.